December 1, 2022 release notes
UI
Ranking order for visualizations
Show the top or bottom groups for a visualization with a ranking order. For example, these two charts show the 3 cities with the warmest temperature (value grouped by city) with a Ranking Order of Top, or the 3 coldest cities with Bottom:
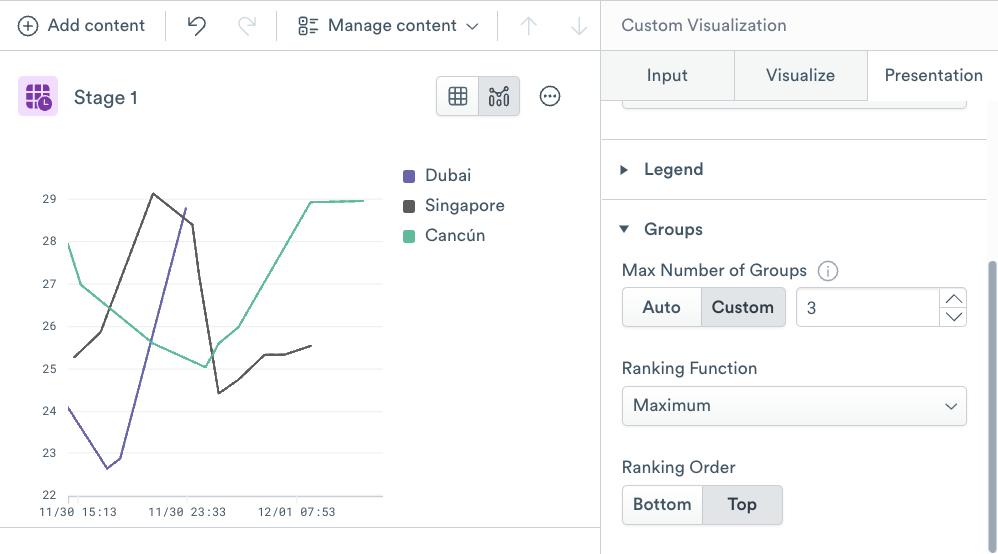

To use Ranking Order, make sure your visualization has a Group By field in the Visualize tab, then go to Groups in the Presentation tab and choose your ranking options.
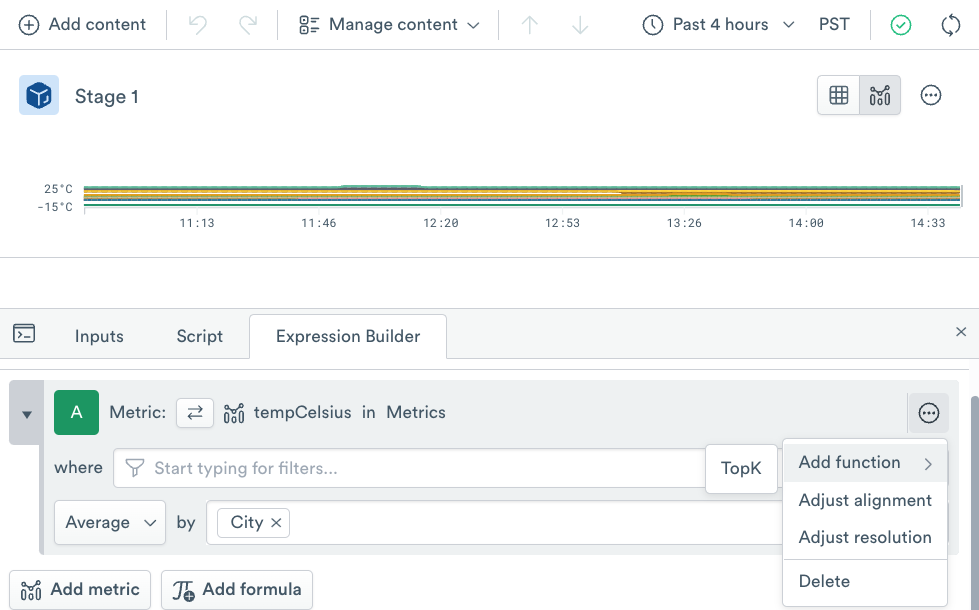
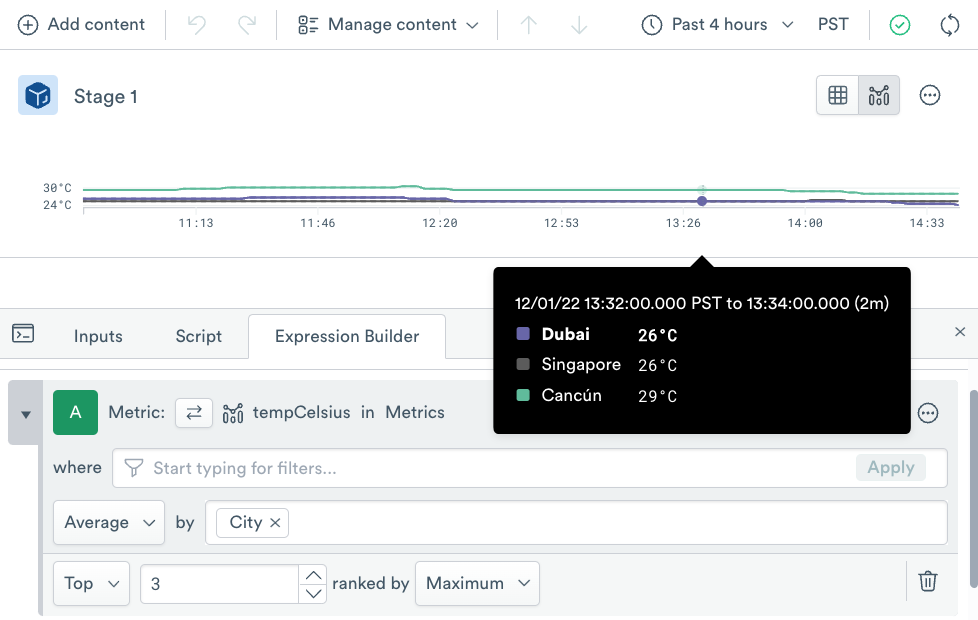
You may also rank grouped values in the Expression Builder by adding the TopK function in the expression builder:
OPAL
Advanced JSON operations with get_jmespath()
The get_jmespath() function accepts a JSON object (or an array of JSON objects) and a JMESPath query and returns an array containing the results. JMESPath is a query language for working with JSON.
get_regex_all() and match_regex()
The existing match_regex_all() function has been deprecated and renamed get_regex_all().
Additionally, a new regex function, get_regex(), returns a string containing the matching regex group or string, if any.
Integrations
GitLab app
Use the new Observe GitLab app to track what is happening with your GitLab repositories, issues, commits, and more.