Jenkins CI/CD Integration
The Jenkins app ingests data using Fluent Bit, similar to the Host Monitoring Integration, as well as the Jenkins Statistics Gatherer plugin.
Observe helps you monitor the activity and health of your Jenkins pipeline with datasets that include information about your Jenkins jobs, builds, build logs, nodes, agents, and more.
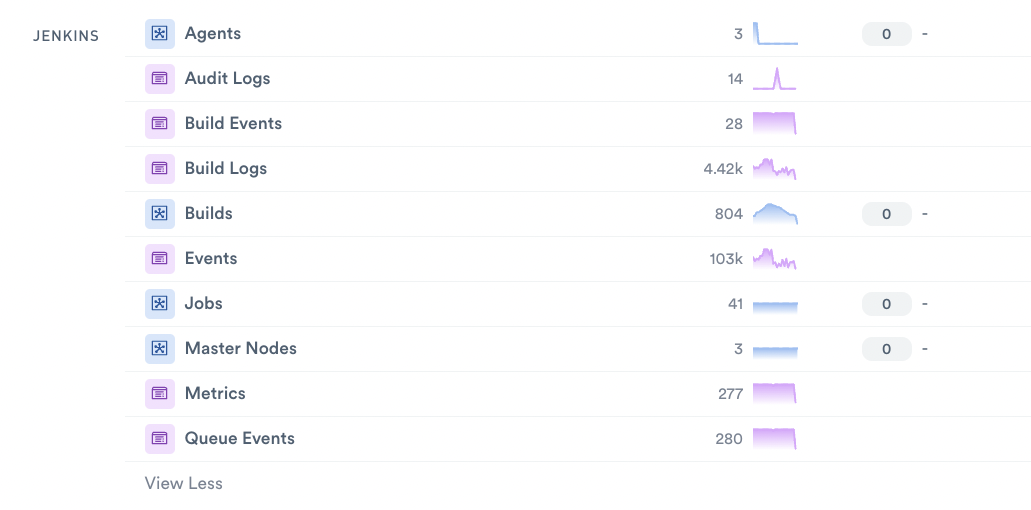
Figure 1 - List of Jenkins datasets in Observe
When you install the Jenkins app, the app also installs two dashboards by default:
Jenkins Home - displays data about your jobs.
Jenkins Jobs Overview - displays data about jobs and builds.
Viewing Jenkins data in Observe
Jenkins Builds Dataset
The Jenkins Builds Dashboard shows you aggregate metrics for your Jenkins builds, such as:
Build time
Queue time
Results
Failure causes
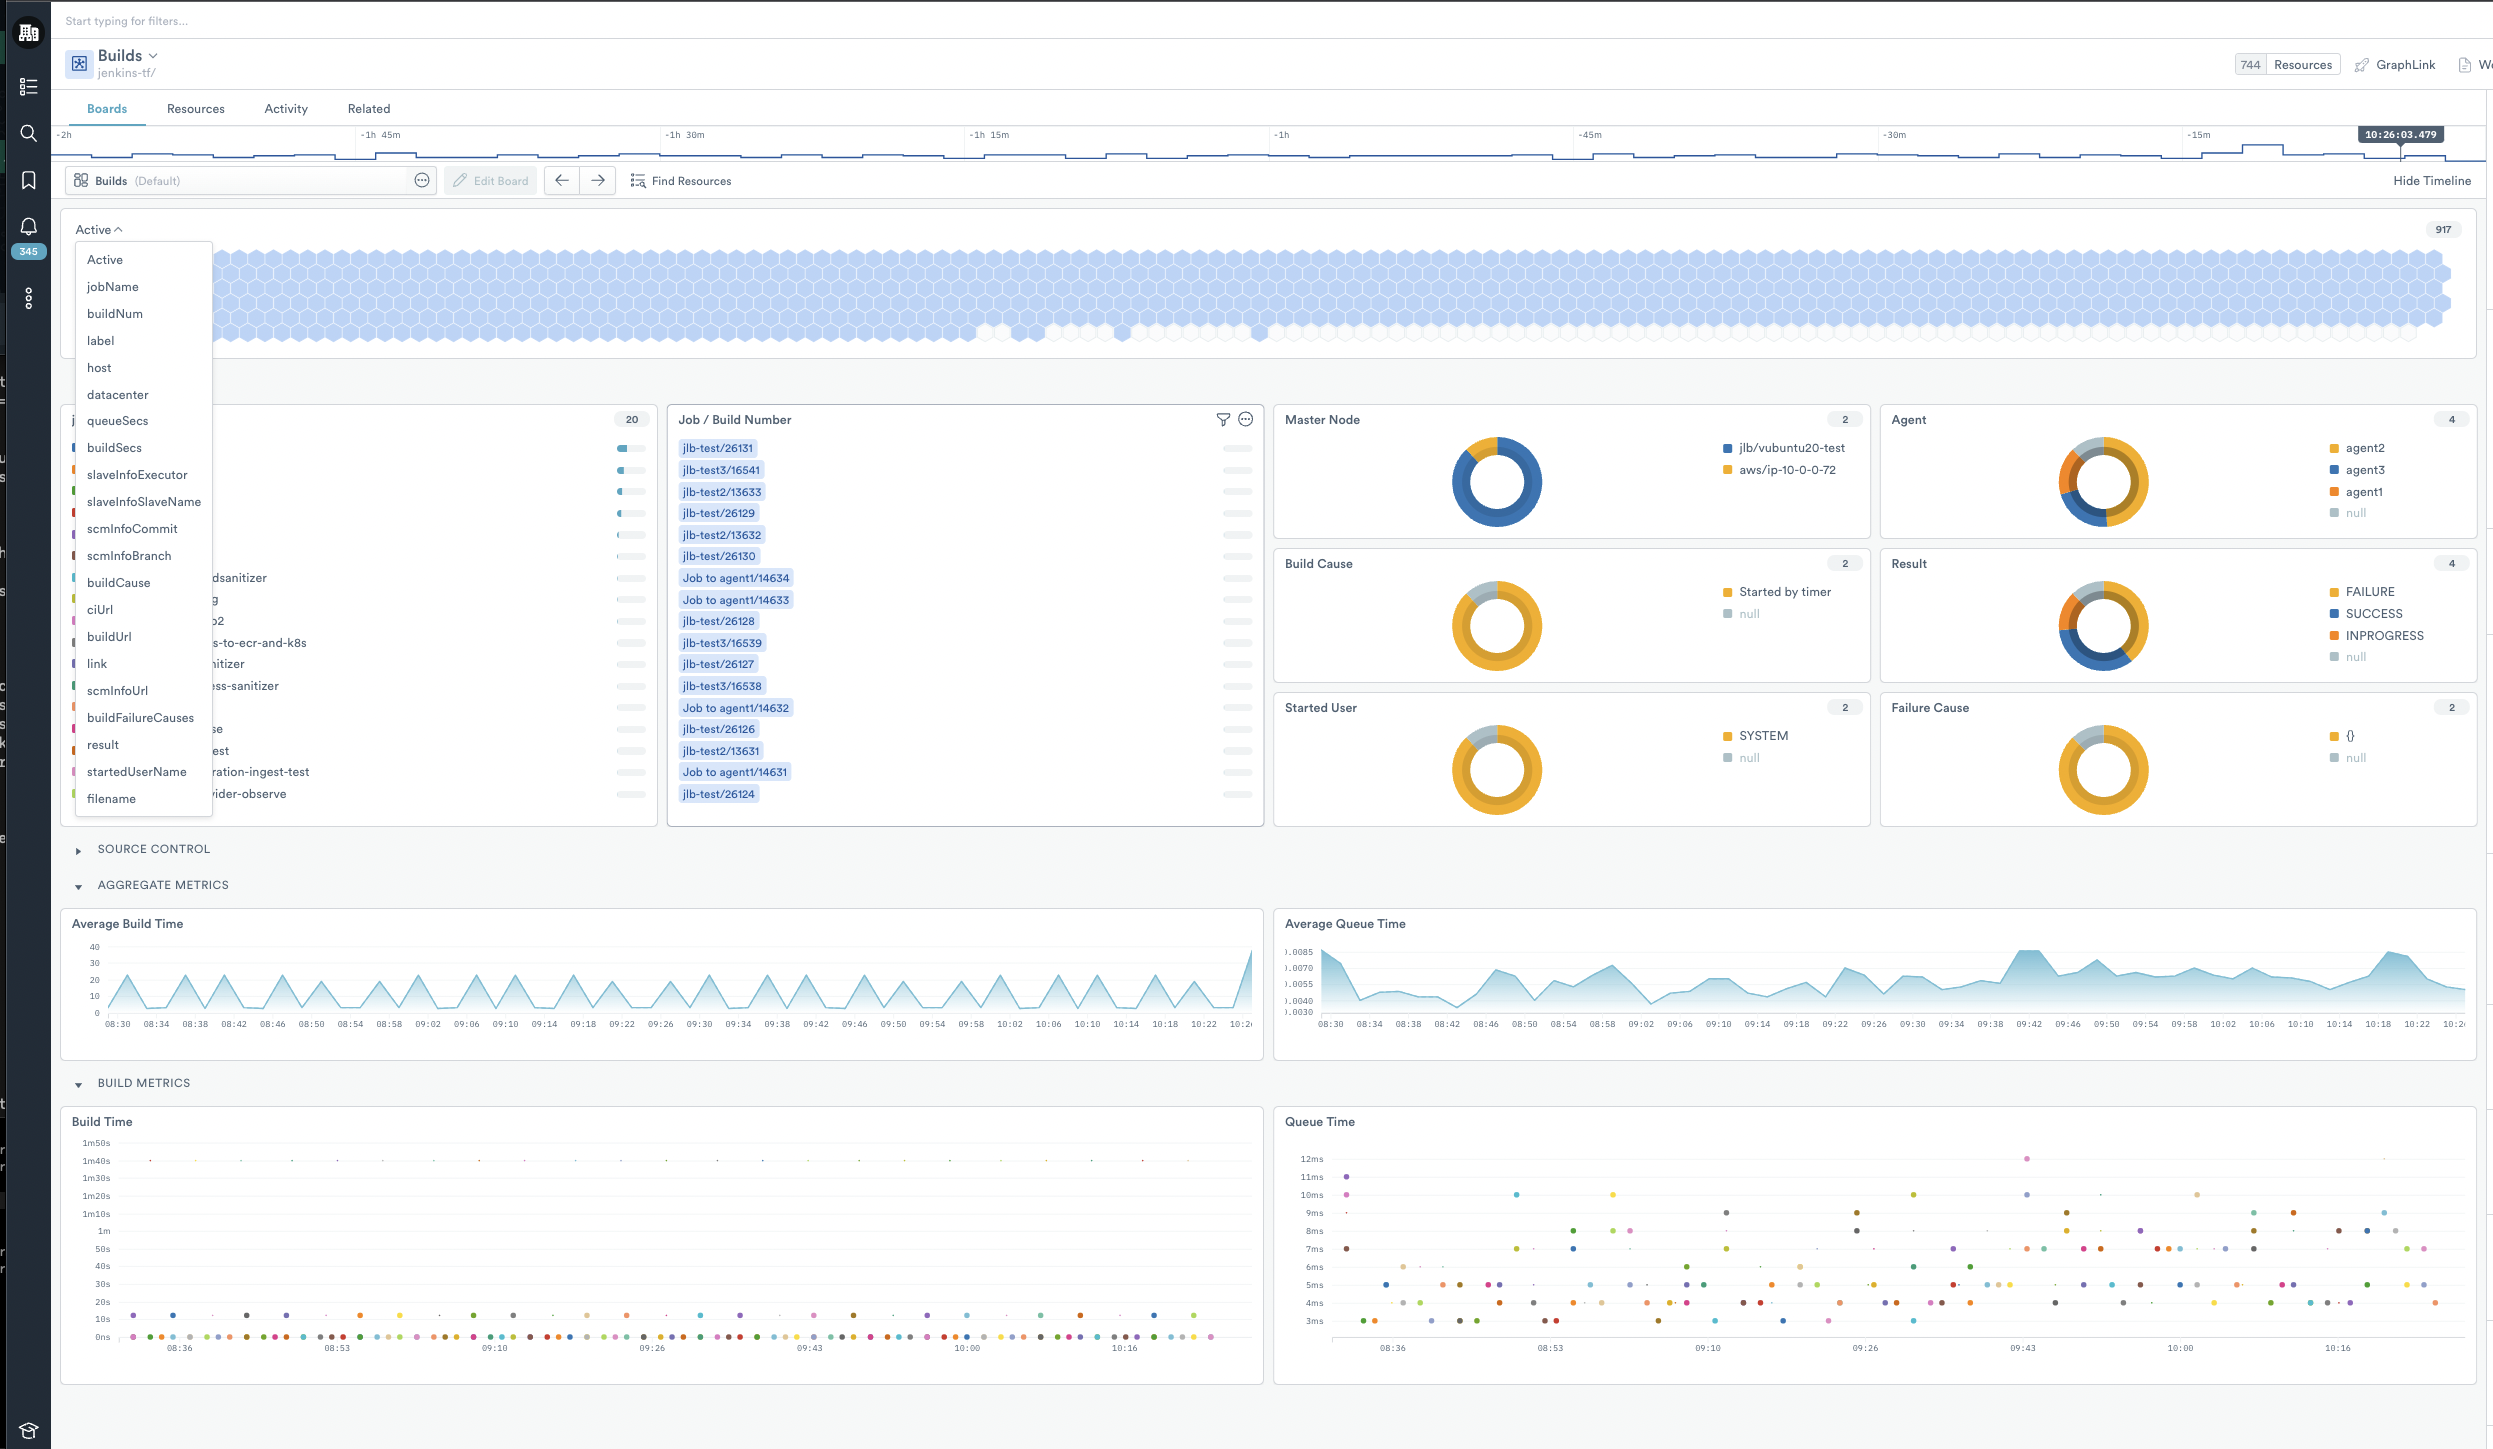
Figure 2 - Jenkins Builds dashboards in Observe
The Jenkins Builds dashboard displays the status over time for individual Jenkins builds, with links to the related Job node and the Jenkins configuration page for that build. Get immediate visibility into each build with these metrics:
Current status
Result
Queue Time
Build Time
Node and Agent
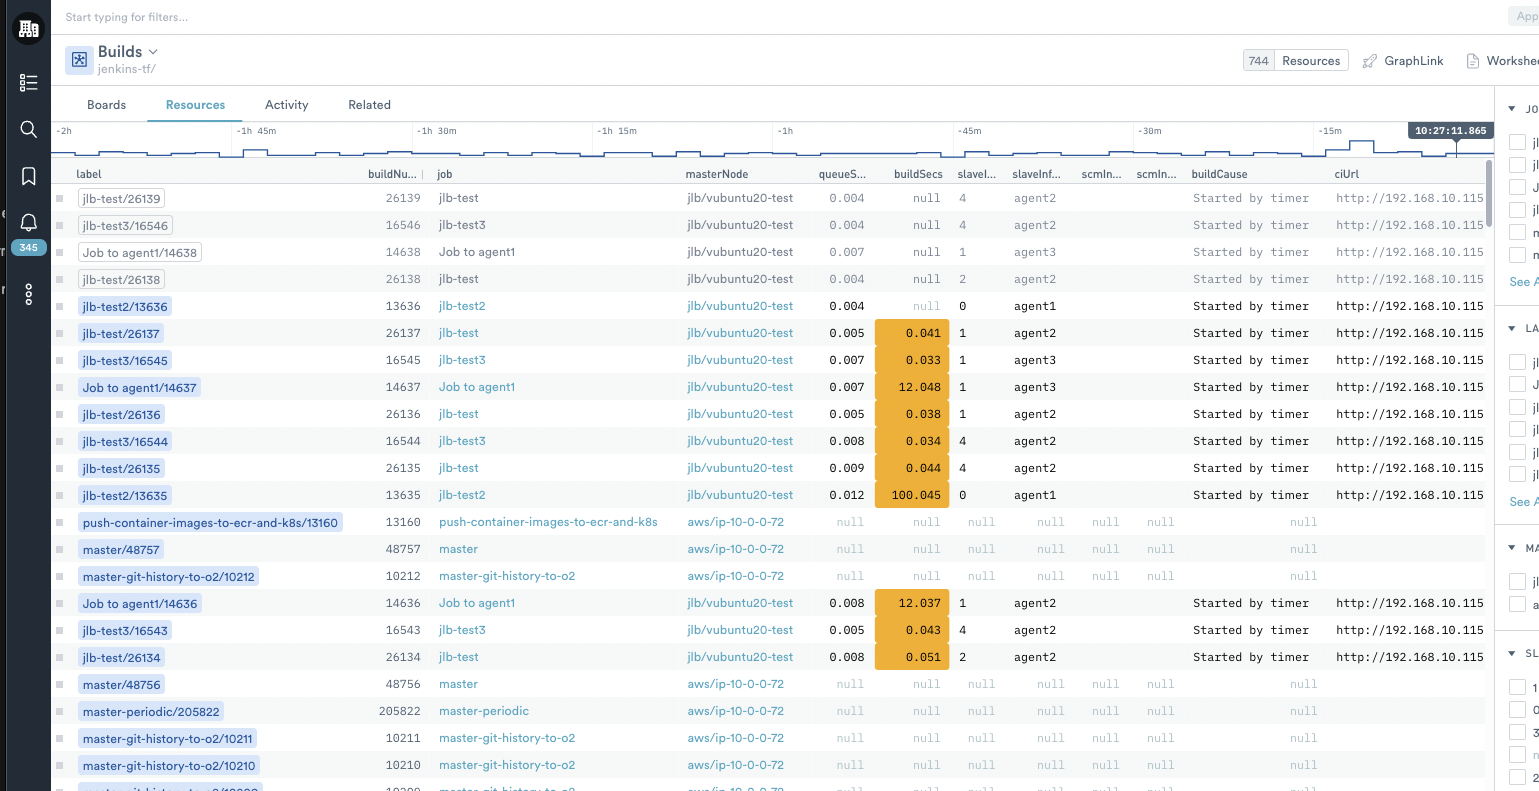
Figure 3 - Jenkins Resource dataset with details for each job
Jenkins Jobs Dataset
The Jenkins Jobs Resource dataset shows aggregate metrics for each job configured in your environment. You can also link to the individual builds in the builds dataset. Cards include these types:
Success Count
Failure Count
Average Queue Time
Average Run Duration
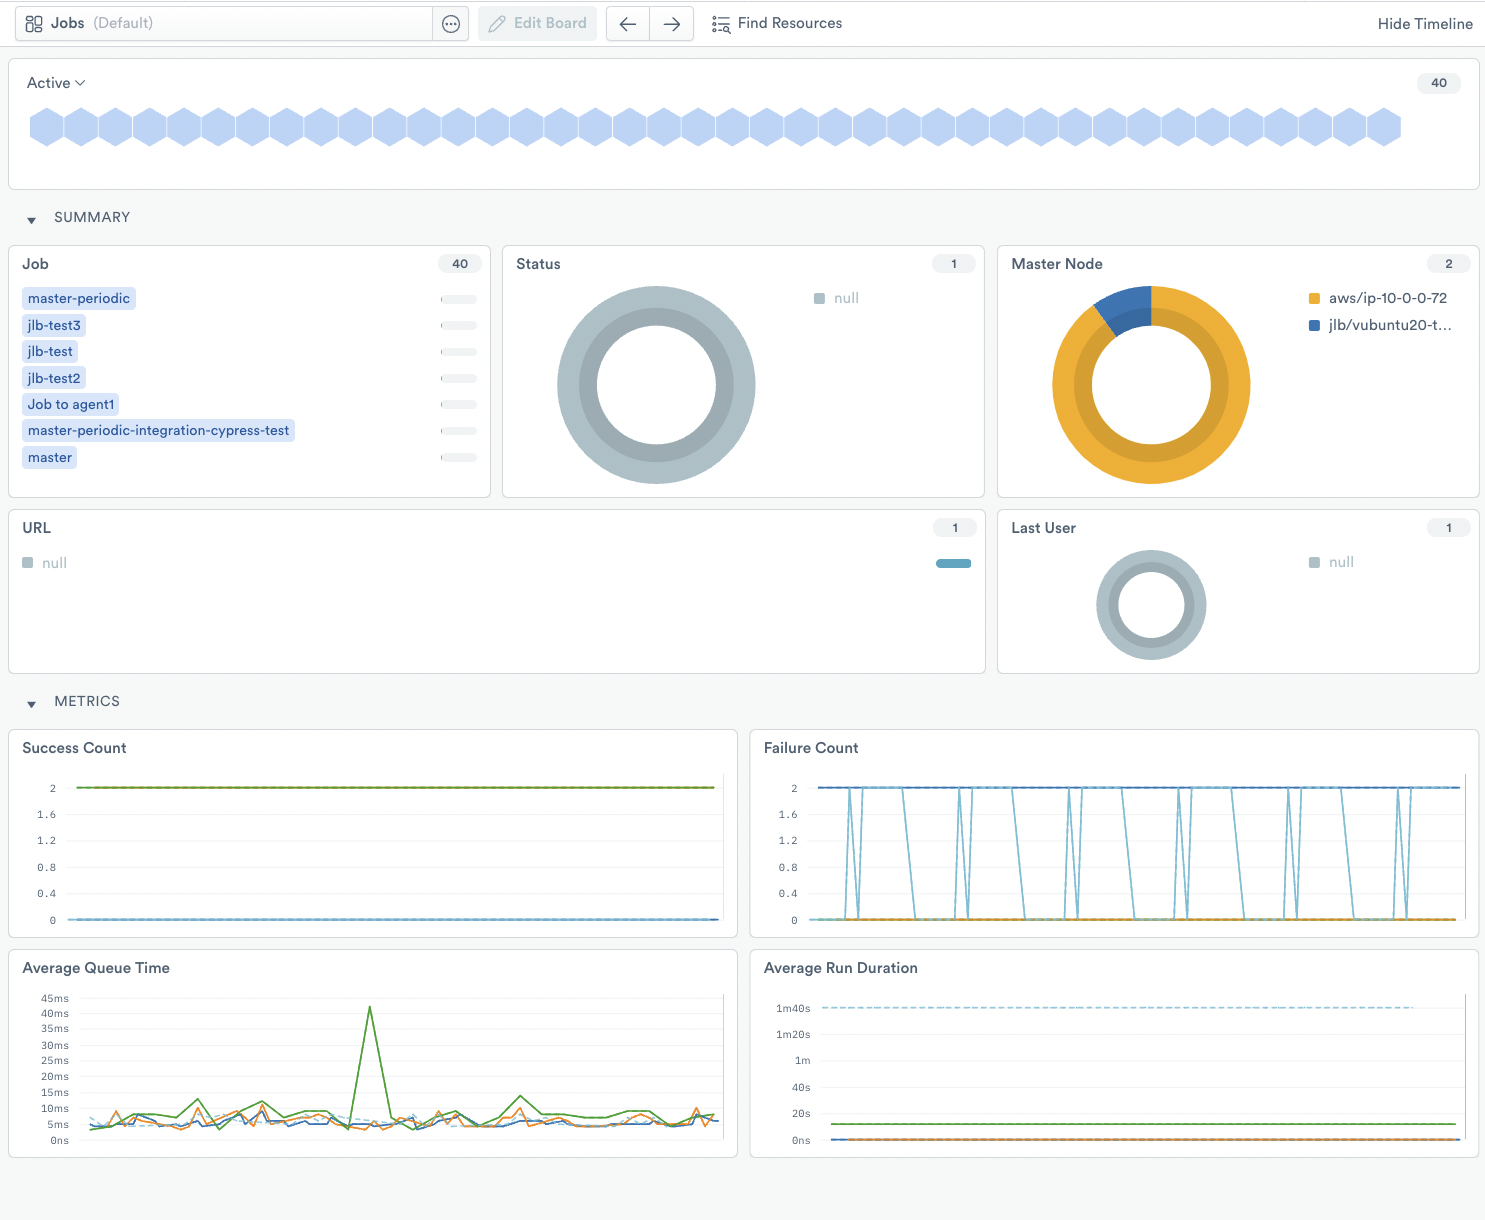
Figure 4 - Jenkins Jobs dataset with details for each job
Host Monitoring Integration Link
If you also installed the Observe Host monitoring integration, you can use GraphLink to view other related data sources, such as the Jobs, Nodes, Agents, and all of the metrics provided by the Host Monitoring Integration for the host of your Jenkins server.
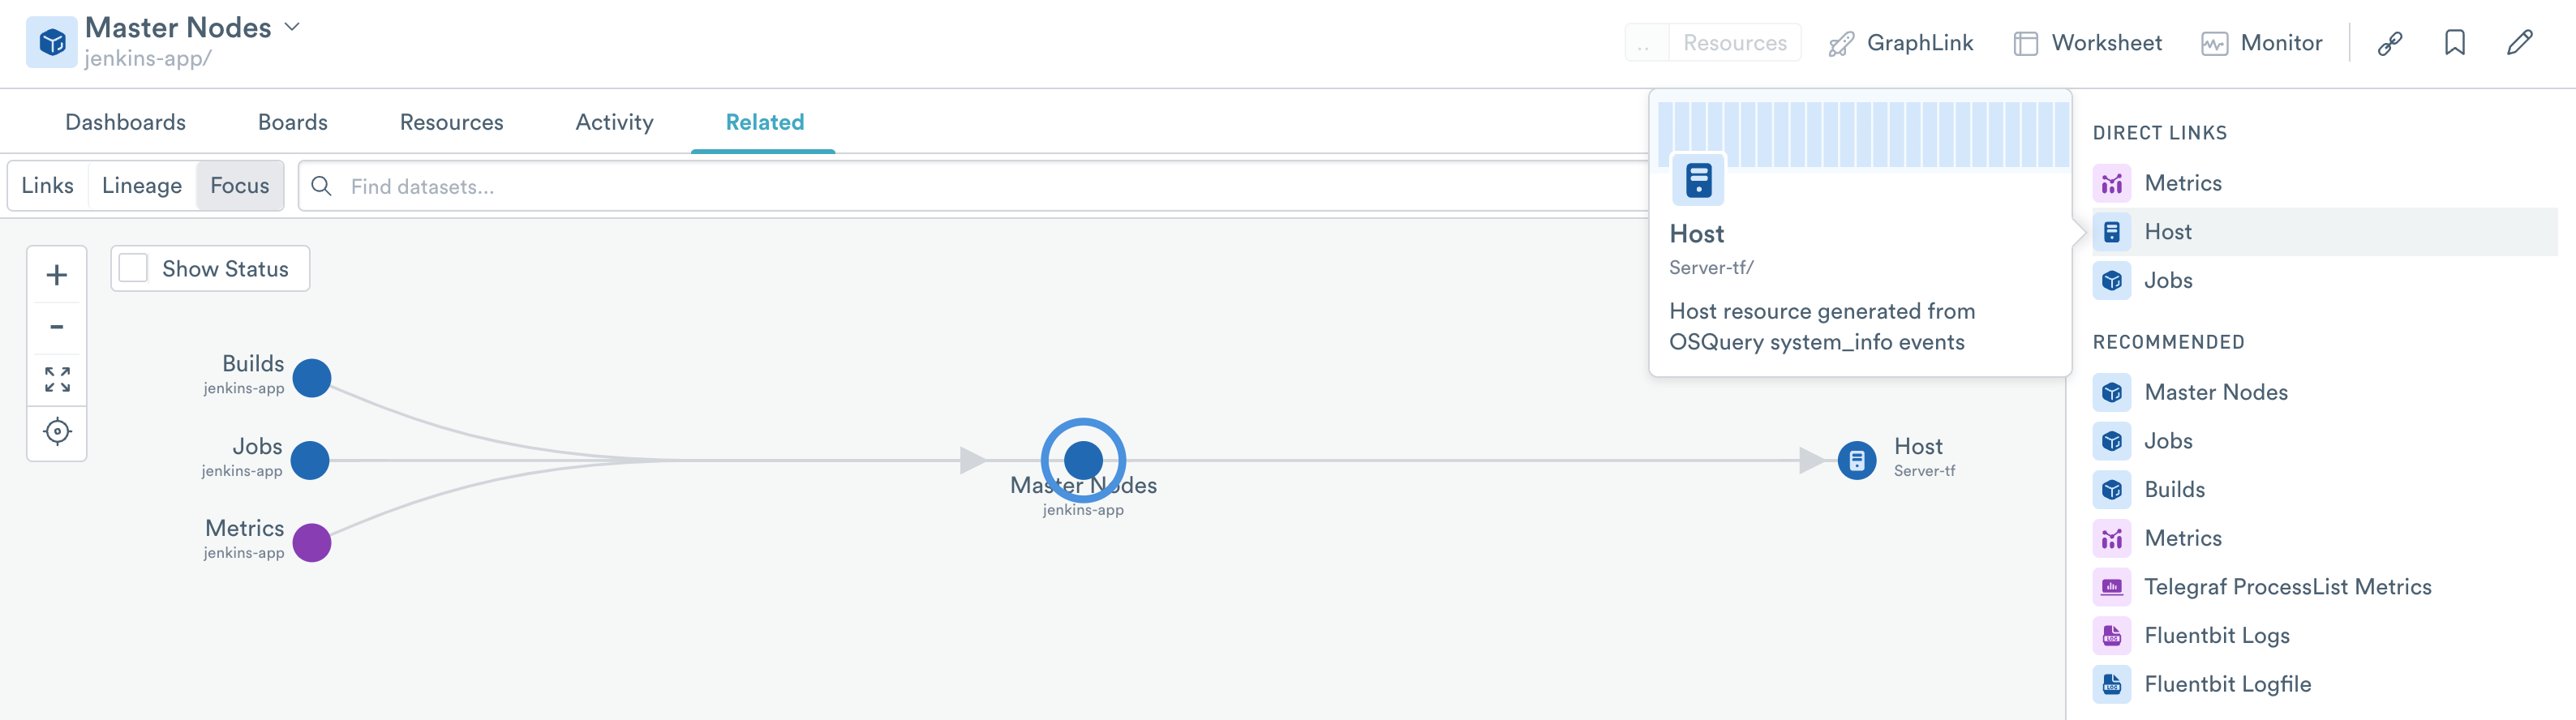
Figure 5 - Using GraphLink with Jenkins and Host applications
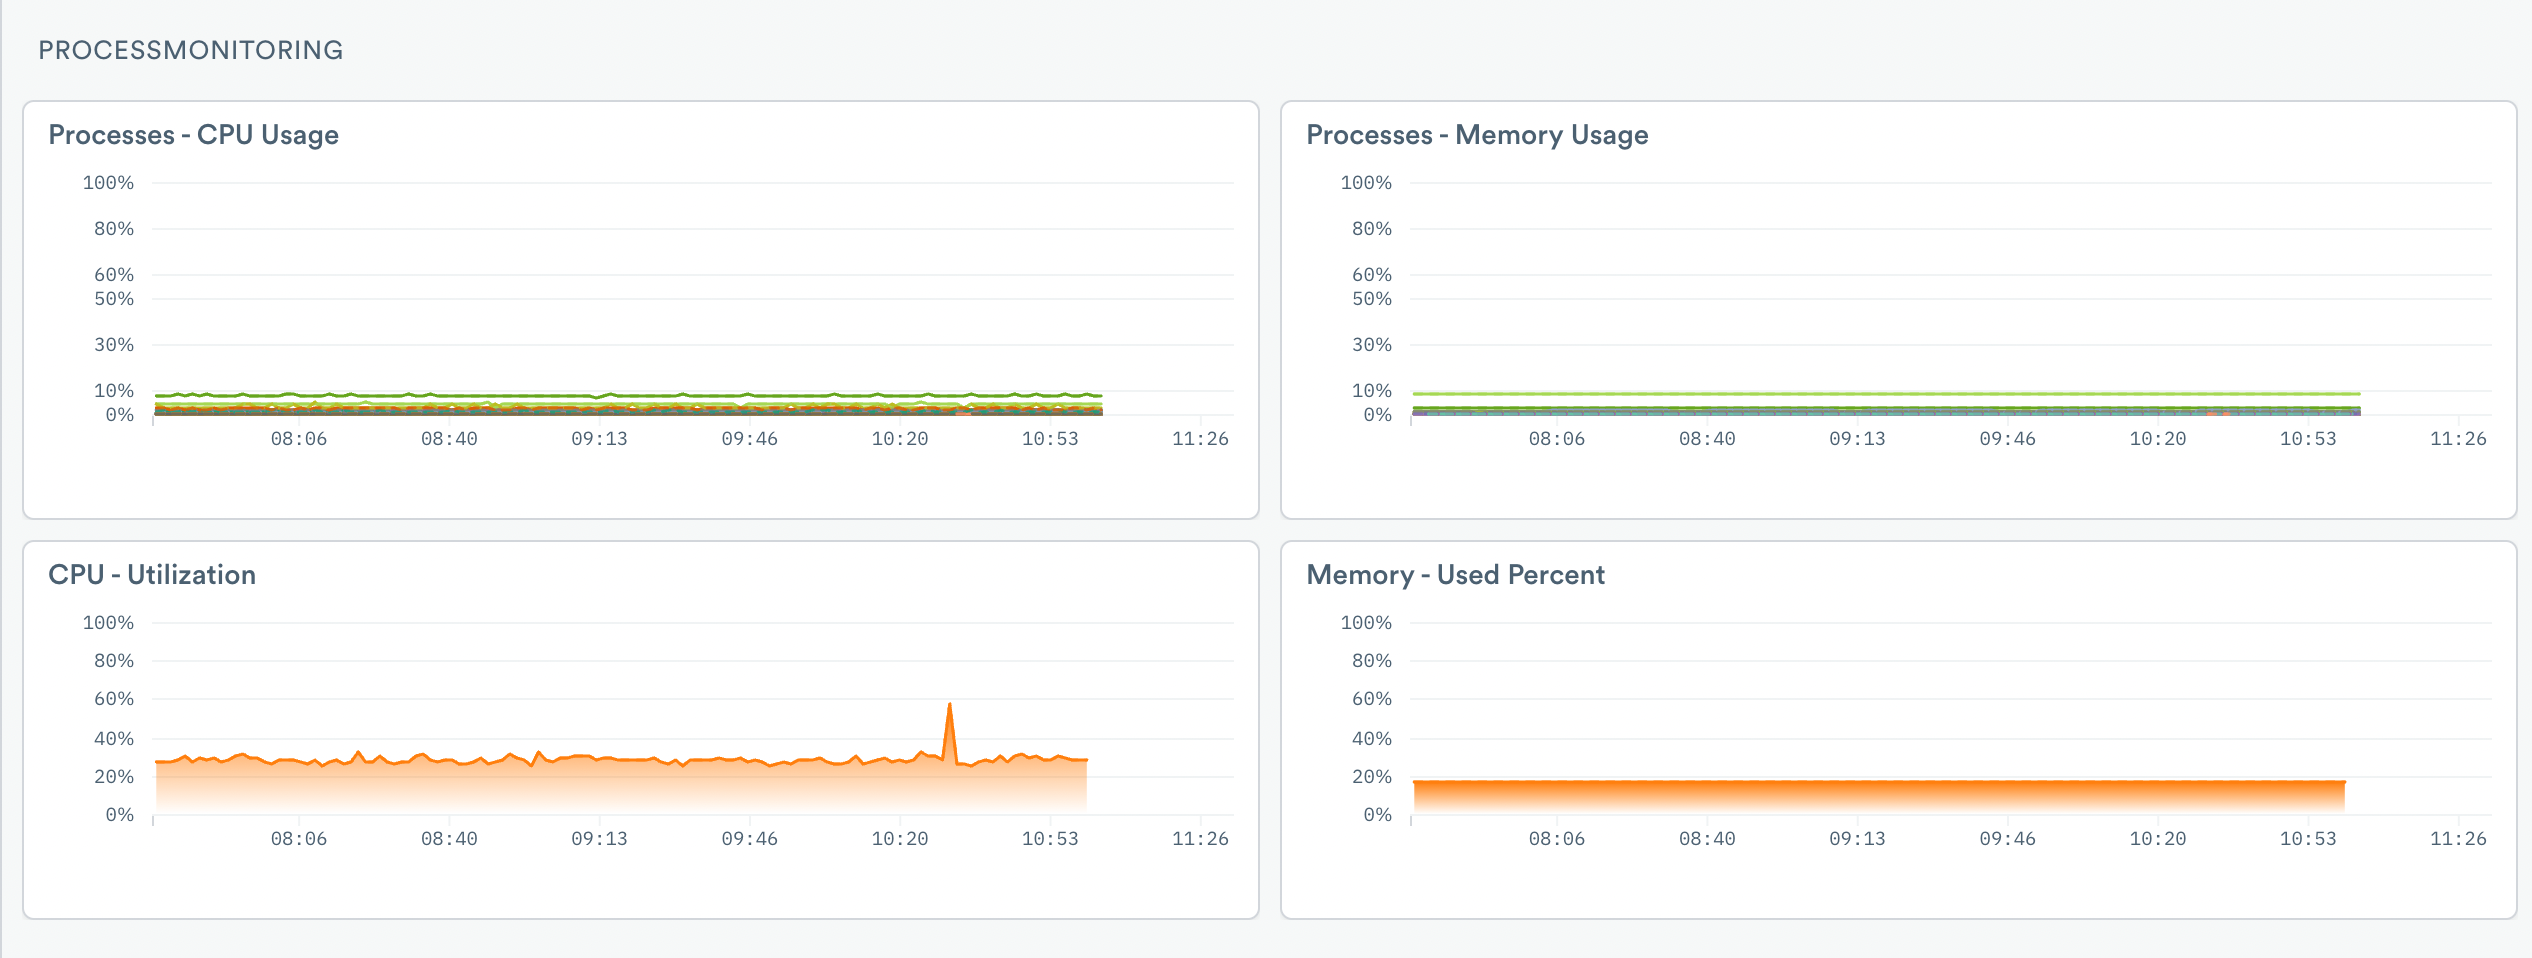
Figure 6 - Example of a Process monitoring dashboard
Setup
The Jenkins app ingests data using Fluent Bit, similar to the Host Monitoring Integration/App, as well as the Jenkins Statistics Gatherer plugin. To install and configure data collection, see the Jenkins installation guide.
As Observe ingests this data, the out-of-the-box datasets and boards display information about your Jenkins pipeline.