Trace Explorer
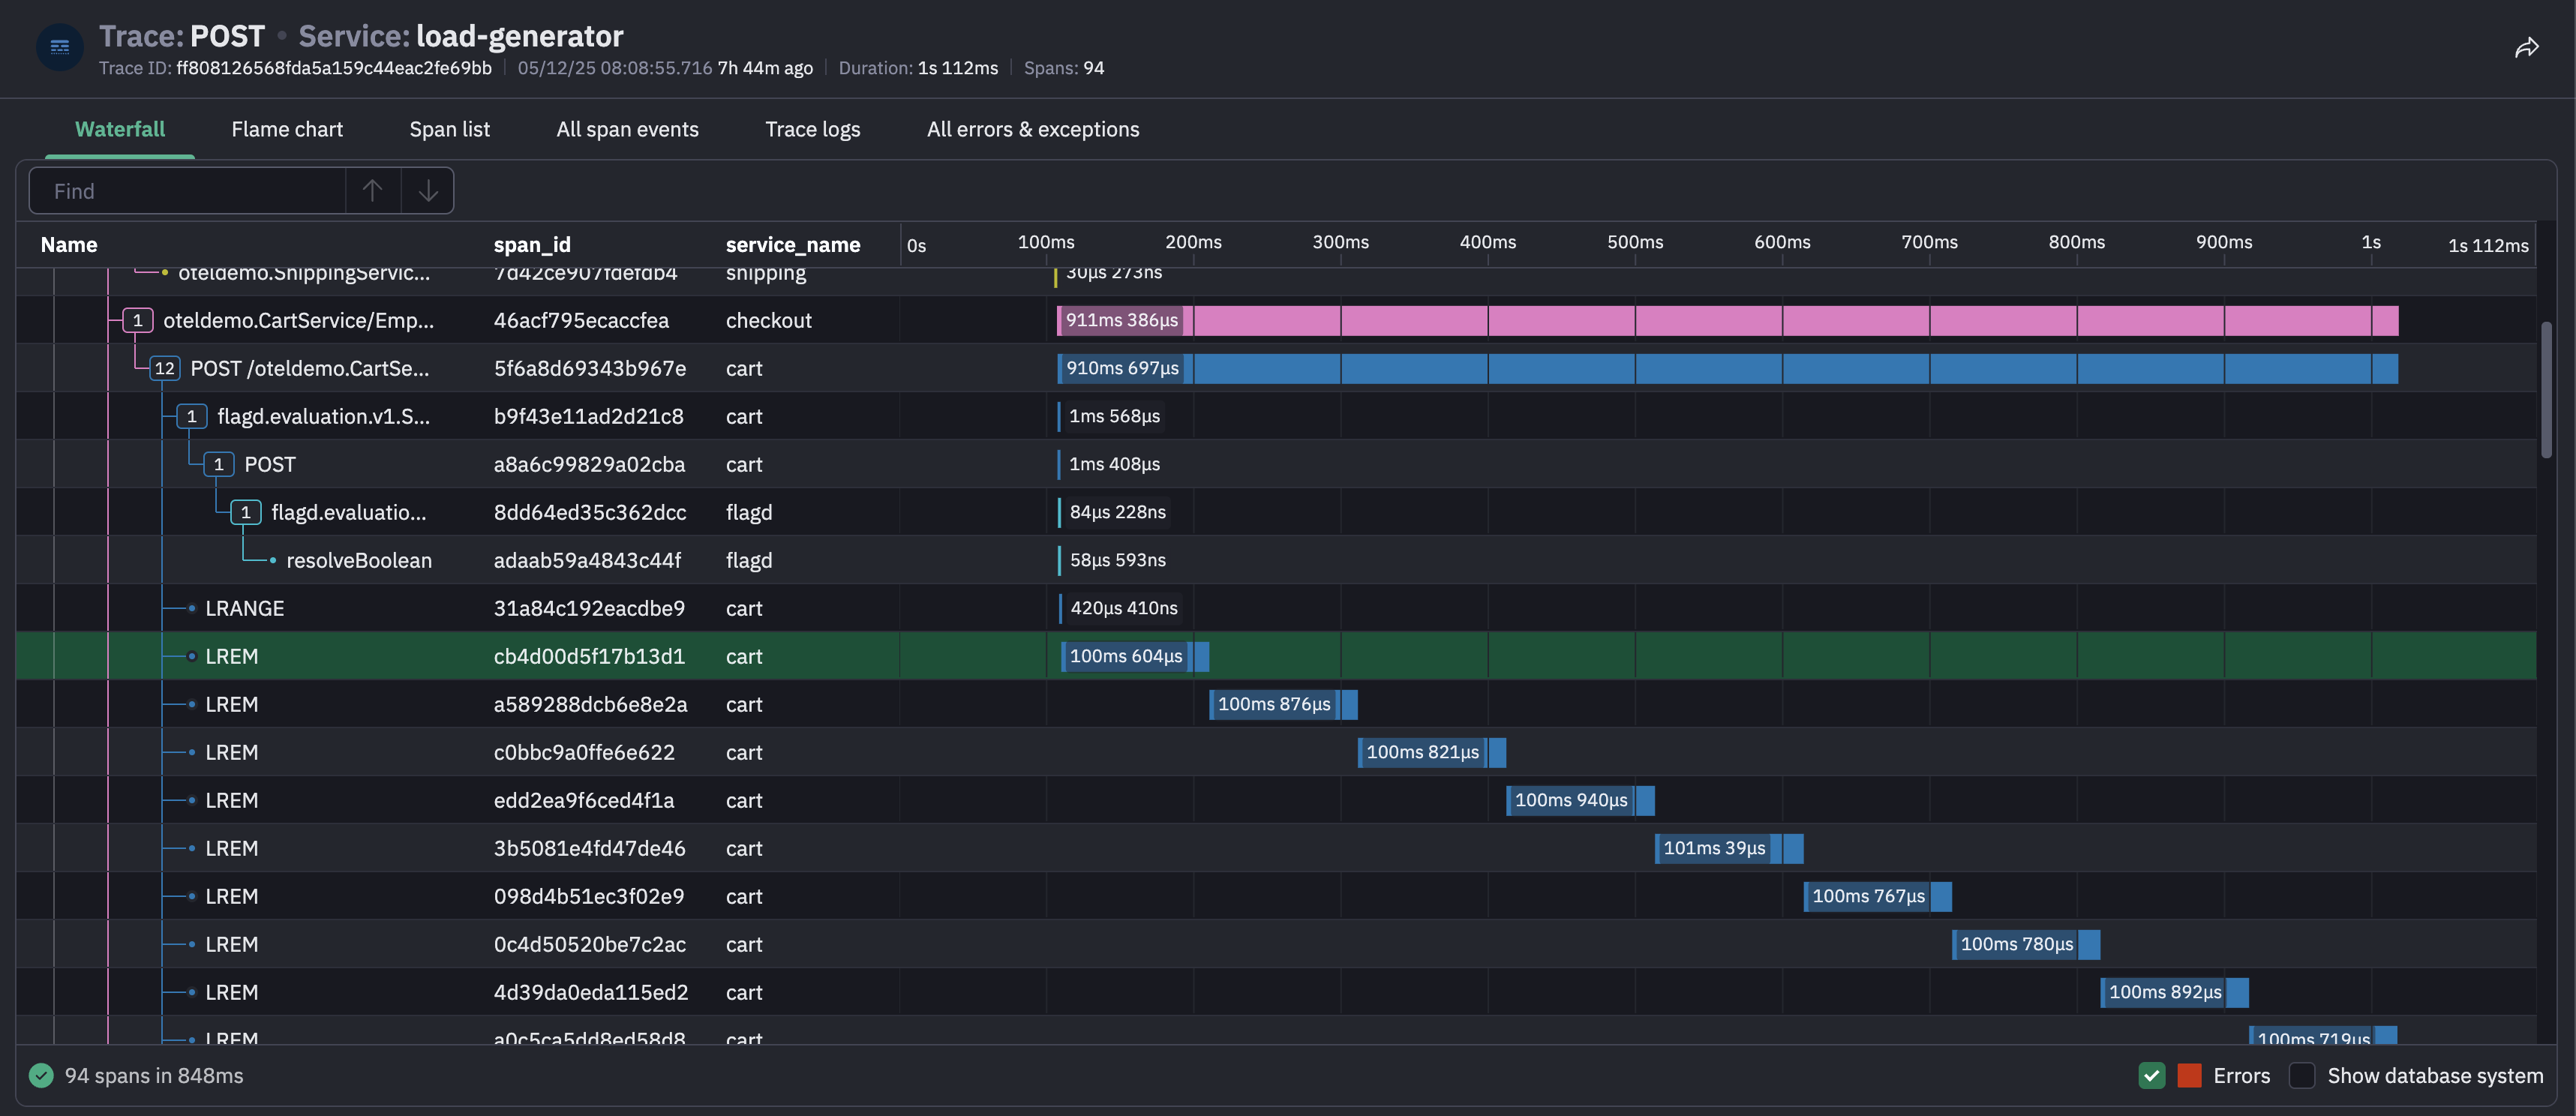
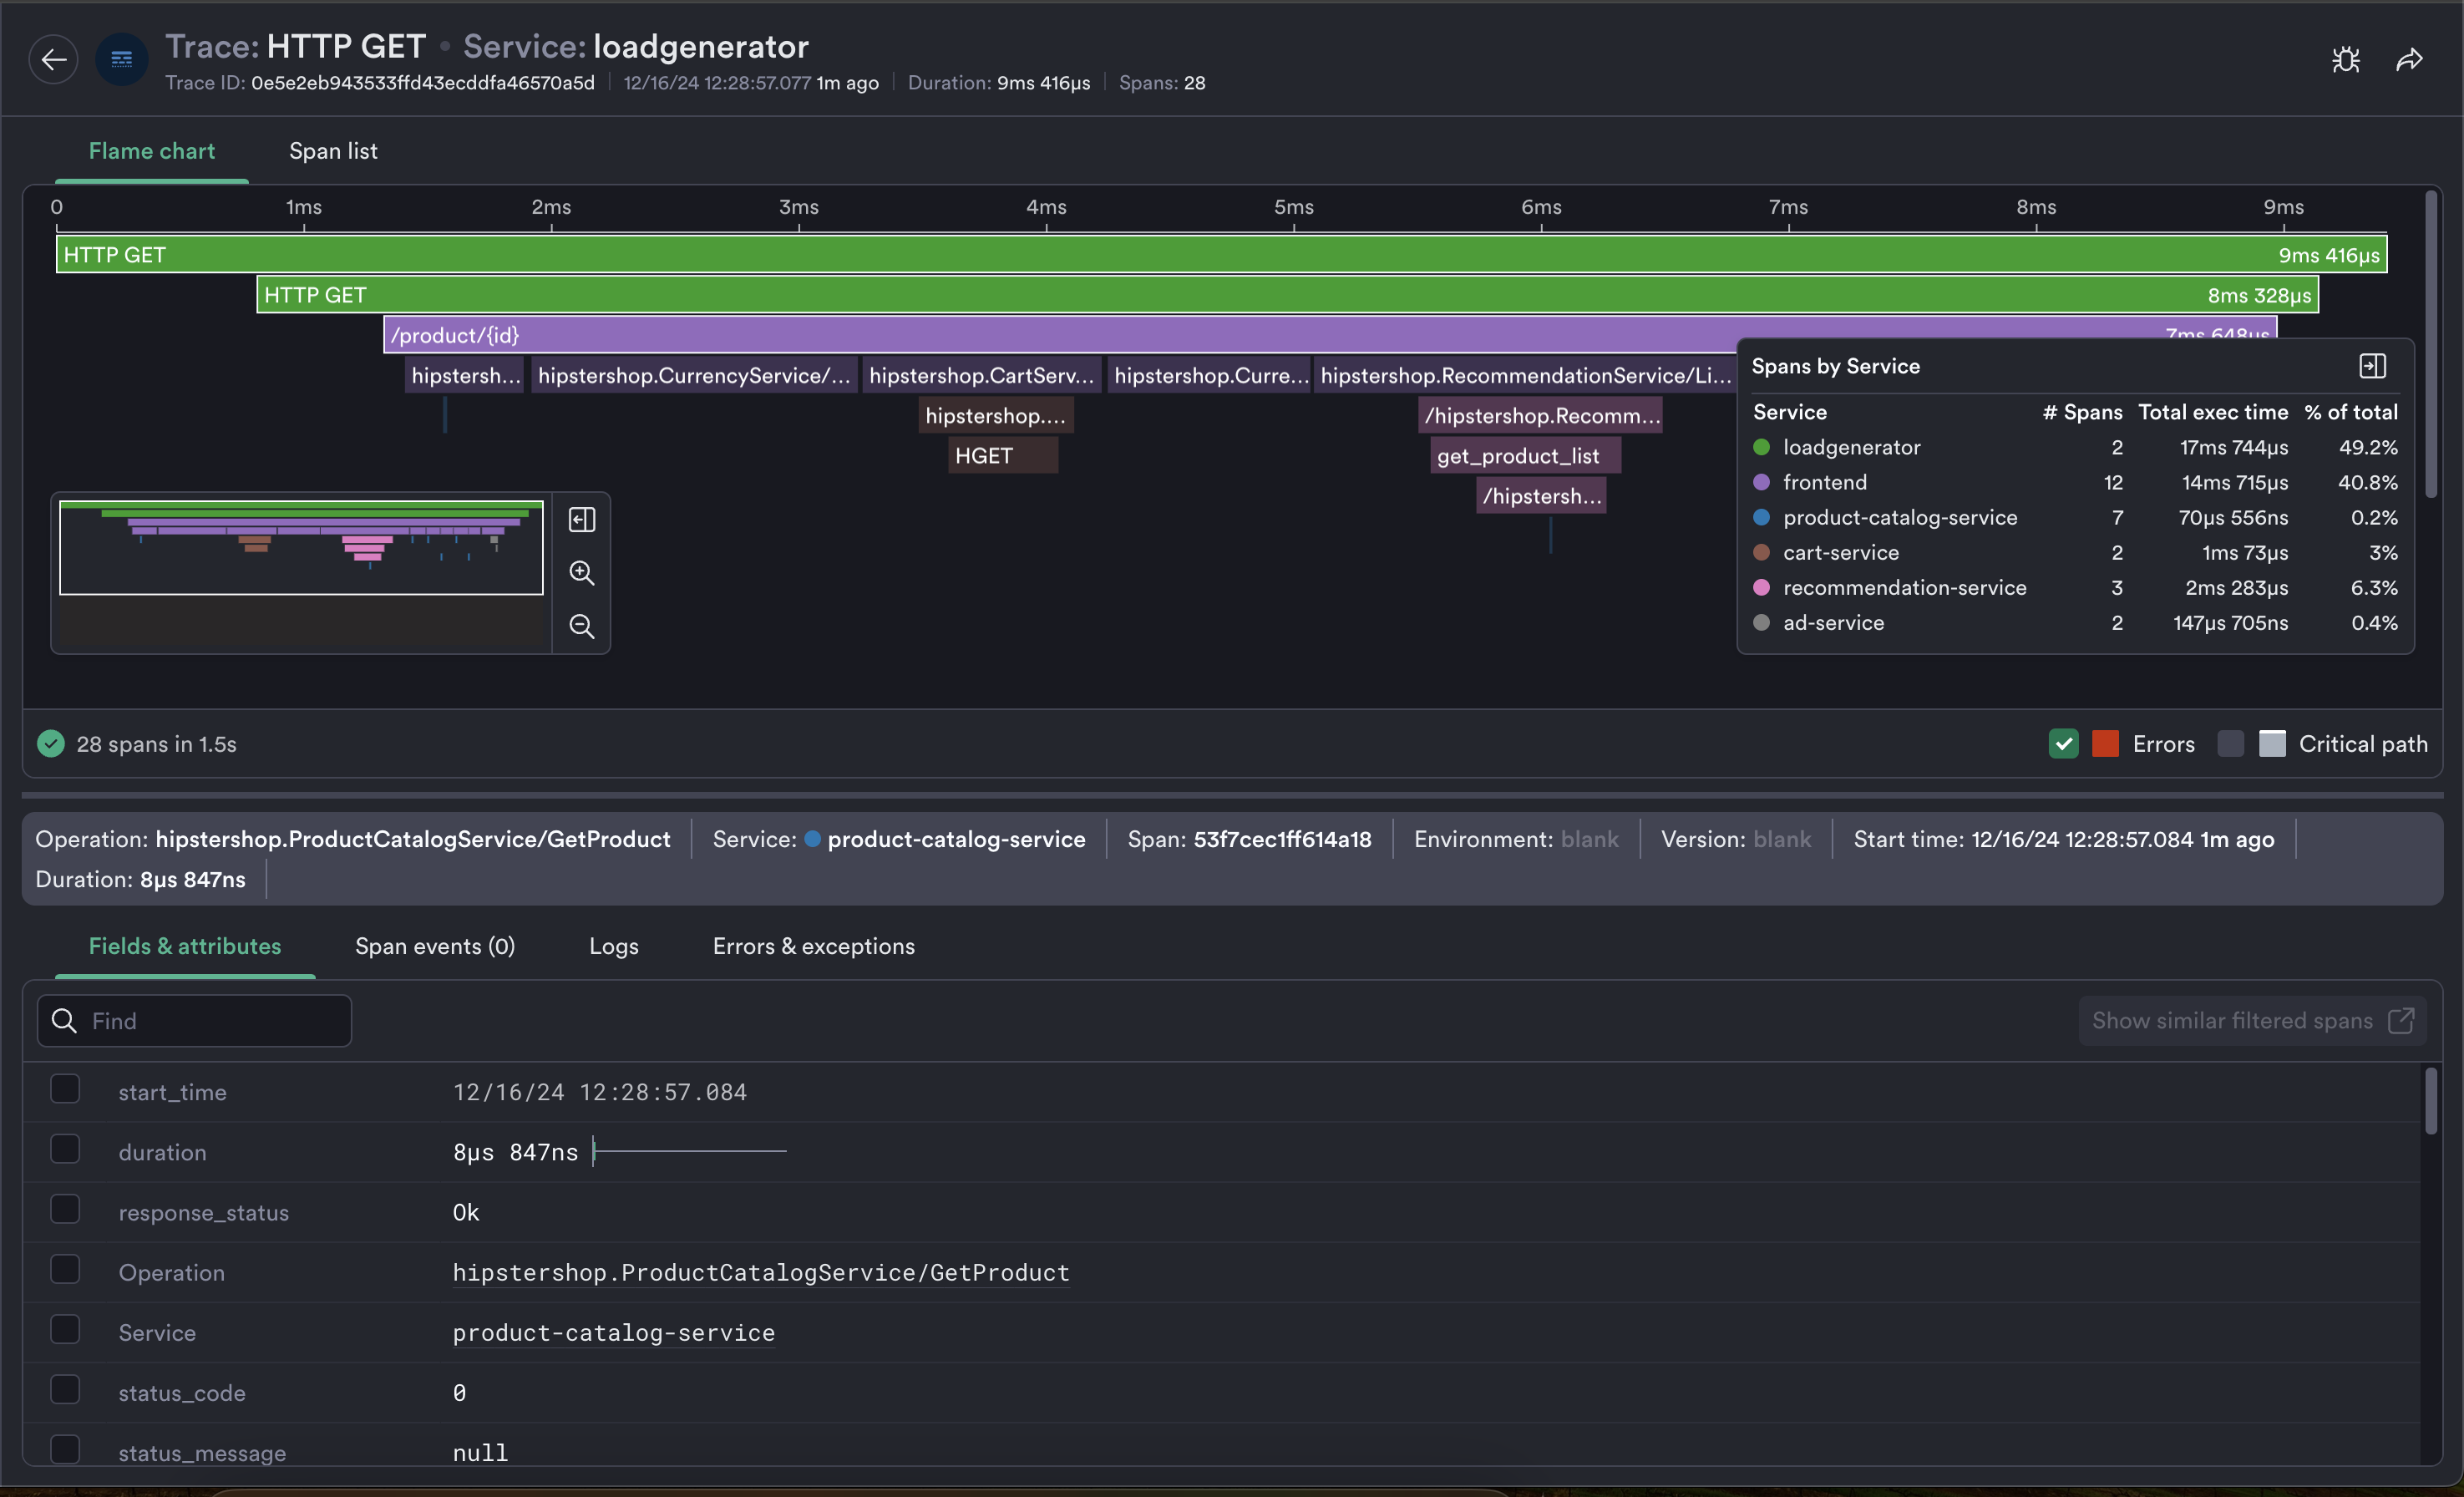
The Trace Explorer in Observe enables you to investigate user requests and transactions by analyzing trace data. With powerful filtering and visualization tools including the flame chart and waterfall view, you can connect these requests to the underlying services, infrastructure, or other resources that processed them. Whether you’re troubleshooting errors, inspecting performance bottlenecks, or analyzing specific requests, the Trace Explorer helps you quickly pinpoint and resolve issues.

For more information on how Observe makes trace data available, see the Span dataset schema.
Exporting Data
To download the data displayed in Trace Explorer, click the Export button. You may select CSV or JSON format, and a maximum size limit (one thousand, ten thousand, or one hundred thousand rows). Note that hidden fields will be included. Use the pick_col OPAL verb to reduce the width of downloaded data.
Link directly to a trace
You may want to include direct links to specific traces from your alert payloads. To create a URL to a trace, use the following template:
https://<tenant_id>.observeinc.com/workspace/<workspace_id>/trace-inspector?traceId=<trace id>
Traces accessed via direct link are fetched from the last 24 hours of data.
If you are using a dataset other than the Span dataset that is part of the OpenTelemetry app, you’ll need to add the dataset ID as a parameter:
https://<tenant_id>.observeinc.com/workspace/<workspace_id>/trace-inspector?spanDatasetId=<span dataset id>&traceId=<trace id>