MongoDB Atlas
MongoDB Atlas is a fully managed cloud database service provided by MongoDB, the company behind the popular NoSQL database MongoDB. It offers a simplified way to deploy, manage, and scale MongoDB databases in the cloud, without the need for manual infrastructure provisioning or database administration tasks.
Observe helps you monitor the MongoDB Atlas activity of your organization. The app helps you answer questions such as the following:
Is the database query performance healthy? Are there high latency or error rates?
Are the database processes reaching connection limits? Are they returning connection errors?
Is memory or storage space allocated too low for stable cluster operations?
The MongoDB Atlas app installs the following datasets by default:
Event Datasets
Metrics
Poller Events
Resource Datasets
Project
Cluster
Process
Organization
Org User
Database User
Viewing MongoDB Atlas Data in Observe
When you install the MongoDB Atlas app, the app also installs default dashboards for monitoring and reviewing MongoDB Atlas events. The following dashboards are installed by default:
MongoDB Atlas/Home
MongoDB Atlas/Monitoring
MongoDB Atlas/Performance
MongoDB Atlas/Home Dashboard
The MongoDB Atlas/Home dashboard provides a high-level overview of your organizational output, with information on the following activity:
Clusters
Metric Highlights
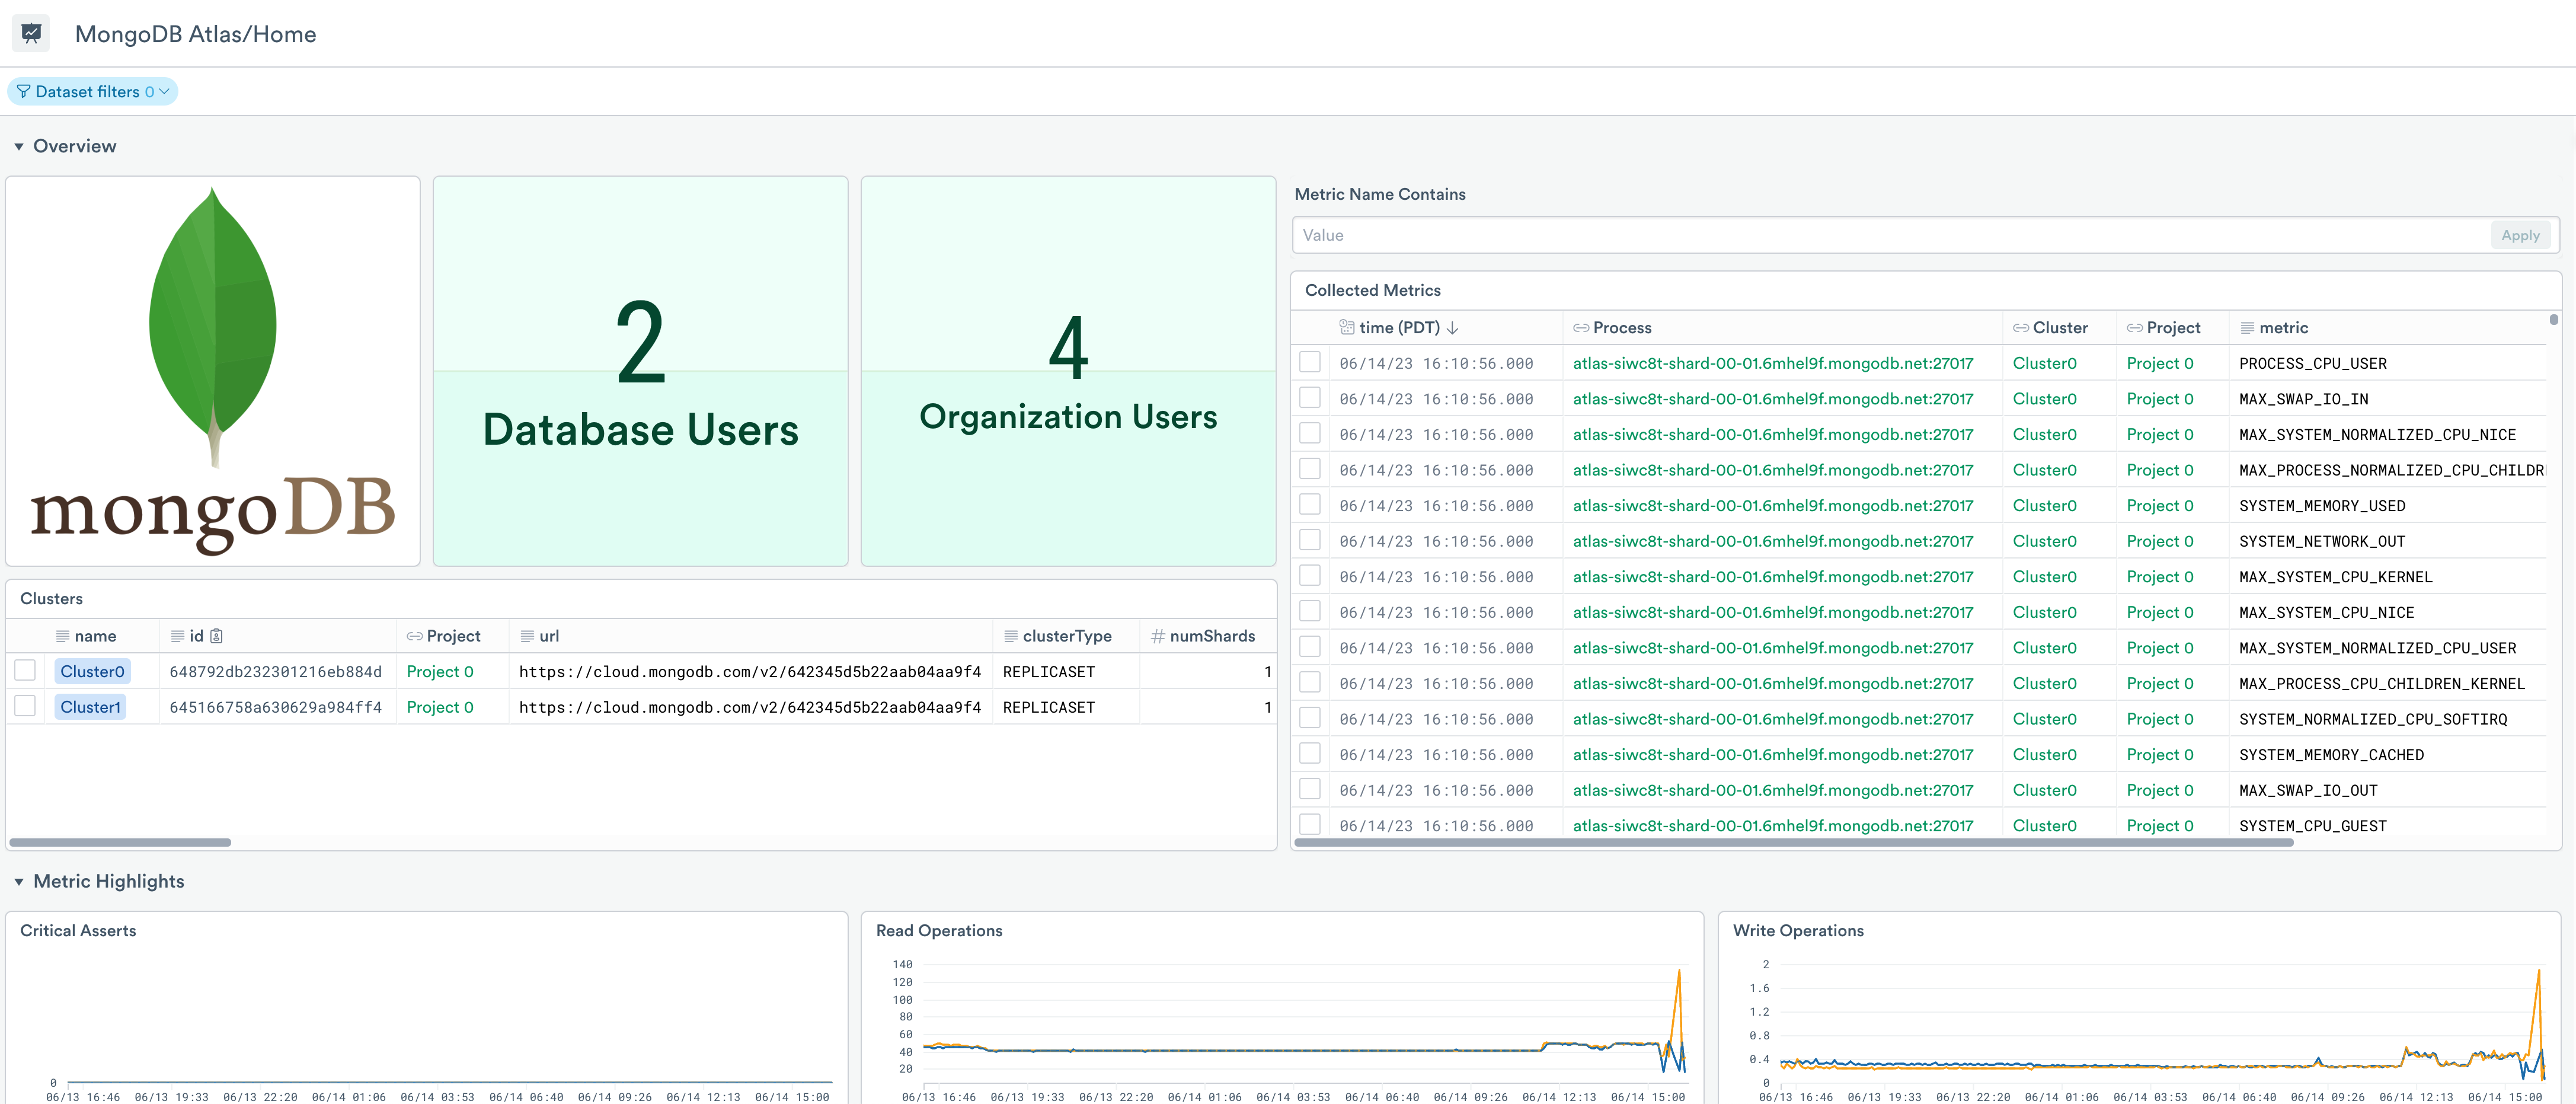
Figure 1 - MongoDB Atlas/Home dashboard
Use the dashboard for debugging and troubleshooting as well as viewing the activity in your MongoDB organization within a time window. Use it to answer questions such as:
How many clusters are in my organization? What is their state and relevant metadata?
What are the recently collected metrics? Which processes are active?
What are some metric highlights as it related to a cluster? Are any clusters facing issues in operations, connections, etc?
MongoDB Atlas/Monitoring Dashboard
The MongoDB Atlas/Monitoring dashboard provides a summarized view of the operations of your MongoDB Atlas clusters and processes:
Asserts
Operations
Connection Availability
Switch to other dashboards to get a more detailed view of this data.
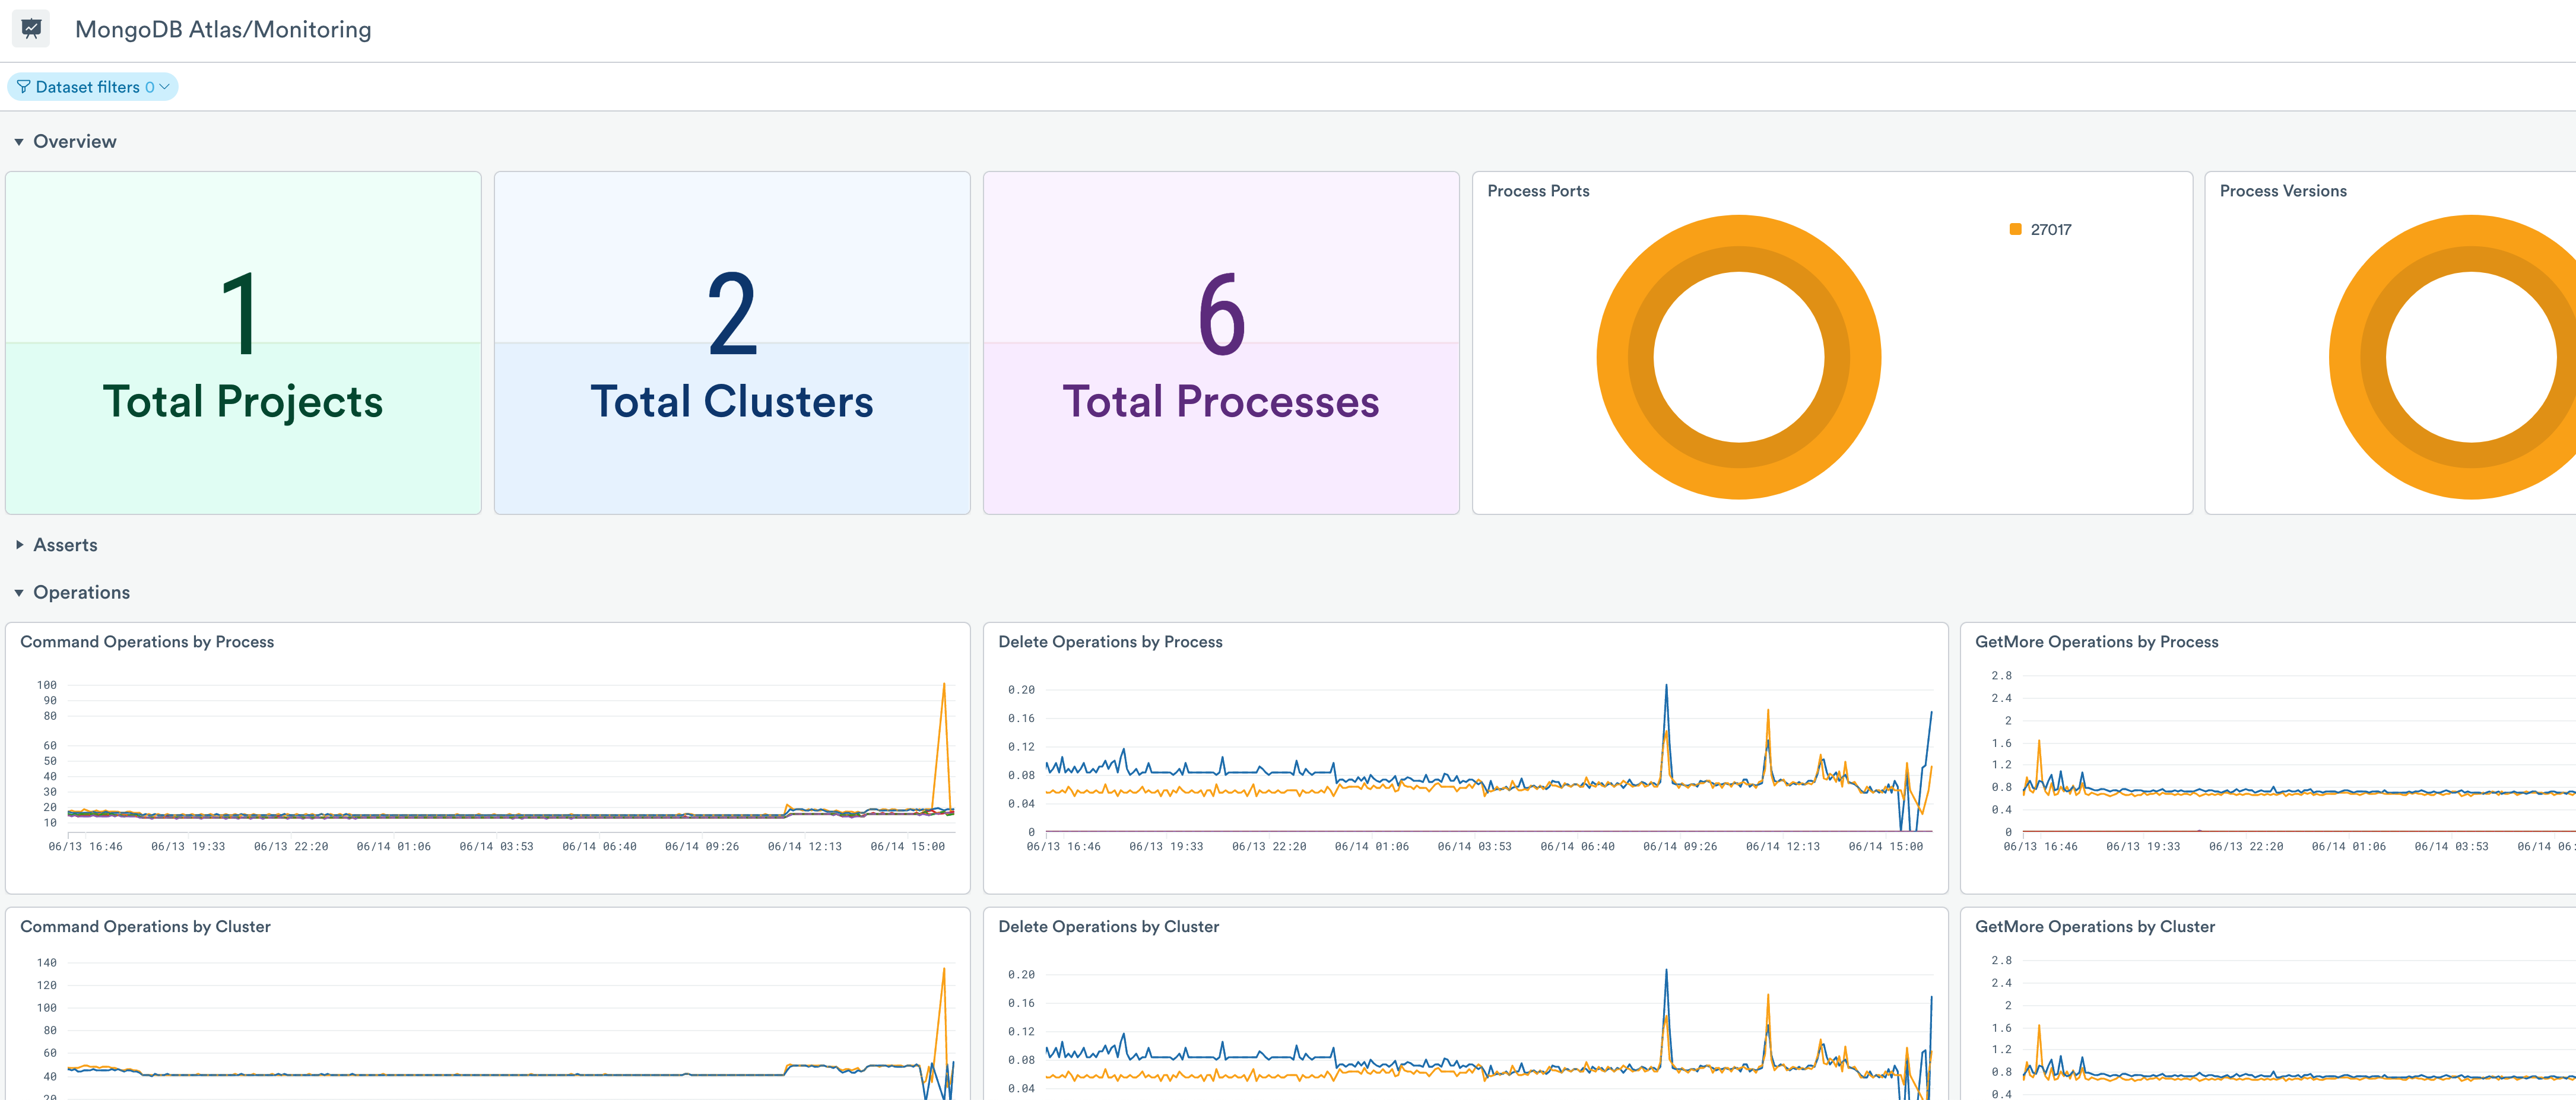
Figure 2 - MongoDB Atlas/Monitoring dashboard
MongoDB Atlas/Performance Dashboard
The MongoDB Atlas/Performance dashboard provides a deeper view into the MongoDB engine and host performance underlying your database queries.
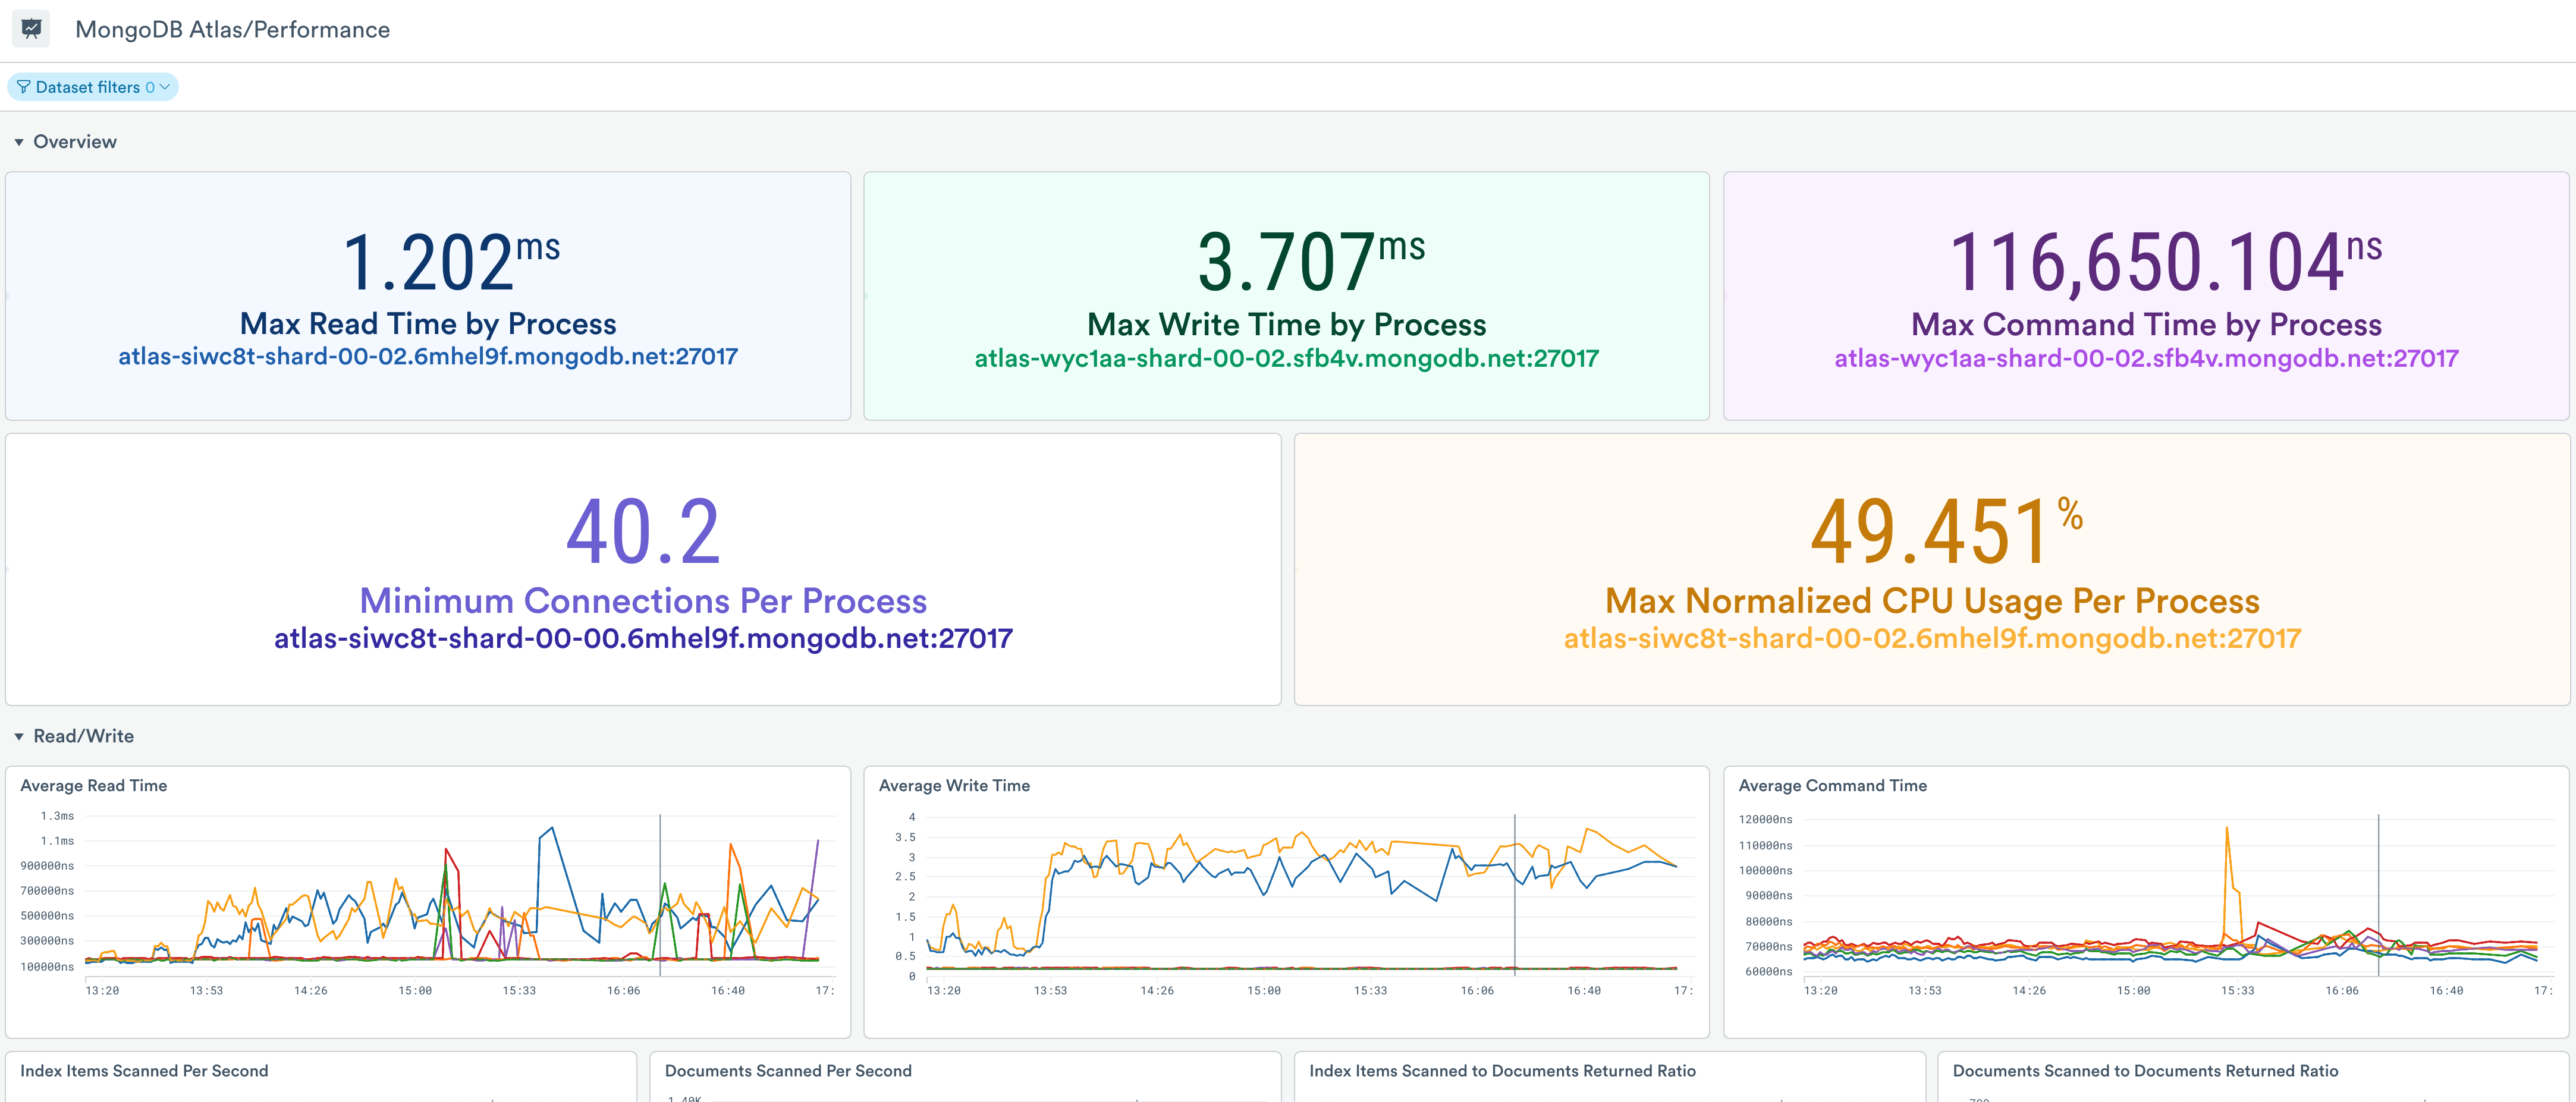
Figure 3 - MongoDB Atlas/Performance dashboard
Use this dashboard to get a more detailed view of the operations of your MongoDB Atlas processes:
Read/Write statistics
Networking metrics
CPU and memory metrics
Storage metrics
Cache metrics
Setup
The MongoDB Atlas app ingests data from the Observe API poller. To install and configure data collection, see the MongoDB Atlas Installation Guide.
After configuration, data from MongoDB Atlas populates the datasets and dashboards and displays information about your organization.