Alerting Example: Shared Actions and Monitors
You are investigating a problem in Metrics Explorer and find that too many Kubernetes containers are waiting in a crash loop backoff. You’d like to send proactive alerts to the DevOps team via Slack. You’d also like to page someone if the levels are very high.
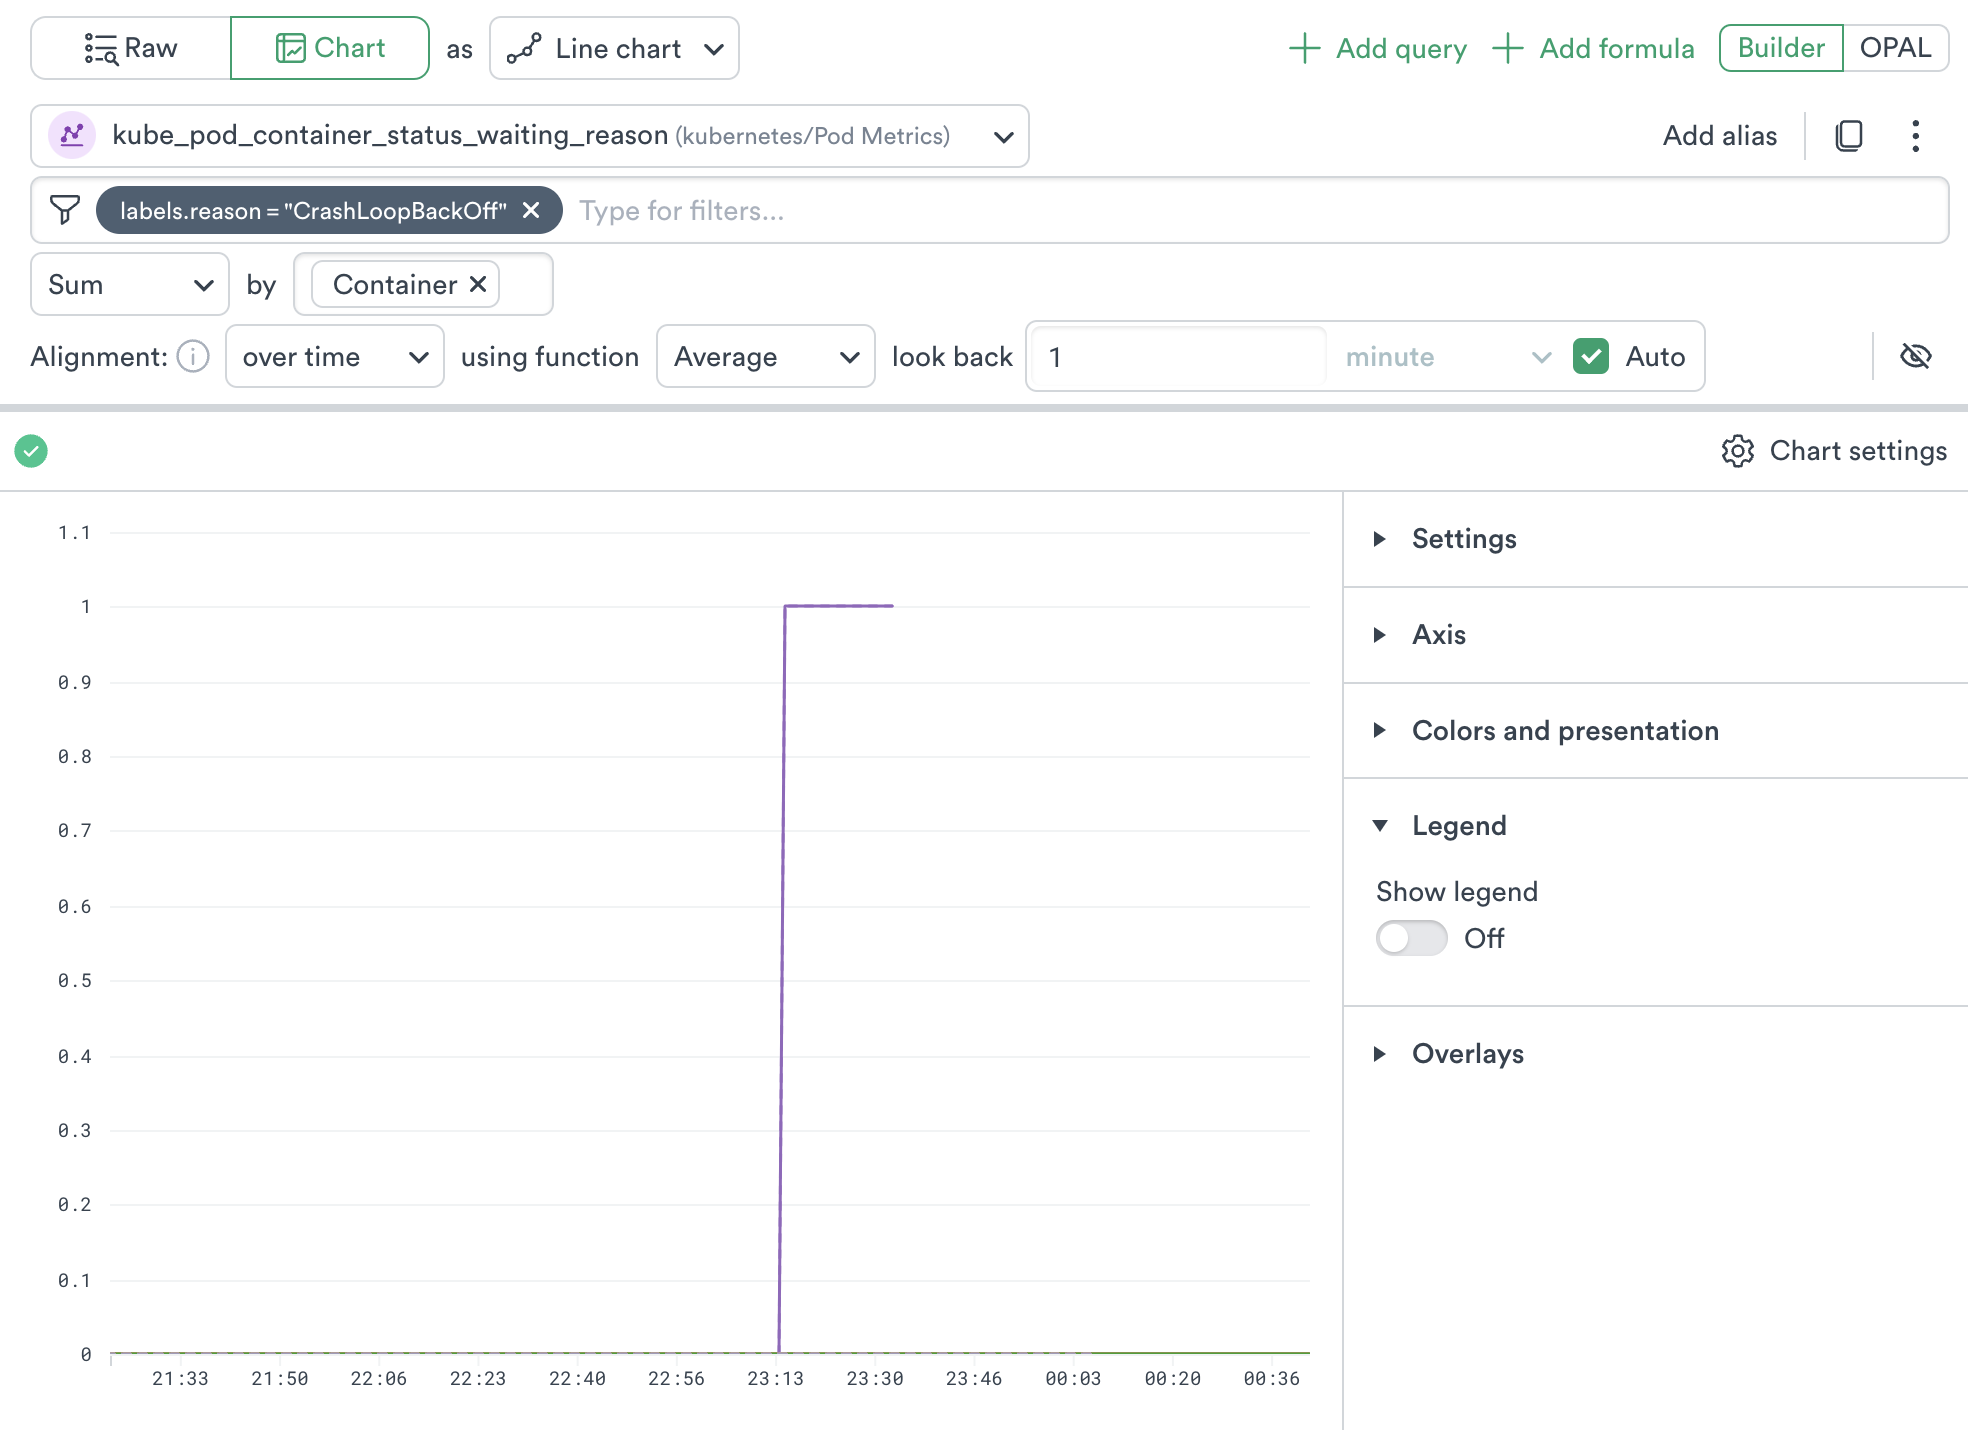
Figure 1 - Metrics Explorer displaying waiting containers
Create a Monitor
Click Actions in the top right, then Create monitor to start a new Threshold Monitor.
Name the monitor, then click Add rule to add the Warning level Slack rule.
Change the Severity dropdown from Error to Warning
Set the first condition to greater than
25.Click Add condition and set the second condition to less than or equal to
50.
Click Add rule again to make the Critical level PagerDuty rule.
Change the Severity dropdown from Error to Critical
Set the first condition to greater than
50.
Add text to Description to inform the recipient what you want them to do.
Add Actions
To make the Slack action, click Slack under Notification actions.
Change the Severity filter from
(Always trigger)to WarningPaste the Slack webhook URL for your DevOps channel into the
URLfield.Click See in Slack Block Builder to preview the alert, or Send test notification to view it in your DevOps channel
Scroll back to the top of the Slack action area and click Share action with team to name this action and save it as a Shared Action.
To make the PagerDuty action, click Add Action and PagerDuty.
Change the Severity filter from
(Always trigger)to CriticalClick Edit body and replace
REPLACE_WITH_PAGERDUTY_ROUTING_KEYwith your PagerDuty routing keySet Send an update when the monitor has stopped triggering to On.
Scroll back to the top of the Slack action area and click Share action with team to name this action and save it as a Shared Action.
Click Save Changes at the top right.