Creating a Threshold Log Monitor
As a Site Reliability Engineer (SRE), you may want to monitor certain events that occur on your network or application. Configure a Threshold Log monitor to alert you when certain events occur indicating a problem or related issue occurs on your Kubernetes Container.
To configure a Threshold Log monitor, log into your Observe instance and click Monitors on the left hand rail**.
In this example, your application returns stderr errors while running on your Kubernetes container. You want to monitor the errors and receive an alert when the number of errors exceeds a specific threshold.
Use the following steps to configure your monitor and alert for Container Logs Event Stream:
On the Monitors landing page, click Create Monitor.
Click Threshold log.
Select Container Logs from the list of available Logs.
In the Query Expressions section, select
stderras the Input source where.In the Alert Conditions section, keep the default trigger conditions, and enter 10 as the Alert threshold.
Your configuration looks similar to the following example:
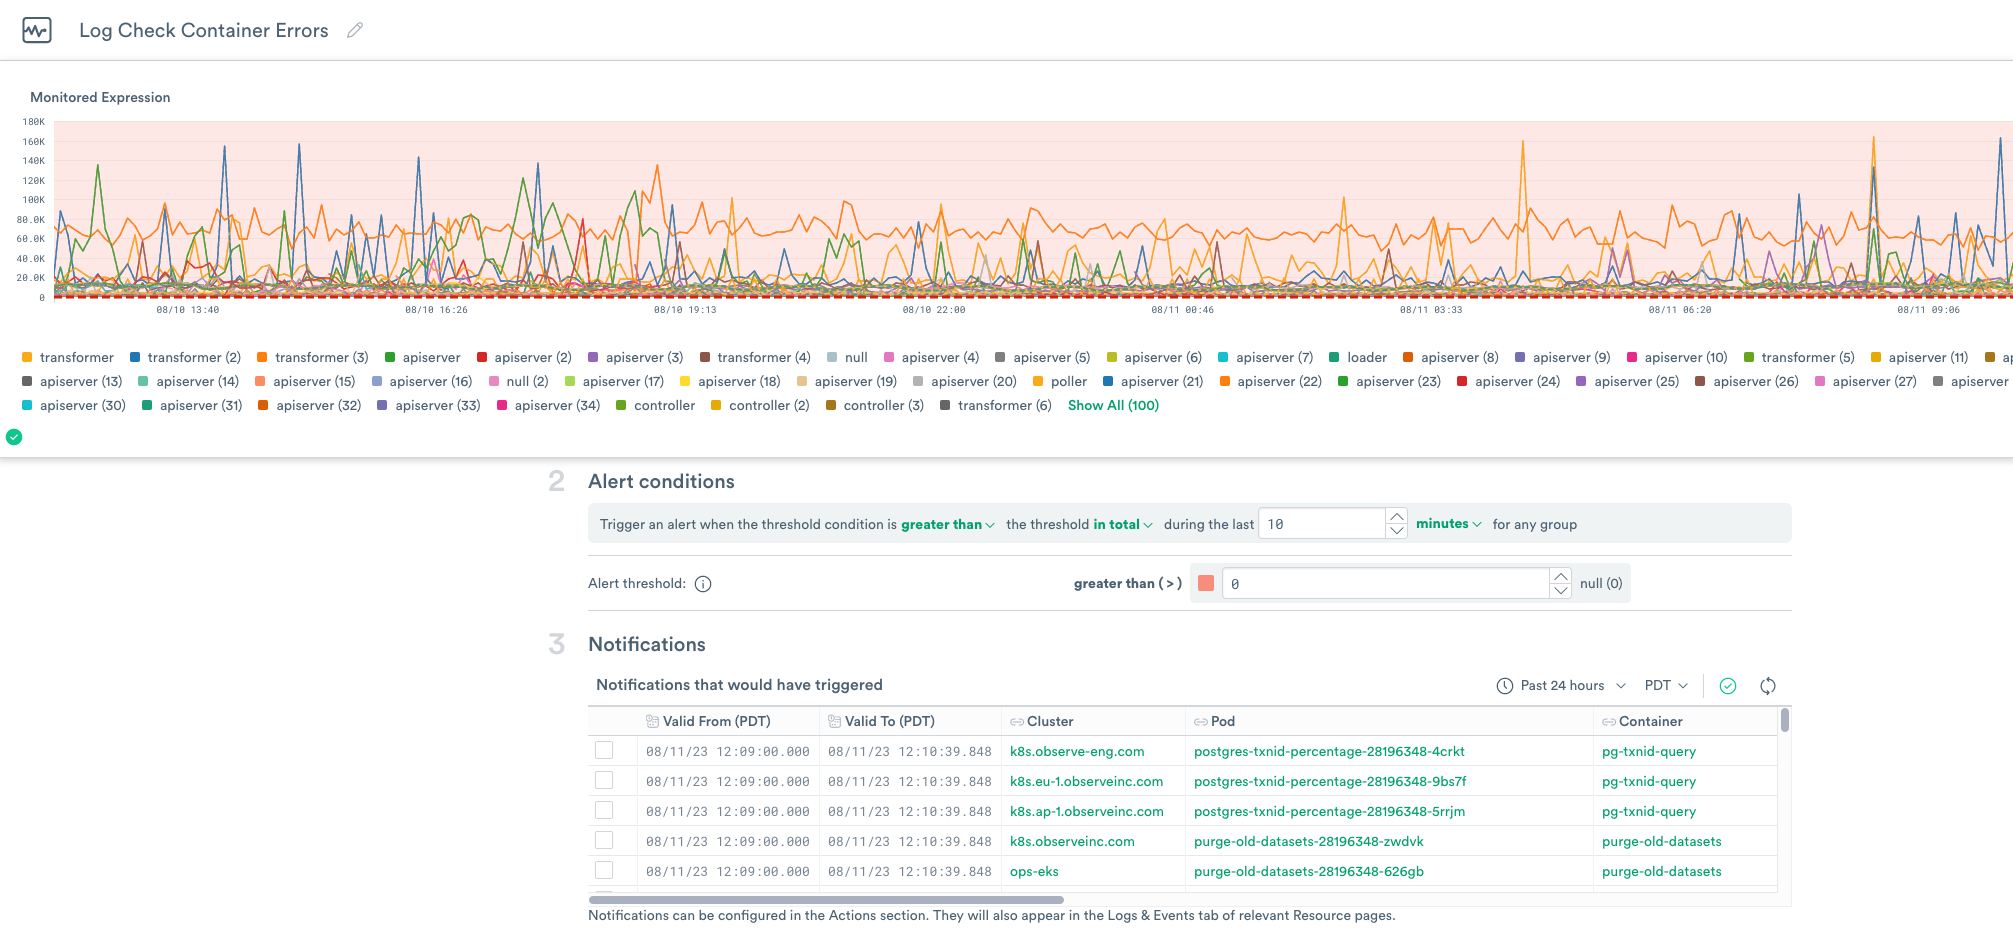
Figure 1 - Configuring the Container Threshold Log Monitor
After you configure the Threshold, the Notifications section displays a list of events that could trigger the Monitor.
Actions
In this section, add a description of the Monitor, and then click Add Action.
Select Email as the Action Type.
In the Settings section, add your target email address, for example,
your_name@company.com.Use the template defaults for the Subject and Body.
Click the down arrow next to Sample Data and Preview.
Leave the Monitor Sample Data at the default value of Current Monitor.
You can preview the Monitor Notification email.
To test the Monitor, click Send Test Notification. If successful, a sample of the Monitor Notification appears in your email Inbox, and the message no errors detected displays in the section.
Under Status updates, leave the default values set to Send update that notification has ended and Send reminders.
Click the Pencil icon next to the Monitor Name and enter a name for the Monitor, such as Log Check Container Errors.
Click Save to save your configuration.
Threshold Log Tutorial
As the Site Reliability Engineer (SRE) for the Acme Company, you monitor the Kubernetes Container Logs for any unusual activity in the Containers. To view the Container Logs, log into Observe and click Log Explorer. Then use the following steps to view the Container Logs and create a custom Dataset to monitor activity.
Using Log Explorer for Locating Logs of Interest
In Log Explorer, select the kubernetes/Container Logs Dataset from the list of Log Datasets.
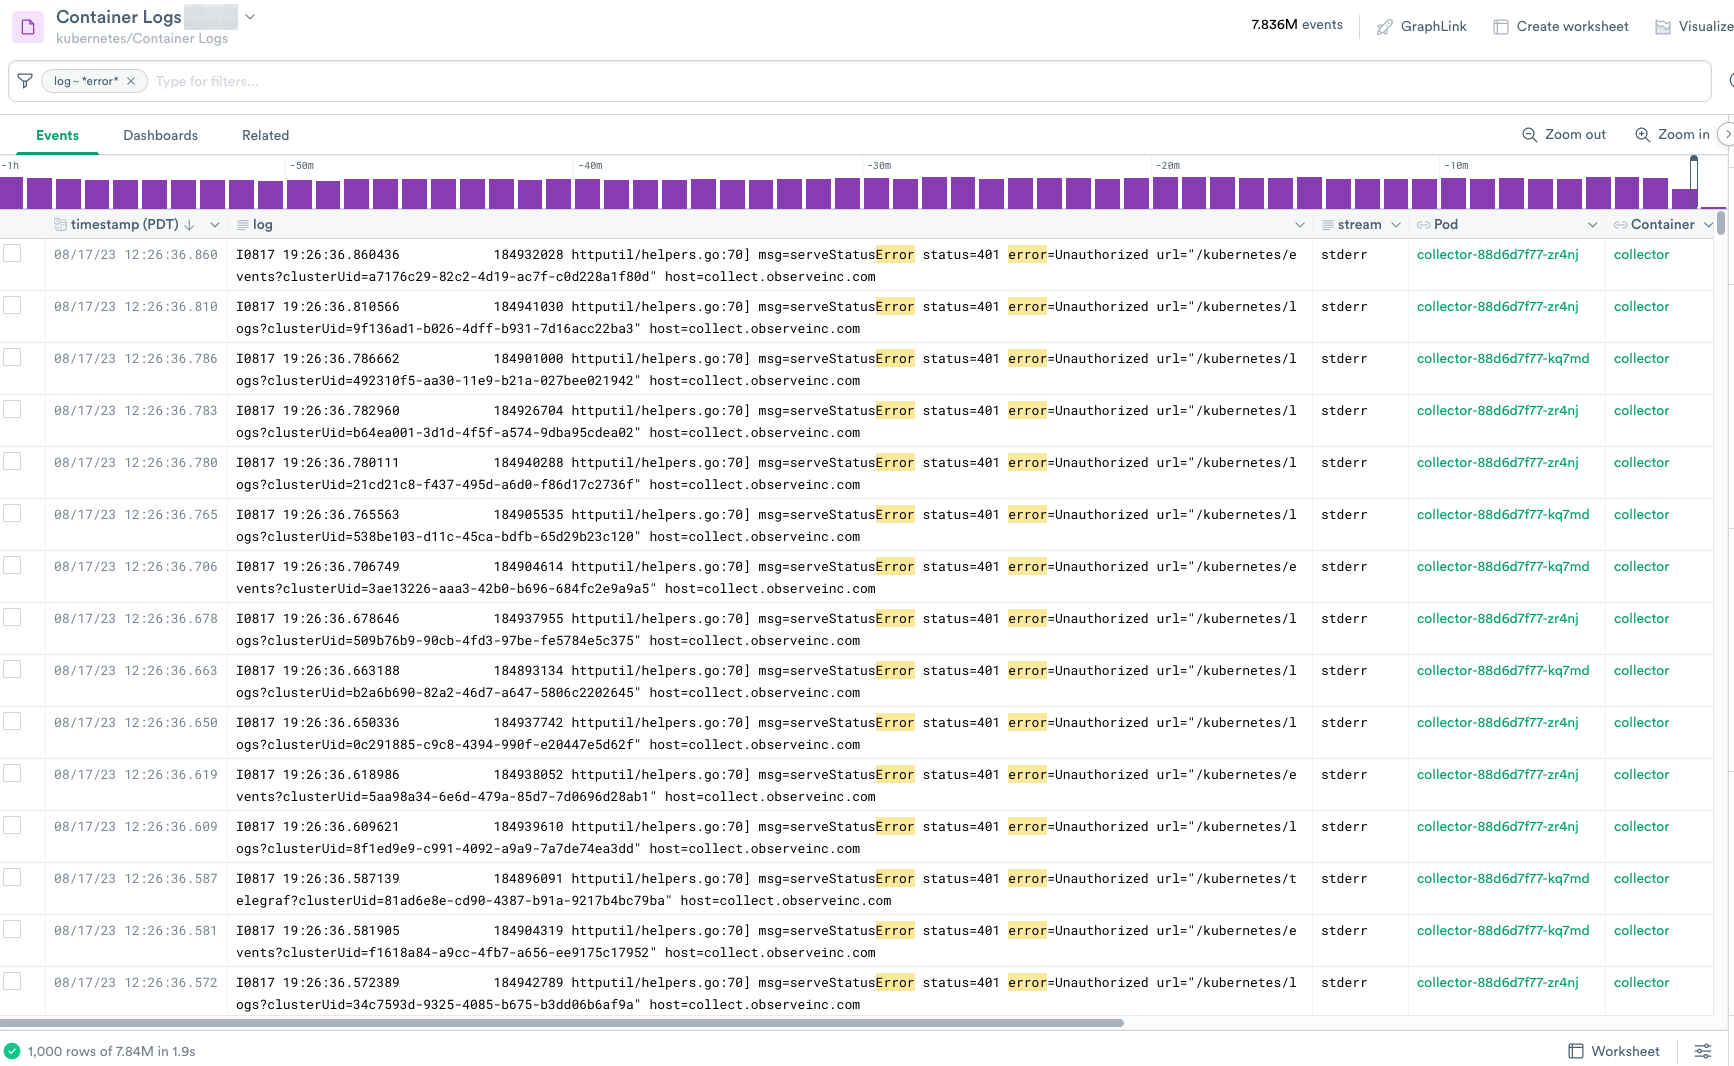
Figure 2 - Kubernetes Container Logs with Errors
While reviewing the logs, you notice quite a few Unauthorized errors and decide to extract the error messages to locate the reason.
Because the error messages occur in the log messages, you need to extract the data from the column.
Click the down arrow in the log column, and select Extract from string.
From the Method list, select Key=Values Pairs, and click Apply. This creates a new column log KVPairs.
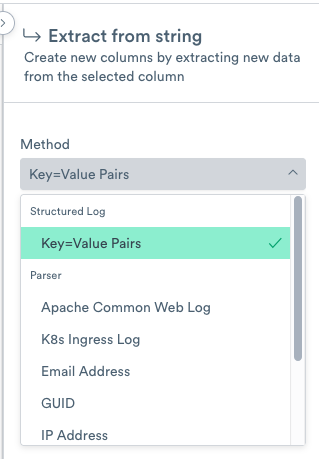
Figure 3 - Extracting Key=Value Pairs from the Extract from String list
Click the down arrow in the Log KVPairs column, and then click Extract from JSON.
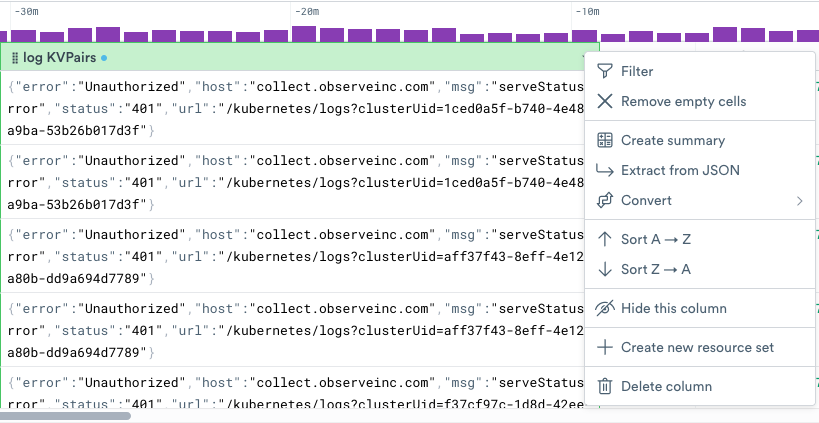
Figure 4 - Extracting from JSON on the logKVPairs
From the list of Fields, select
error,host,msg,status, andurl. Click Apply. This creates new columns for the data.
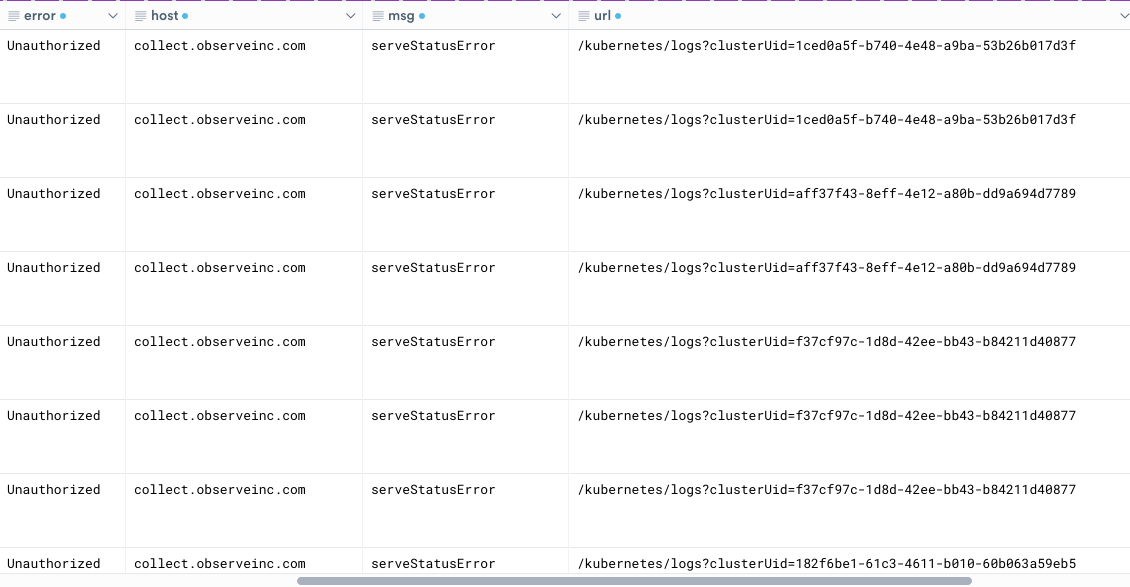
Figure 5 - New Columns created from logKVPairs
The status column displays the HTTP status, 401 which corresponds with the error messages of Unauthorized and indicates that the client request has not been completed because it lacks valid authentication credentials for the requested resource. The url column contains the URL without valid credentials. Now you can find the root cause of the unauthorized access.
Creating the Threshold Log Monitor and Alert
Create a Threshold log Monitor and Alert to notify you when errors appear in the logs.
From the list of Actions, select Create Monitor which opens the Threshold Monitors configuration options.
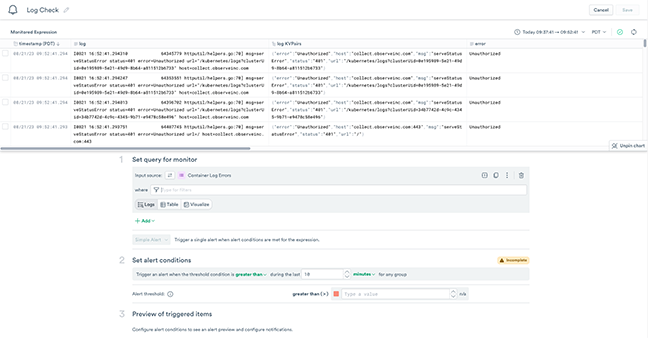
Figure 7 - Creating a Threshold Log Monitor
From the list of Log Datasets, select Container Logs Errors.
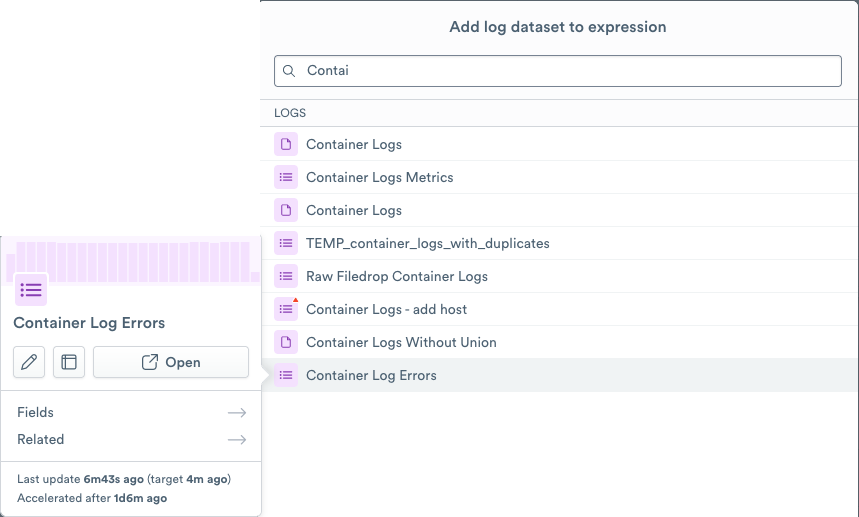
Figure 8 - Selecting the Container Logs Errors Dataset
Set query for monitor
In the Query Expressions section, add error=”Unauthorized” in the where field.
Add Count Values of Error by Container.
Set alert conditions
In the Alert conditionsfield, change the during the last value to 5 minutes.
Configure the Alert threshold as 5.
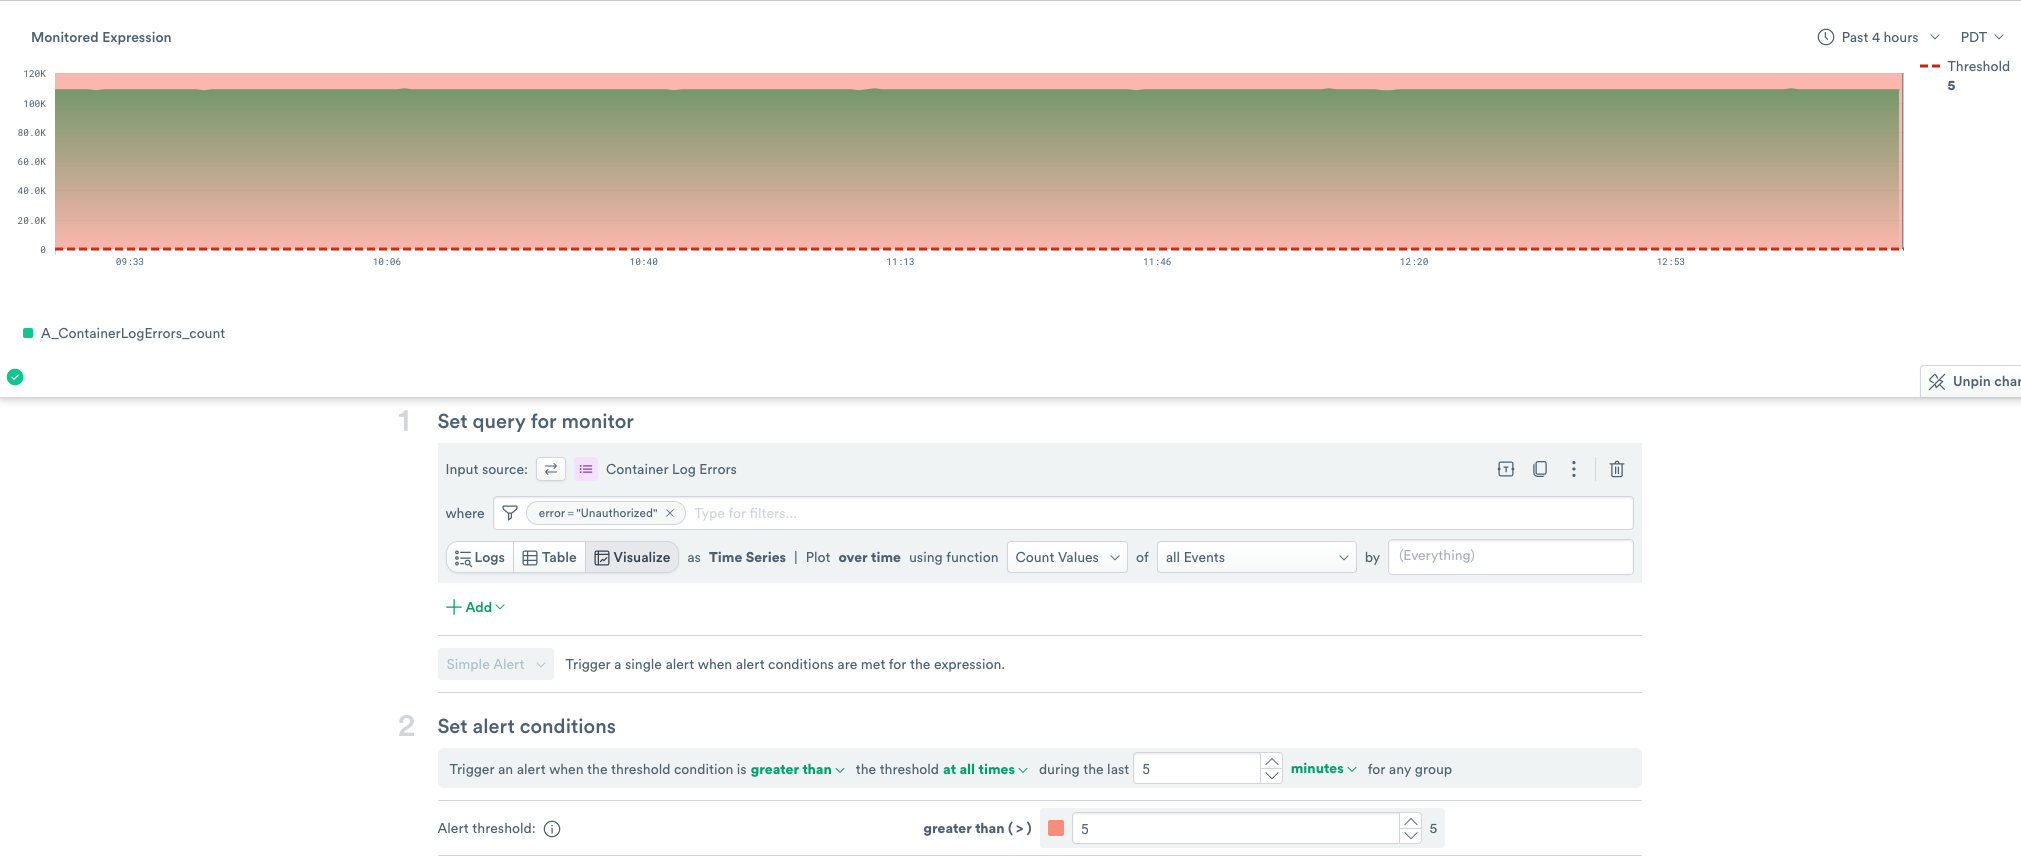
Figure 9 - Configuring the Query for the Threshold Log Monitor
Preview of Triggered items

Figure 10 - Previewing Potential Trigger Events for the Monitor
Preview a list of events that could trigger the Monitor.
Set notification actions
In the Actions field, add an optional description, and then Email from the Add action field.

Figure 11 - Adding a Description for the Notification
Create a description for the notification by clicking the Pencil icon and adding Unauthorized Errors by Cluster.
Enter your email address into the Settings>Email Addresses field.

Figure 12 - Adding a Description for the Notification
Use the email template default values, and then click Sample Data and Preview to review the Alert.
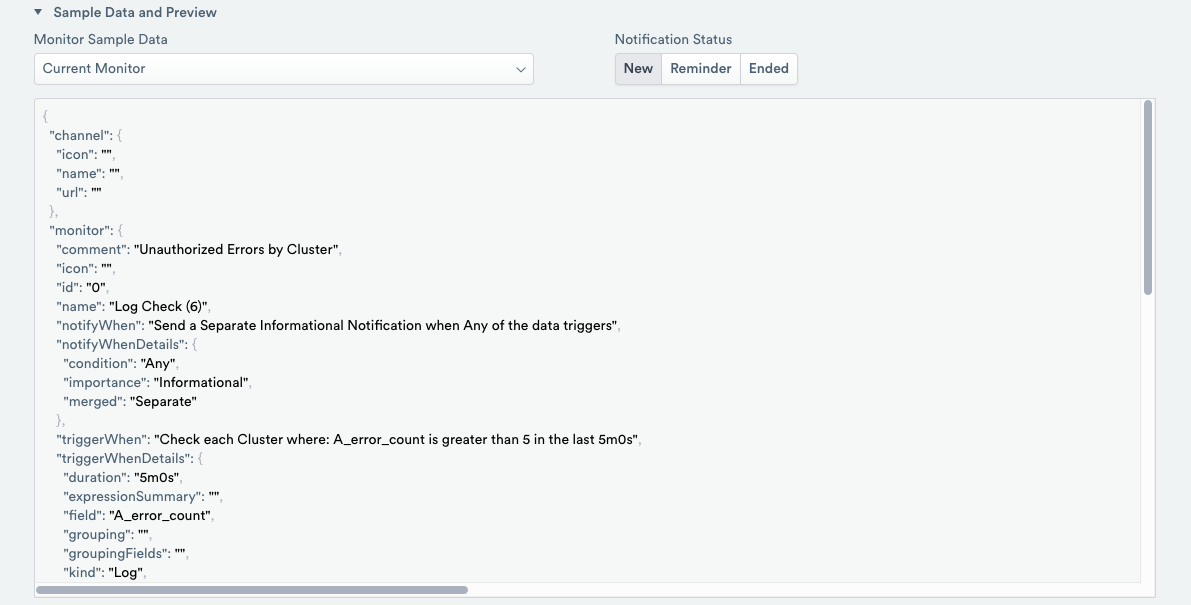
Figure 13 - Previewing the Notification

Figure 14 - Previewing the Notification (continued)
Click Send Test Notification to ensure that you configured the correct email address.
Send Status Updates
Leave the options in this section at the default values.
Completing the Threshold Monitor Configuration
Scroll to the top of the page and create a name for the notification by clicking the Pencil icon and adding Container Log Unauthorized Alert.
Click Save to save your configuration and begin monitoring the Dataset.