How do I measure drift in a metric over time?
Using the timeshift OPAL verb, you can calculate the deltas between points in time for use in anomaly detection.
Here’s an example of making a metric from a series of service requests and comparing week-over-week values:
timeshift 7d

timechart 1m, frame(ahead:30m, back:30m),
  ajax_web_request_baseline:float64(avg(value)),
  group_by(appName, httpResponseCode, hostname, httpMethod)

make_metric ajax_web_request_baseline,
  group_by(appName, httpResponseCode, hostname, httpMethod)

interface "metric"

set_metric options(rollup:"sum", aggregate:"sum"), "ajax_web_request_baseline"
Open the resulting metric in Metrics Explorer and use the expression builder to compare ajax_web-request_count against ajax_web_request_baseline.
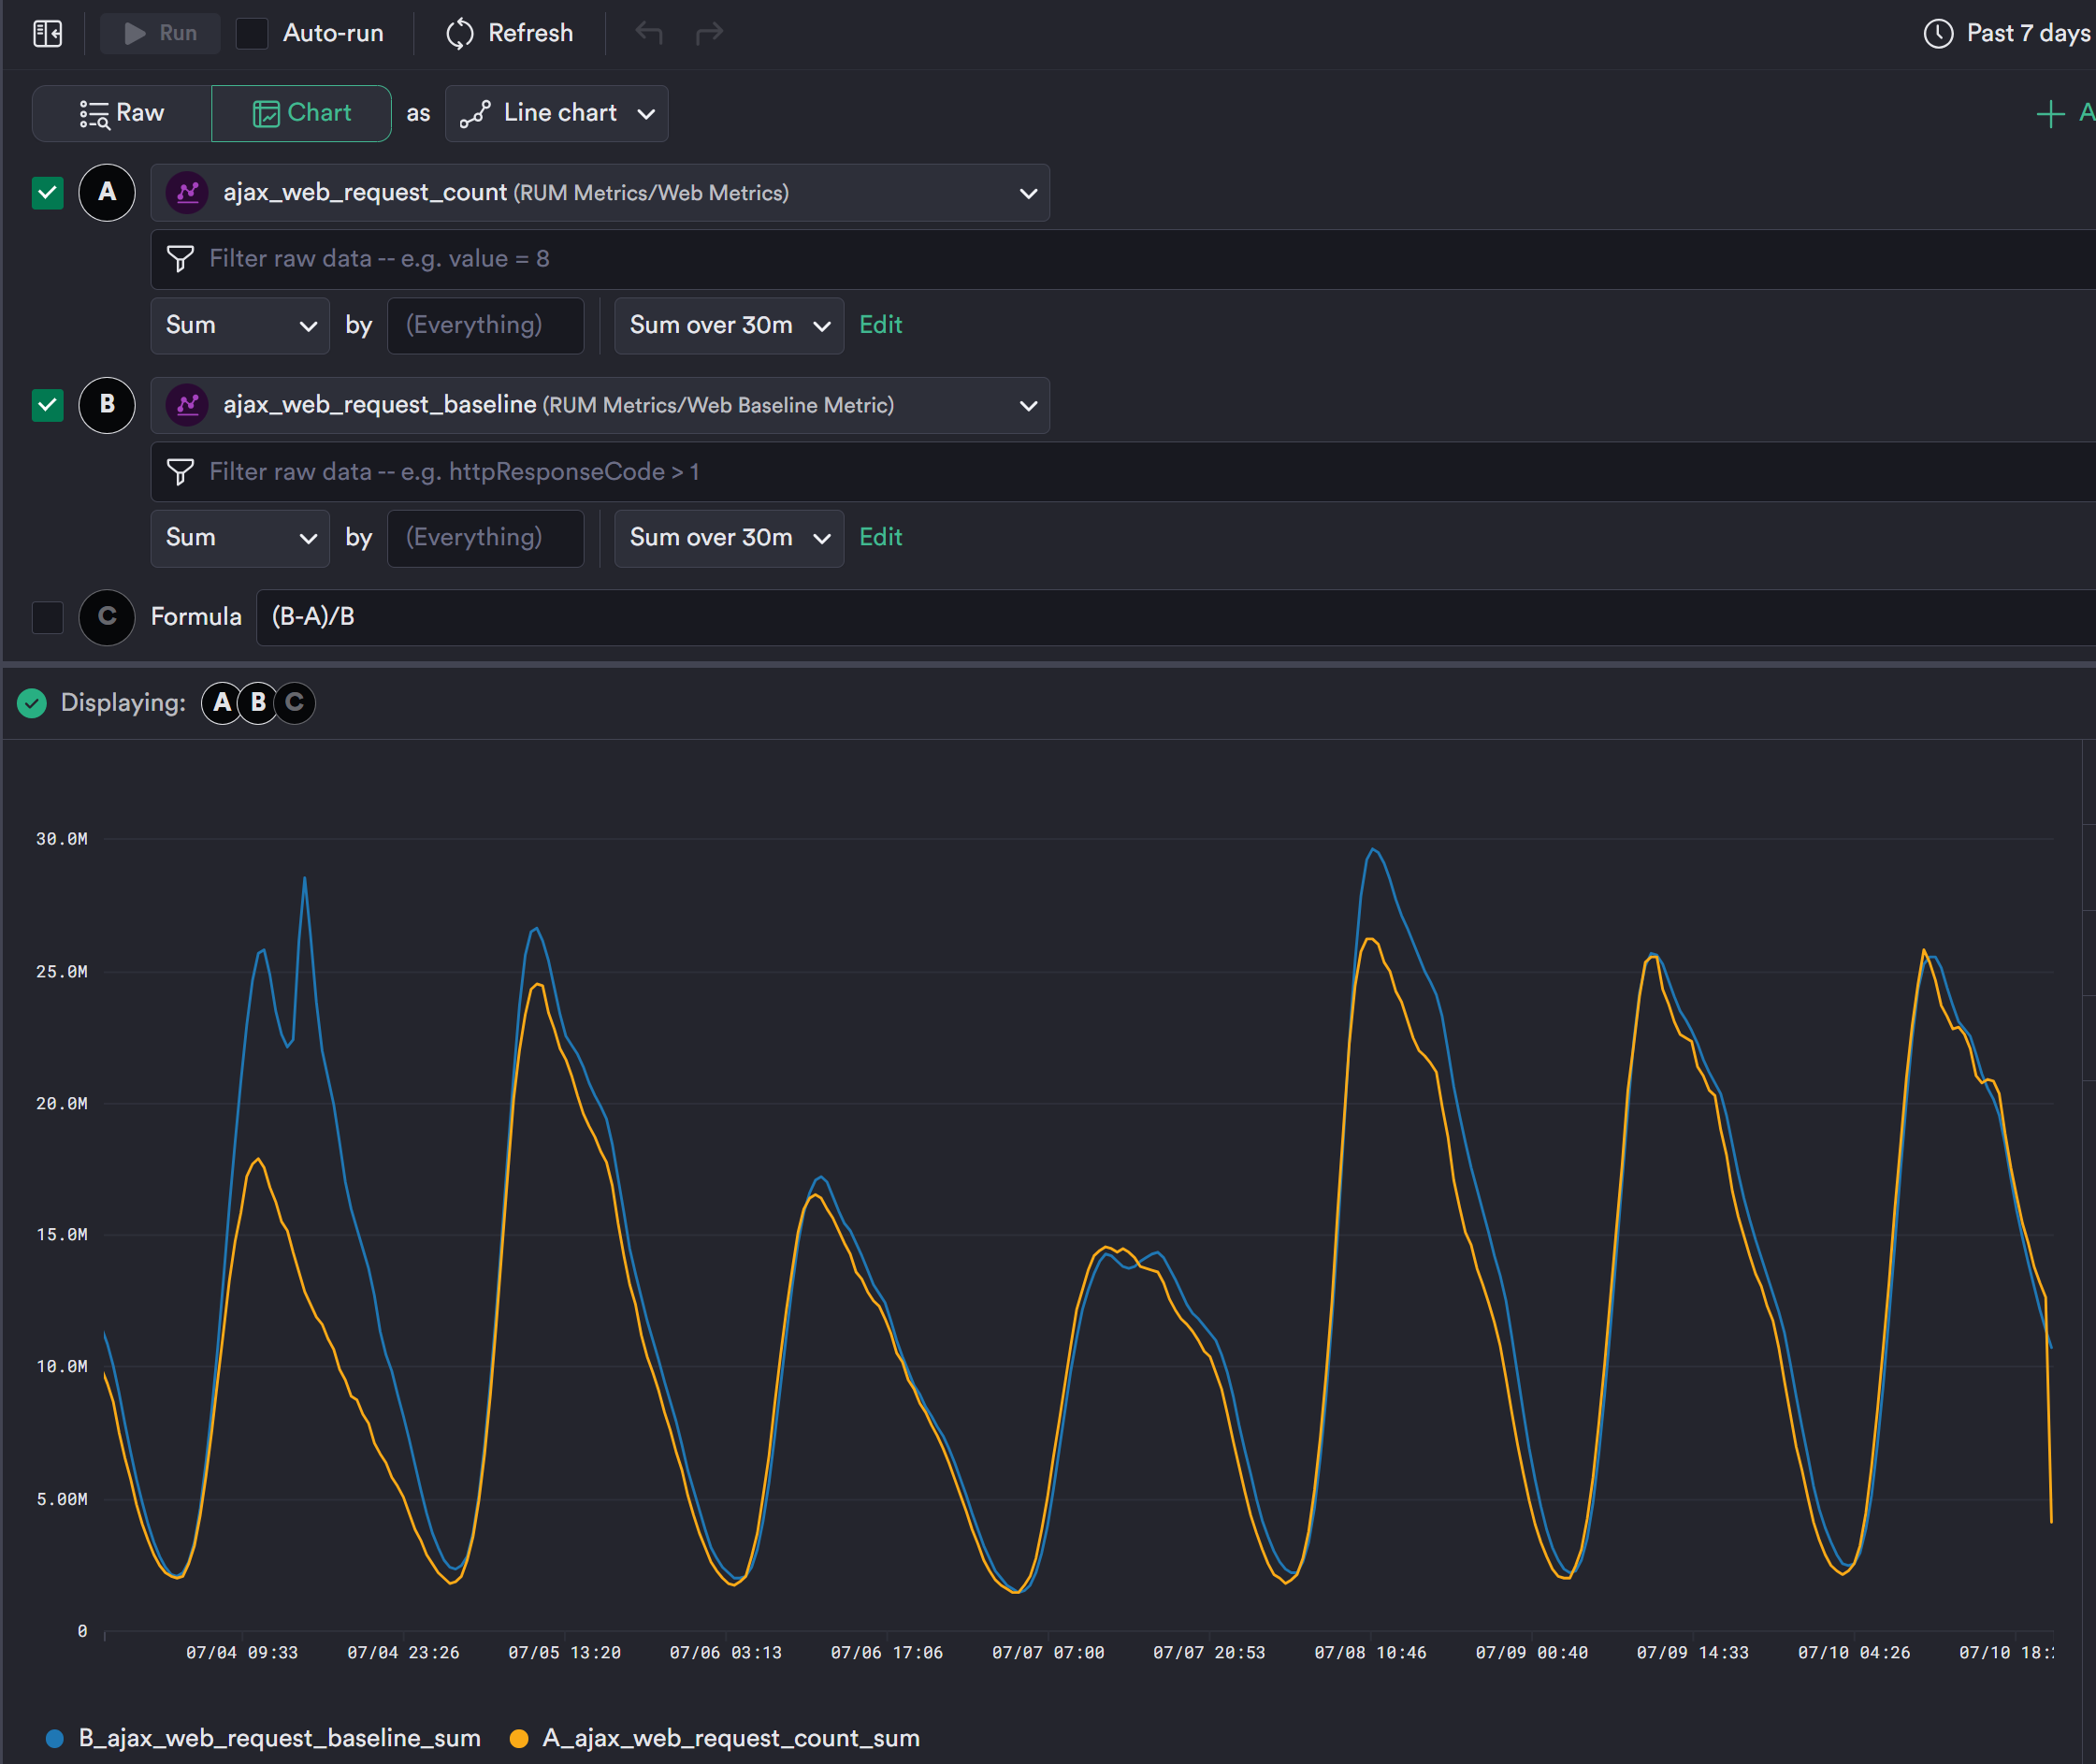
Figure 1 - Visually comparing a metric week over week
Then add a formula to represent any drift as a percentage.
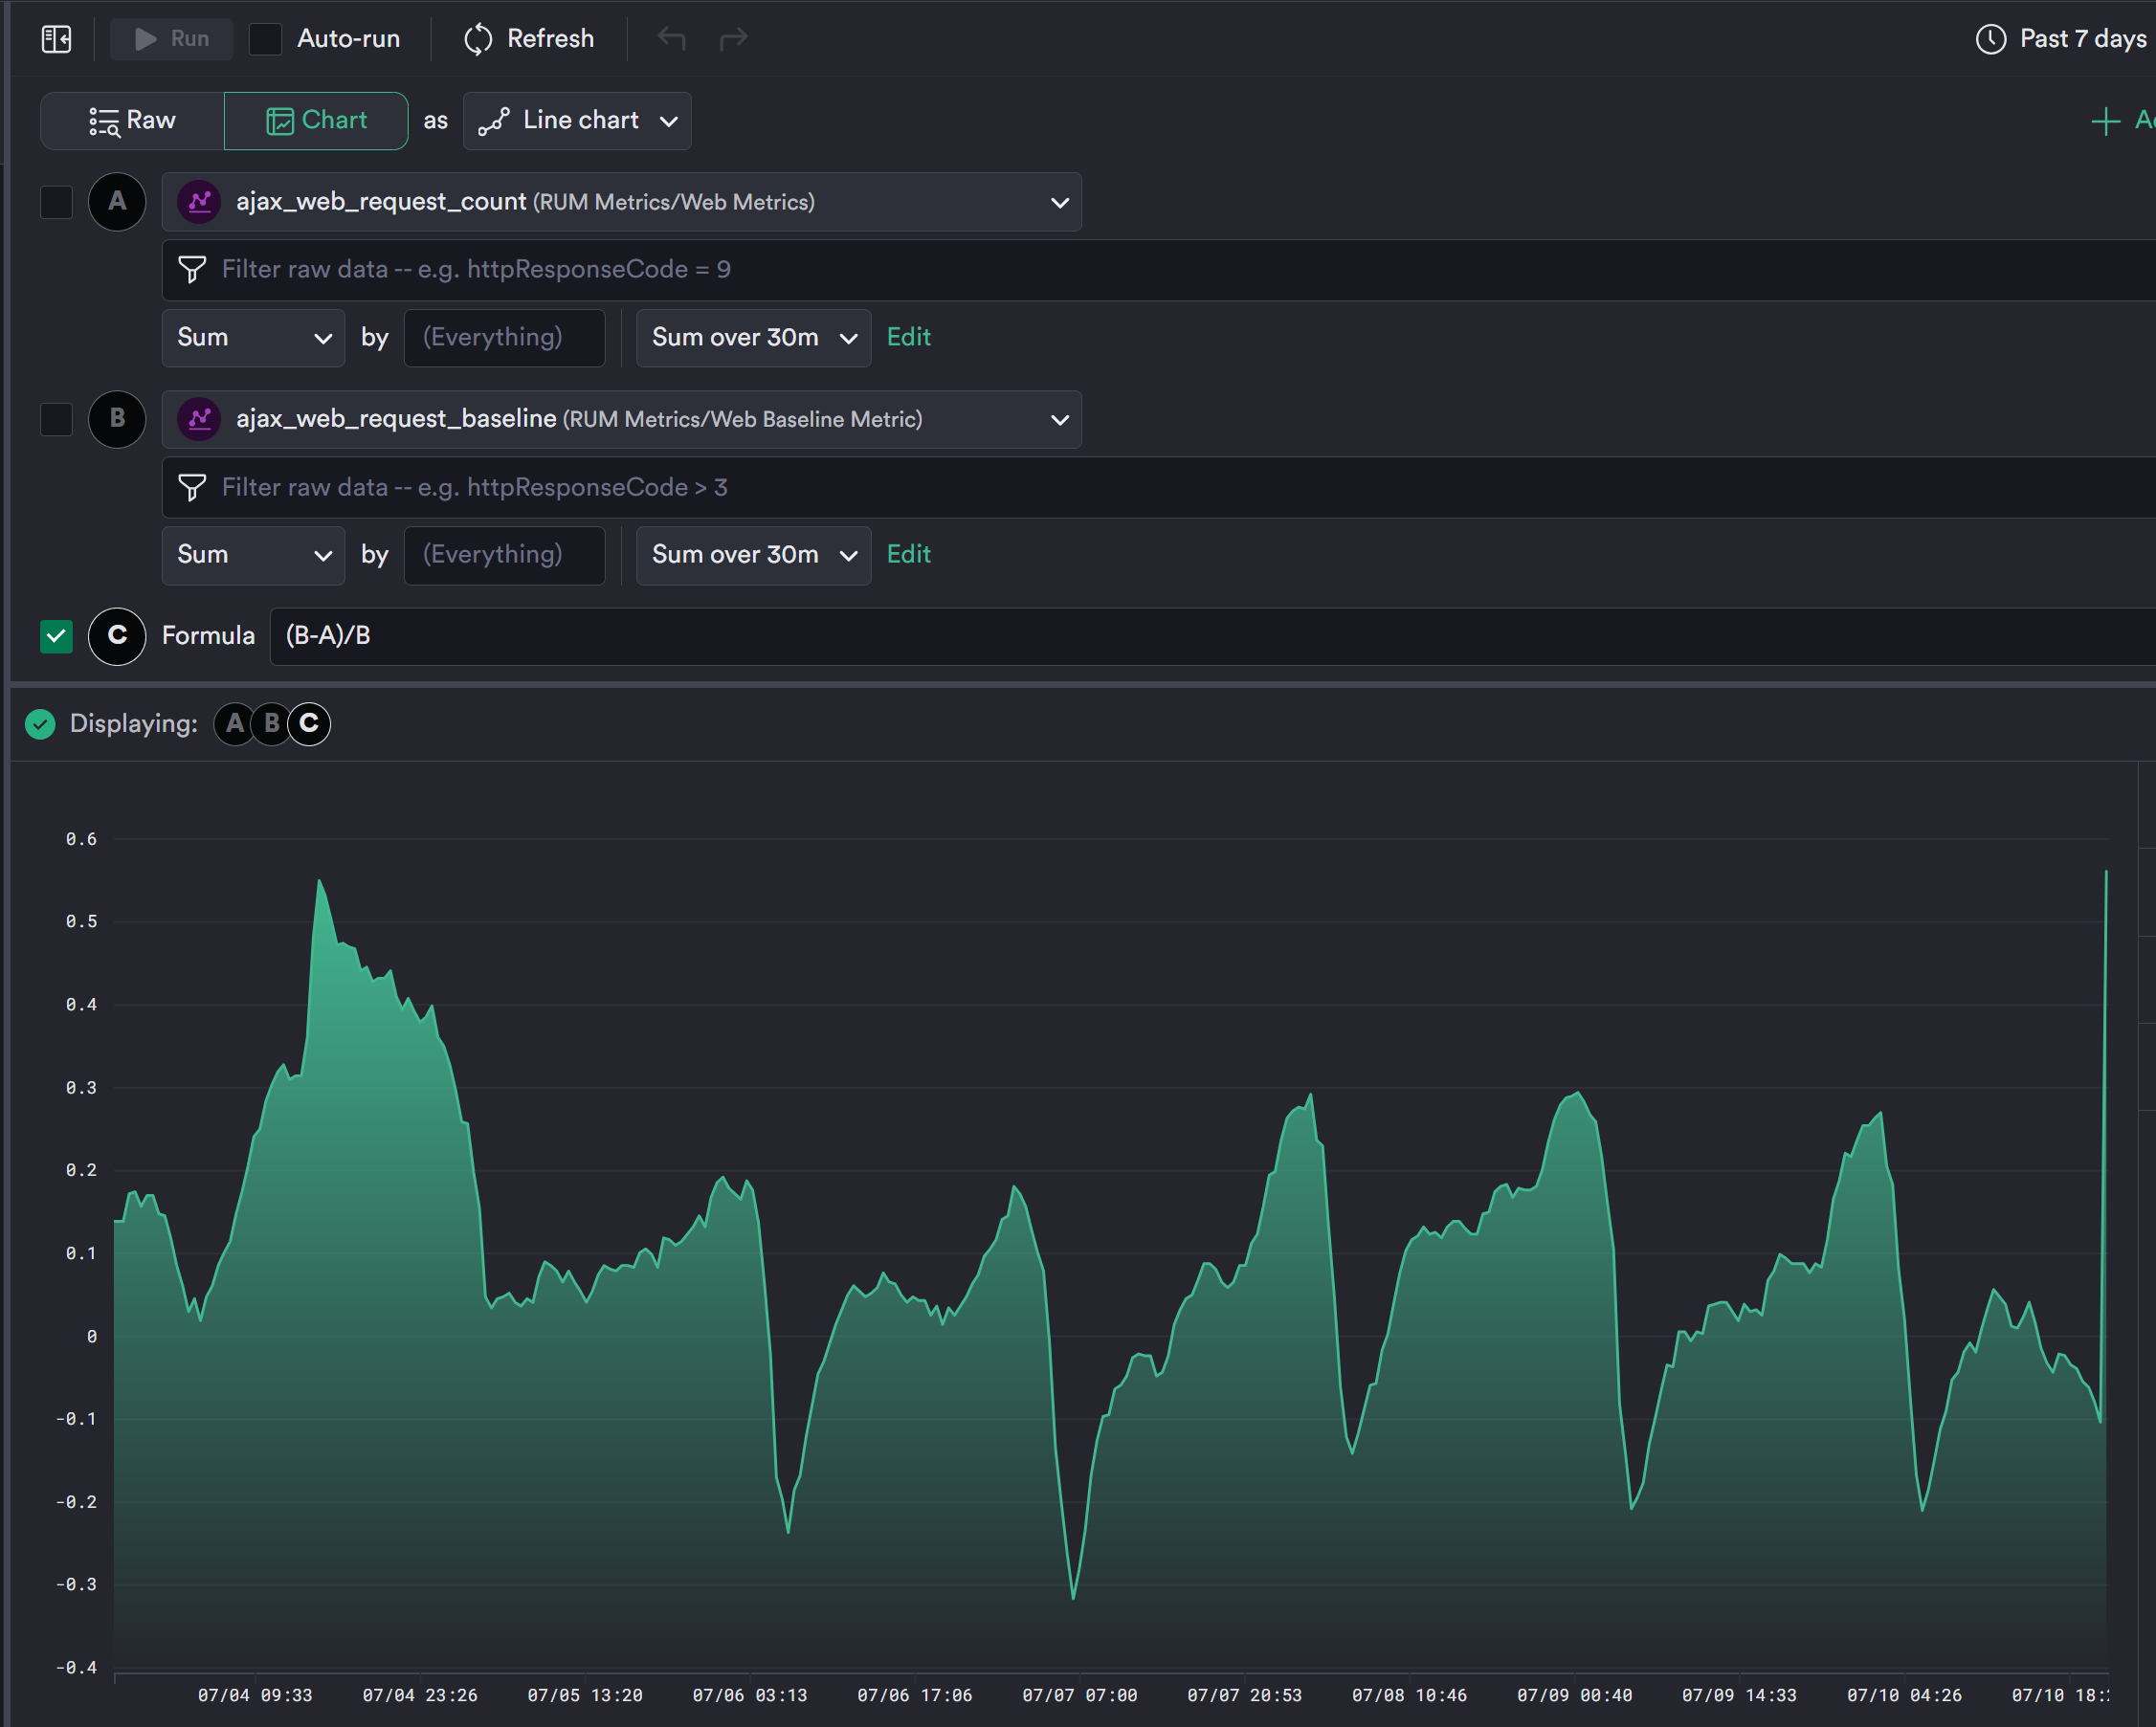
Figure 2 - Express a week over week metric delta as a percentage