Configuration
All user-provided configuration is in the observe-agent.yaml file. The agent will process this file when it starts and produce a final otel-collector configuration. The default configuration fragments for otel-collector are organized by connection type in the connections folder.
Enable or Disable Connections
These configuration fragments are tied to a specific feature that can be enabled or disabled. For example, in the host_monitoring connection type we have the fragments logs.yaml and metrics.yaml. Each of these is tied to a boolean field in the observe-agent.yaml file and will be included or omitted based on the value there.
Note
Since there’s no guarantee that any given feature will be enabled or disabled, these fragments must be independent of each other and cannot reference anything defined in other fragments. Referencing configuration between fragments could produce a broken otel-collector configuration.
Overriding existing OTEL Collector Configuration
You can also override existing components that are defined in the default fragments. To do so, find the name of the component you want to override and redefine it in the otel_config_overrides section of observe-agent.yaml. This section will override any prior definitions of components with the same name.
otel_config_overrides:
  exporters:
    debug:
      verbosity: detailed
      sampling_initial: 5
      sampling_thereafter: 200
  service:
    pipelines:
      # This will override the existing metrics/host_monitoring pipeline and output to stdout debug instead
      metrics/host_monitoring:
        receivers: [hostmetrics/host-monitoring-host]
        processors: [memory_limiter]
        exporters: [debug]
observe-agent.yaml Schema
Field |
Default |
Description |
|---|---|---|
token |
Observe authentication token |
|
observe_url |
Observe data collection endpoint |
|
debug |
false |
Set log level of agent to “DEBUG” |
host_monitoring |
Specifies options for the Host Monitoring Connection |
|
host_monitoring.enabled |
true |
Enables Host Monitoring Connection |
host_monitoring.logs |
Specifies options for the logs component within Host Monitoring |
|
host_monitoring.logs.enabled |
true |
Enables the logs component within Host Monitoring |
host_monitoring.metrics |
Specifies options for the metrics component within Host Monitoring |
|
host_monitoring.metrics.host |
Specifies options for host level metrics within Host Monitoring |
|
host_monitoring.metrics.host.enabled |
true |
Enables host level metrics within Host Monitoring |
host_monitoring.metrics.process |
Specifies options for process level metrics within Host Monitoring |
|
host_monitoring.metrics.process.enabled |
false |
Enables process level metrics within Host Monitoring |
otel_config_overrides |
Defines overrides to be added to the OTEL Collector configuration |
Note
The observe_url value is composed from https://${OBSERVE_CUSTOMER_ID}.collect.${OBSERVE_INSTANCE}. For example, if you typically login to https://123456789012.observeinc.com, your ${OBSERVE_COLLECTION_ENDPOINT} is https://123456789012.collect.observeinc.com.
Note
Some Observe instances may optionally use a name instead of Customer ID; if this is the case for your instance, contact your Observe Data Engineer to discuss implementation. A stem name will work as is, but a DNS redirect name may require client configuration.
Adding custom OTEL Collector Configuration
The top level observe-agent.yaml includes a section for providing additional OTEL collector configuration, otel_config_overrides. For example, to add a new exporter and a new pipeline to use it, you could define both in this section as follows:
otel_config_overrides:
  exporters:
    debug:
      verbosity: detailed
      sampling_initial: 5
      sampling_thereafter: 200
  service:
    pipelines:
      metrics/debug:
        receivers: [hostmetrics/host-monitoring-host]
        processors: [memory_limiter]
        exporters: [debug]
When the agent starts, it adds this section to the otel-collector configuration and loads it.
Fetching EC2 instance’s tags
Resource Detection Processor can optionally gather tags for the EC2 instance that the collector is running on.
Note
In order to fetch EC2 tags, the IAM role assigned to the EC2 instance must have a policy that includes the ec2:DescribeTags permission.
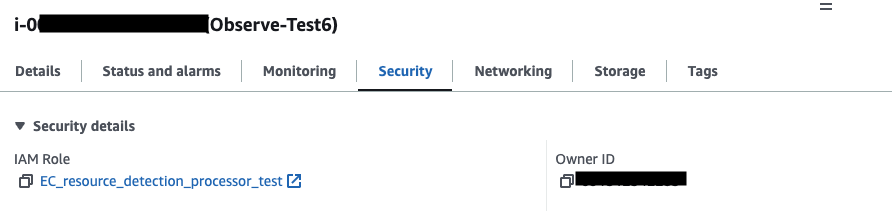
Let’s suppose you want to fetch 3 tags from an EC2 instance the Observe Agent is running on.

This otel_config_overrides section will fetch these 3 tags for the EC2 instance above:
otel_config_overrides:
  processors:
    resourcedetection/cloud:
      detectors: ["ec2"]
      timeout: 2s
      override: false
      ec2:
        # A list of regex's to match tag keys to add as resource attributes can be specified
        tags:
          - ^Service$
          - ^Name$
          - ^Environment$

Once the Observe Agent is runnig with this `otel_config_overrides` section, you will see the following additional fields under `resource.attributes`.
“resource”: { “attributes”: { … “ec2.tag.Environment”: “Staging”, “ec2.tag.Name”: “Observe-Test6”, “ec2.tag.Service”: “Checkout”, … } }
Tailing a log file
For example, this otel_config_overrides section will tail a log file:
otel_config_overrides:
	receivers:
	  filelog/custom-name:
		# Define directories or files to include here
	    include: [/opt/ProductionApp/RiskLogs/**/*.log]
	    include_file_path: true
	    storage: file_storage
	    retry_on_failure:
	      enabled: true
	    max_log_size: 4MiB
	service:
		pipelines:
		  logs/custom-logs:
	        receivers: [filelog/custom-name]
	        processors: [memory_limiter, transform/truncate, resourcedetection, batch]
	        exporters: [otlphttp/observe, count]
otel_config_overrides:
	receivers:
	  filelog/custom-name:
		# Define directories or files to include here
	    include: [D:\\Production\ App\\Risk\ Logs\\**\\*.log]
	    include_file_path: true
	    storage: file_storage
	    retry_on_failure:
	      enabled: true
	    max_log_size: 4MiB
	service:
		pipelines:
		  logs/custom-logs:
	        receivers: [filelog/custom-name]
	        processors: [memory_limiter, transform/truncate, resourcedetection, batch]
	        exporters: [otlphttp/observe, count]
Receiving data from a Splunk Forwarder
To use the Observe Agent to receive data from Splunk forwarders, you have a Splunk Enterprise or Cloud Instance alongside either a Splunk Universal Forwarder or a Splunk Heavy Forwarder routing data to your Splunk instance. The Observe Agent will receive data from the forwarder over TCP port 9997. This requires the following configurations for the Observe Agent and Splunk Forwarders.
# this should be added to the existing observe-agent.yaml
otel_config_overrides:
  receivers:
    tcplog/s2s:
        add_attributes: true
        listen_address: 0.0.0.0:9997
        operators:
            - field: attributes.log_type
              type: add
              value: splunk_tcp
  service:
    pipelines:
      logs/forward:
        receivers: [tcplog/s2s]
        exporters: [otlphttp/observe]
[tcpout]
defaultGroup = observeAgent

[tcpout:observeAgent]
server = hostname:9997
compressed = false
useACK = false
sendCookedData = false