Log Explorer
Your organization may generate large amounts of log data and events through applications, networks, systems, and users, and requires a systematic process to manage and monitor different data across log files. Log management requires a continuous process of centrally collecting, parsing, storing, analyzing, and disposing of data to provide actionable insights for supporting troubleshooting, performance enhancement, or security monitoring.
Computer-generated data that serves as a primary source for information about activities, usage patterns, and operations on your applications, servers, or other devices can be stored as log files. Use log files to identify and analyze situations where applications, networks, and systems experience bottlenecks or performance issues. Log files provide detailed information about every action and provide insights into identifying root causes of anomalies or problems.
Managing log files requires collecting data from multiple sources of logs, and these are the most common types of log files:
System logs - logs that record events generated within an OS, such as driver errors or CPU usage.
Application logs - logs generated when an event occurs inside an application. Use application logs to measure and understand how your application functions after releasing it or during the development cycle.
Security logs - logs generated when security events such as unsuccessful login attempts, failed authentication requests, or password changes occur in your organization.
In the Getting Started with Observe tutorial, you investigated log events for a Kubernetes container Dataset using a Worksheet and OPAL. Using Log Explorer allows you to locate the logs in a Dataset without initially creating a Worksheet and filtering for the logs.
To start using the Log Explorer, log into your Observe instance and locate the Logs icon on the left navigation bar.
The time range will automatically adjust for optimal display of the selected log data set. Use the time range picker menu at the top right to adjust time range as needed.
Quick Start Using Kubernetes Container Logs
This quick tutorial builds on the Getting Started with Observe material, but instead of looking for errors in the logs, you want to know about the errors responses that occur in the logs.
Log into your Observe instance and use the following steps to search for errors in your Kubernetes Container Logs:
From the left navigation bar, under Investigate, click Logs.
In the Search log datasets field, enter Container Logs, and select it from the search results.
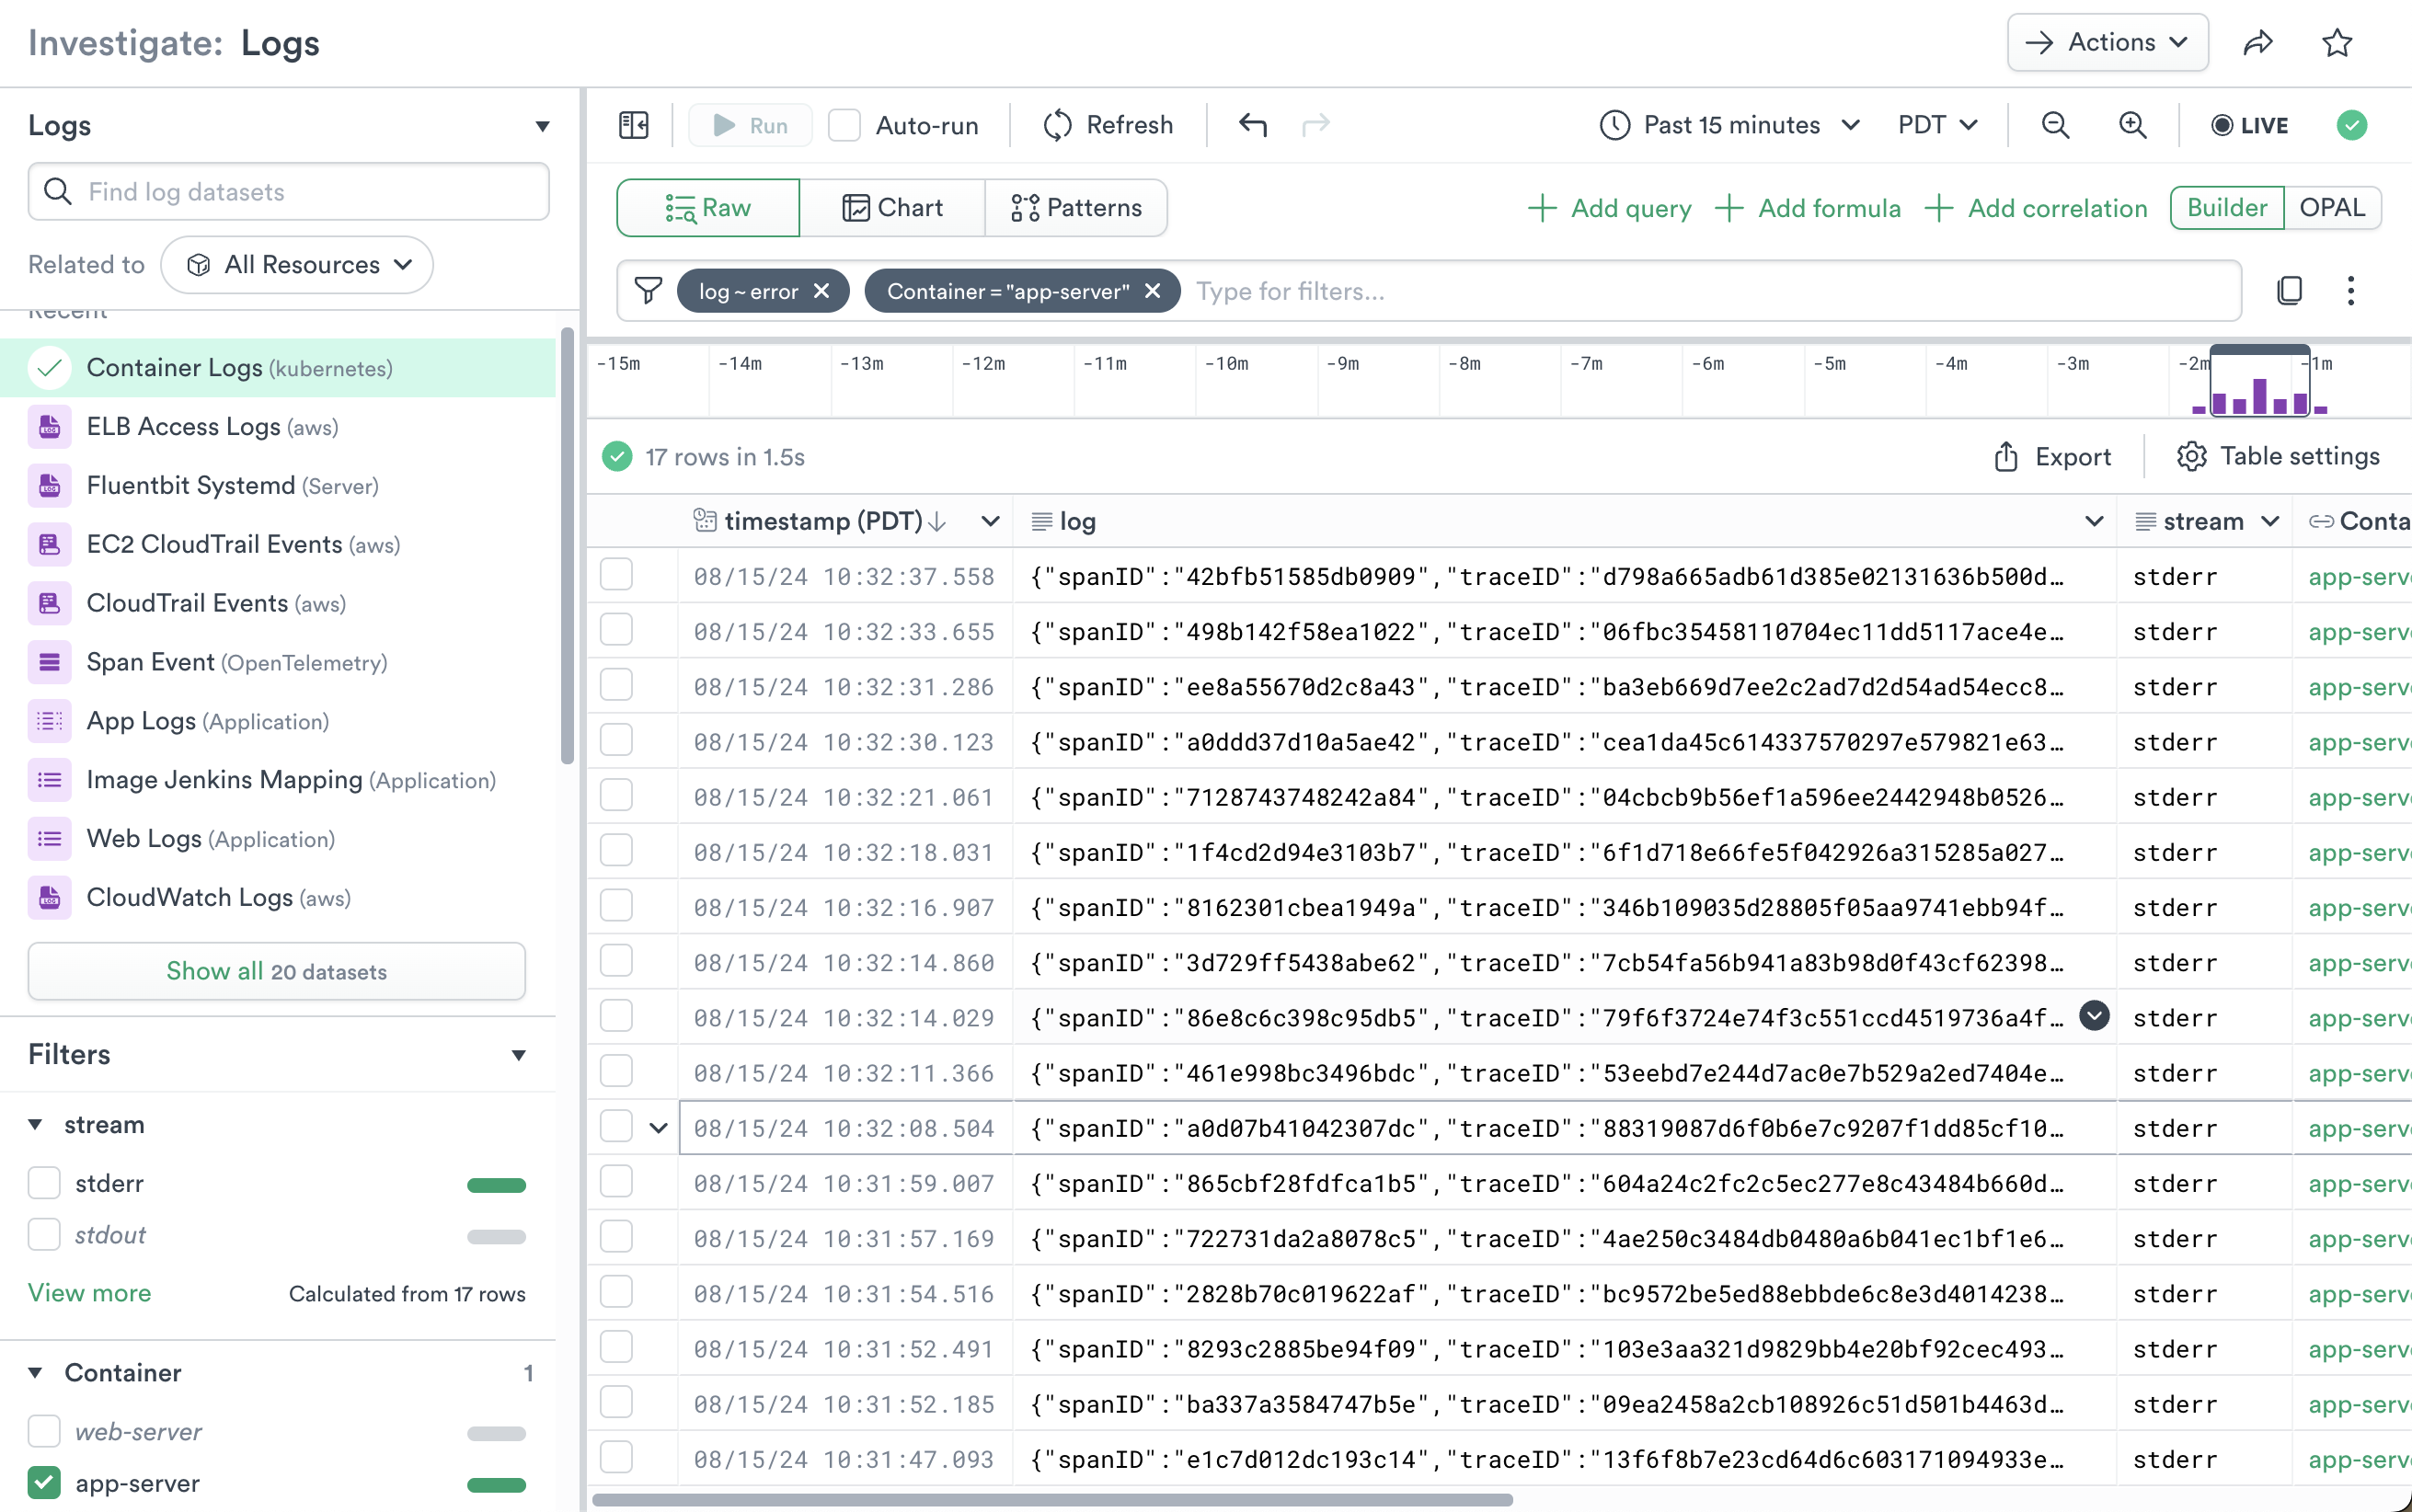
In the Filter field, enter “log”, select “~”, and enter “error”. This filters entries in the Container Logs to only those with the string “error” in the log column.
From the left-side Filters list for the Dataset, scroll to “Containers” and select “app-server” to view only errors from the “app-server” Container.

Figure 1 - Container Logs with app-server and error Filters
Token Search
Note
To enable this feature, please contact Observe Support.
When working with a dataset, searching for a specific ID or keyword with logs accumulated over time may only return a few results. The search accesses a lot of data and needs considerable computation time for scanning the logs, which results in considerable costs and high query latency.
To make your search return results more quickly, Observe supports Token Search by building an underlying token index. This feature supports only complete tokens and is case-insensitive.
The Tokenization uses a combination of major and minor separators to divide the log strings into tokens.
Major Separators
List of major separators:
'[', ']', '<', '>', '(', ')', '{', '}',
'|', '!', ';', ',', '*', '&', '?', '+', '\'', '"', '\n',
'\r', '\t', ' ', '=',
0x1D, // Group Separator ASCII
0x1E, // Record Separator ASCII
0x1F, // Unit Separator ASCII
// Multi byte
'␝', // U+241D - Group Separator UTF-8
'␞', // U+241E - Record Separator UTF-8
'␟', // U+241F - Unit Separator UTF-8
Minor Separators
List of minor separators:
'/', ':', '@', '.', '-', '$', '#', '%', '\\', '_'
Tokenization Rules
The indexing is following these tokenization rules::
Divide the input string using only major separators. All substrings become tokens.
Hello World-OutThere → ["Hello", "World-OutThere"]
2. Divide the input string using major and minor separators. All substrings become tokens.
Hello World-OutThere → ["Hello", "World-OutThere", "World", "OutThere"]
3. Divide the input string using major separators and then divide the output string to only include tokens with the same minor separator.
Hello 127.0.0.1:8080 → ["Hello", "127.0.0.1:8080", "127", "0", "0", "1", "8080", "127.0.0.1", "1:8080"]
Note
Tokens smaller than five (5) characters are not indexed as they are not selective enough for the search to be effective.
Testing the Token Rules
make_col tokenized_logs:test_index_tokenization(log, "major_minor_v1")
make_col tokenized_string:test_index_tokenization("Hello world", "major_minor_v1")
Observe only supports the tokenizer ‘major_minor_v1’, and you don’t need to specify the tokenizer if the dataset already has an index.
Querying with a Token or Tokens
filter column ~ <token> requires a column name and at lesat a single token. The OPAL function identifies when a token contains a major separator and if there is not a real token. The function can only be used with filter.
filter log ~ <hello>
---
filter log ~ <hello> and <world>
---
filter log ~ <hello world>
---
filter log ~ <hello>
filter log ~ <world>
Case Insensitive
The following queries will return the same results.
filter log ~ <hello>
filter log ~ <Hello>
filter log ~ <HELLO>
filter log ~ <"hello">
filter log ~ <"Hello">
filter log ~ <"HELLO">
filter contains_token(log, "hello")
Tokens are not in order
The following queries will return the same results.
filter log ~ <hello world>
filter log ~ <world hello>
If you need a phrase search, use the following query to search for a token first, and then check the order.
filter log ~ <hello world> and log ~ "hello world"
Token search with conjunctions and disjunctions
You can combine token search with boolean expressions queries
filter log ~ <hello> and log ~ <world>
filter log ~ <hello> or log ~ <aloha>
filter log ~ <aloha> or (log ~ <hello> and log ~ <world>)
Token search can also be combined with other predicates
filter log ~ <hello> and column = 100
filter log ~ <hello> or column = 100
Accelerating boolean expression queries with index
For queries that use conjunctions of predicates (i.e., AND), query can be accelerated by index if any of the predicates can use token index, equality index, or substring index.
For queries that use disjunctions of predicates (i.e., OR), query can be accelerated by index if all predicates can use token index, equality index, or substring index.
Example Errors
filter log !~ <hello>
--> token search can only be combined using `and` with other token search functions.

---
filter stream ~ <hello>
--> no index found on column "stream", available indexed column(s): "log".
Use the following examples to create queries on your tokenized dataset:
All indexed columns
filter * ~ <token>
Single column
filter column ~ <token>
Log Explorer Overview
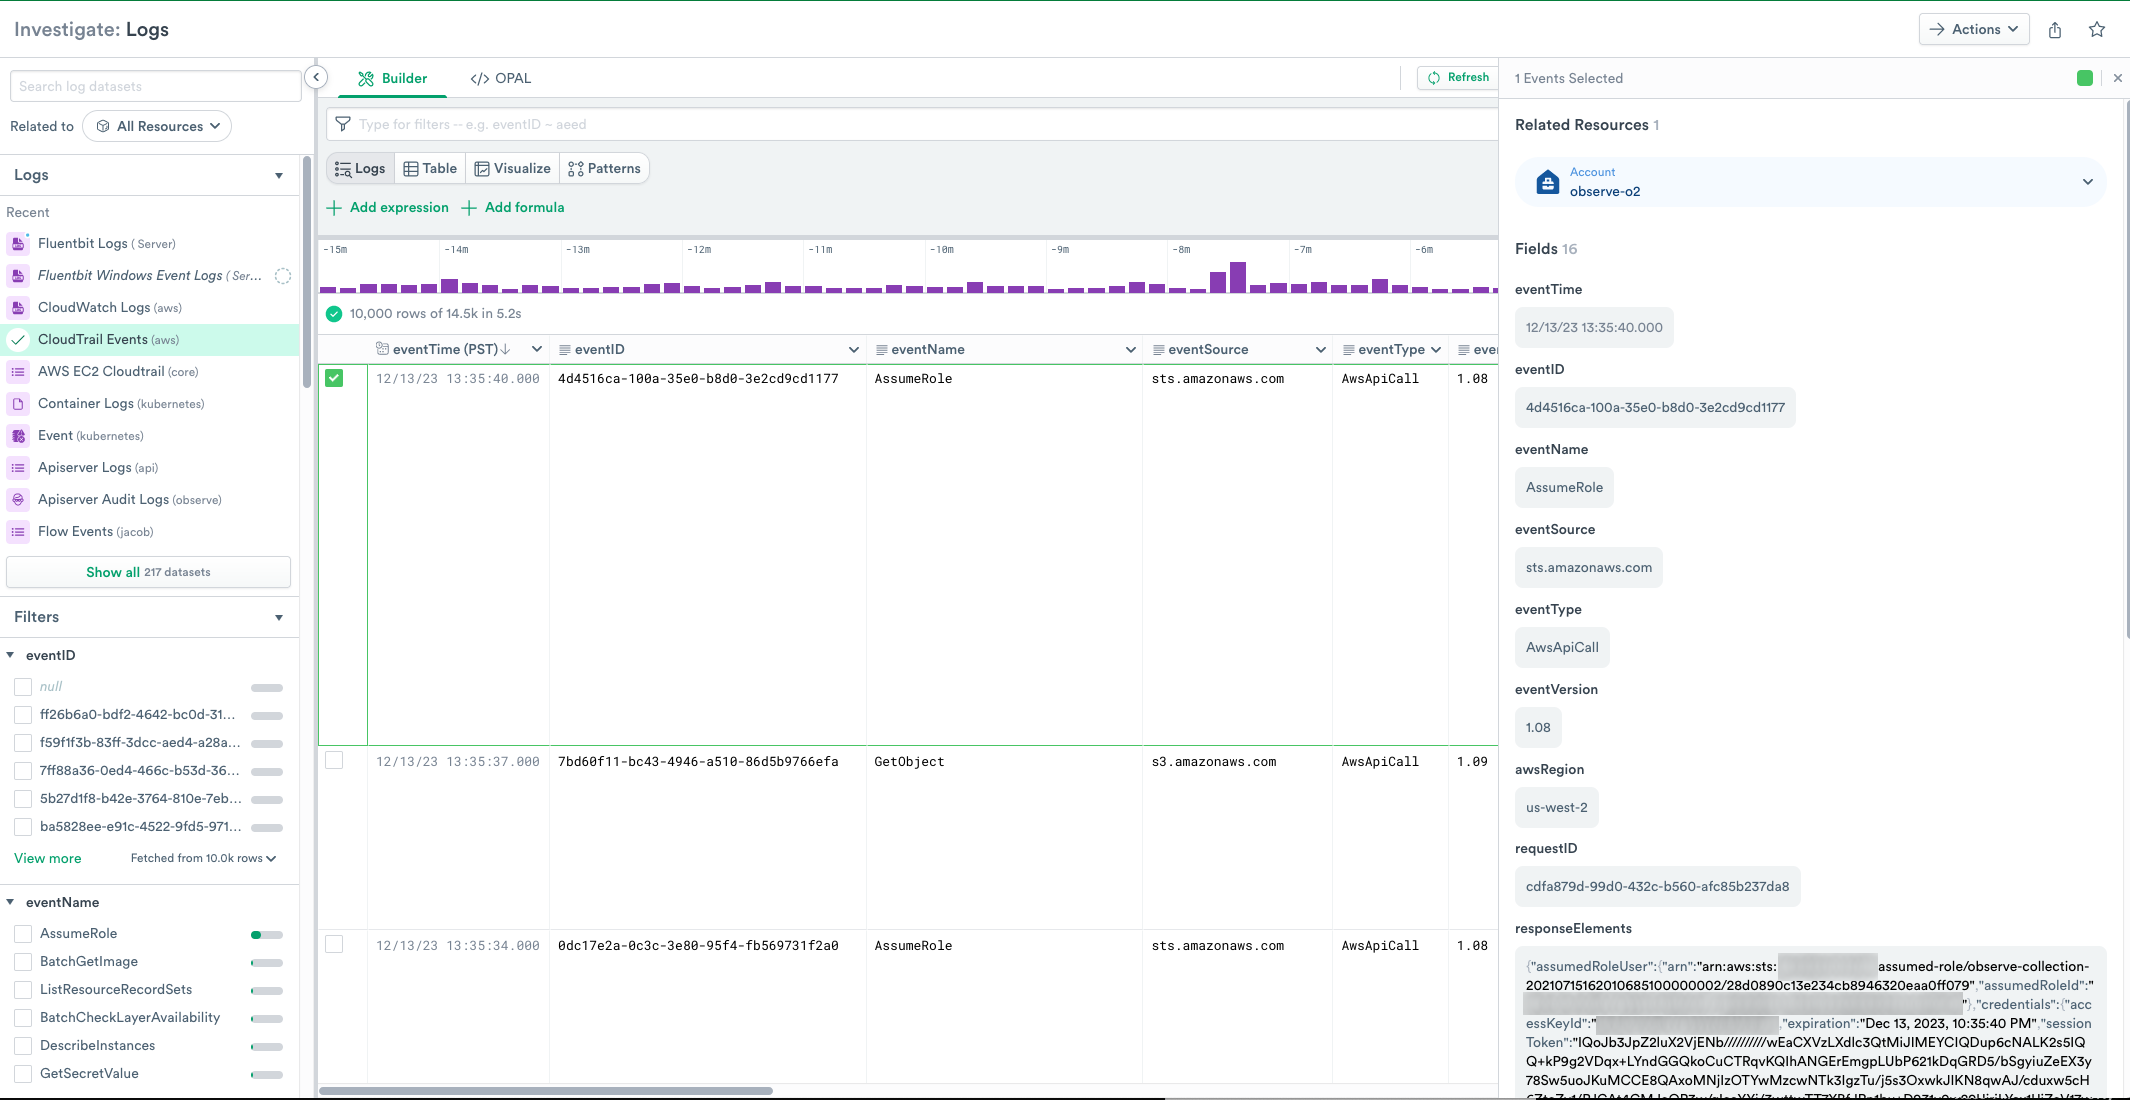
The left menu displays a Search that allows you to search for specific Log Datasets.
Log Explorer displays a list of available Log Datasets logs. If you don’t see the desired Datasets, use the Search function to locate it.
The left menu also displays a list of Filters to use with the currently selected Logs dataset. When you select a Filter, the Filter appears in the Query Builder.
In the center panel, you can build filters using the Query Builder and select from a dropdown list of parameters, or you can select OPAL and use OPAL to build your filter list.
By default, Log Explorer will show data in Raw format as log events. Selecting a row from the list of Logs displays details of the log in the right panel.
You can use column formatting tools to filter, sort, and visualize the data. Use a context-click on the column header to display options for working with data in a single column. The available options depend on the data type in the column.
Filter - filter the column by values in the data (including or excluding).
Exclude null values - remove empty cells from the column.
Create summary - add a summary of the data in a column.
Extract from string - extract parameters depending on the type of string. This may use O11y GPT features if enabled.
Sort (lexical, numeric, or time sorting in ascending or descending order based on the column data type)
Conditional Formatting - Apply color and style to string or numeric column types based on conditional formatting rules
Hide column - hide the column from view. This does not affect the query or dataset.
Auto-resize** - adjust column size to optimize display on your screen
Convert - cast a column to a different data type.
Add related fields
Existing - add existing parameters to the column data.
Create new - create a new parameter.
You can also use context-click on a single cell to work with its data. The available options depend on the data type in the column.
Show surrounding data - this option adjust the time filter to focus on a time range based on this column’s timestamp.
Copy - copy the value to clipboard. For most data types this will be a simple copy. For datetime columns, you have options such as locale or ISO 8601 formatting. on a line in a Time Series visualization, this displays a menu that allows you to select from two options:
Extract from string - extract parameters depending on the type of string. This may use O11y GPT features if enabled.
Explain this message - Use O11y GPT features (if enabled) to open an O11y GPT chat window and explain the message.
Inspect - open the right rail with this data formatted for best display, search, and extraction.
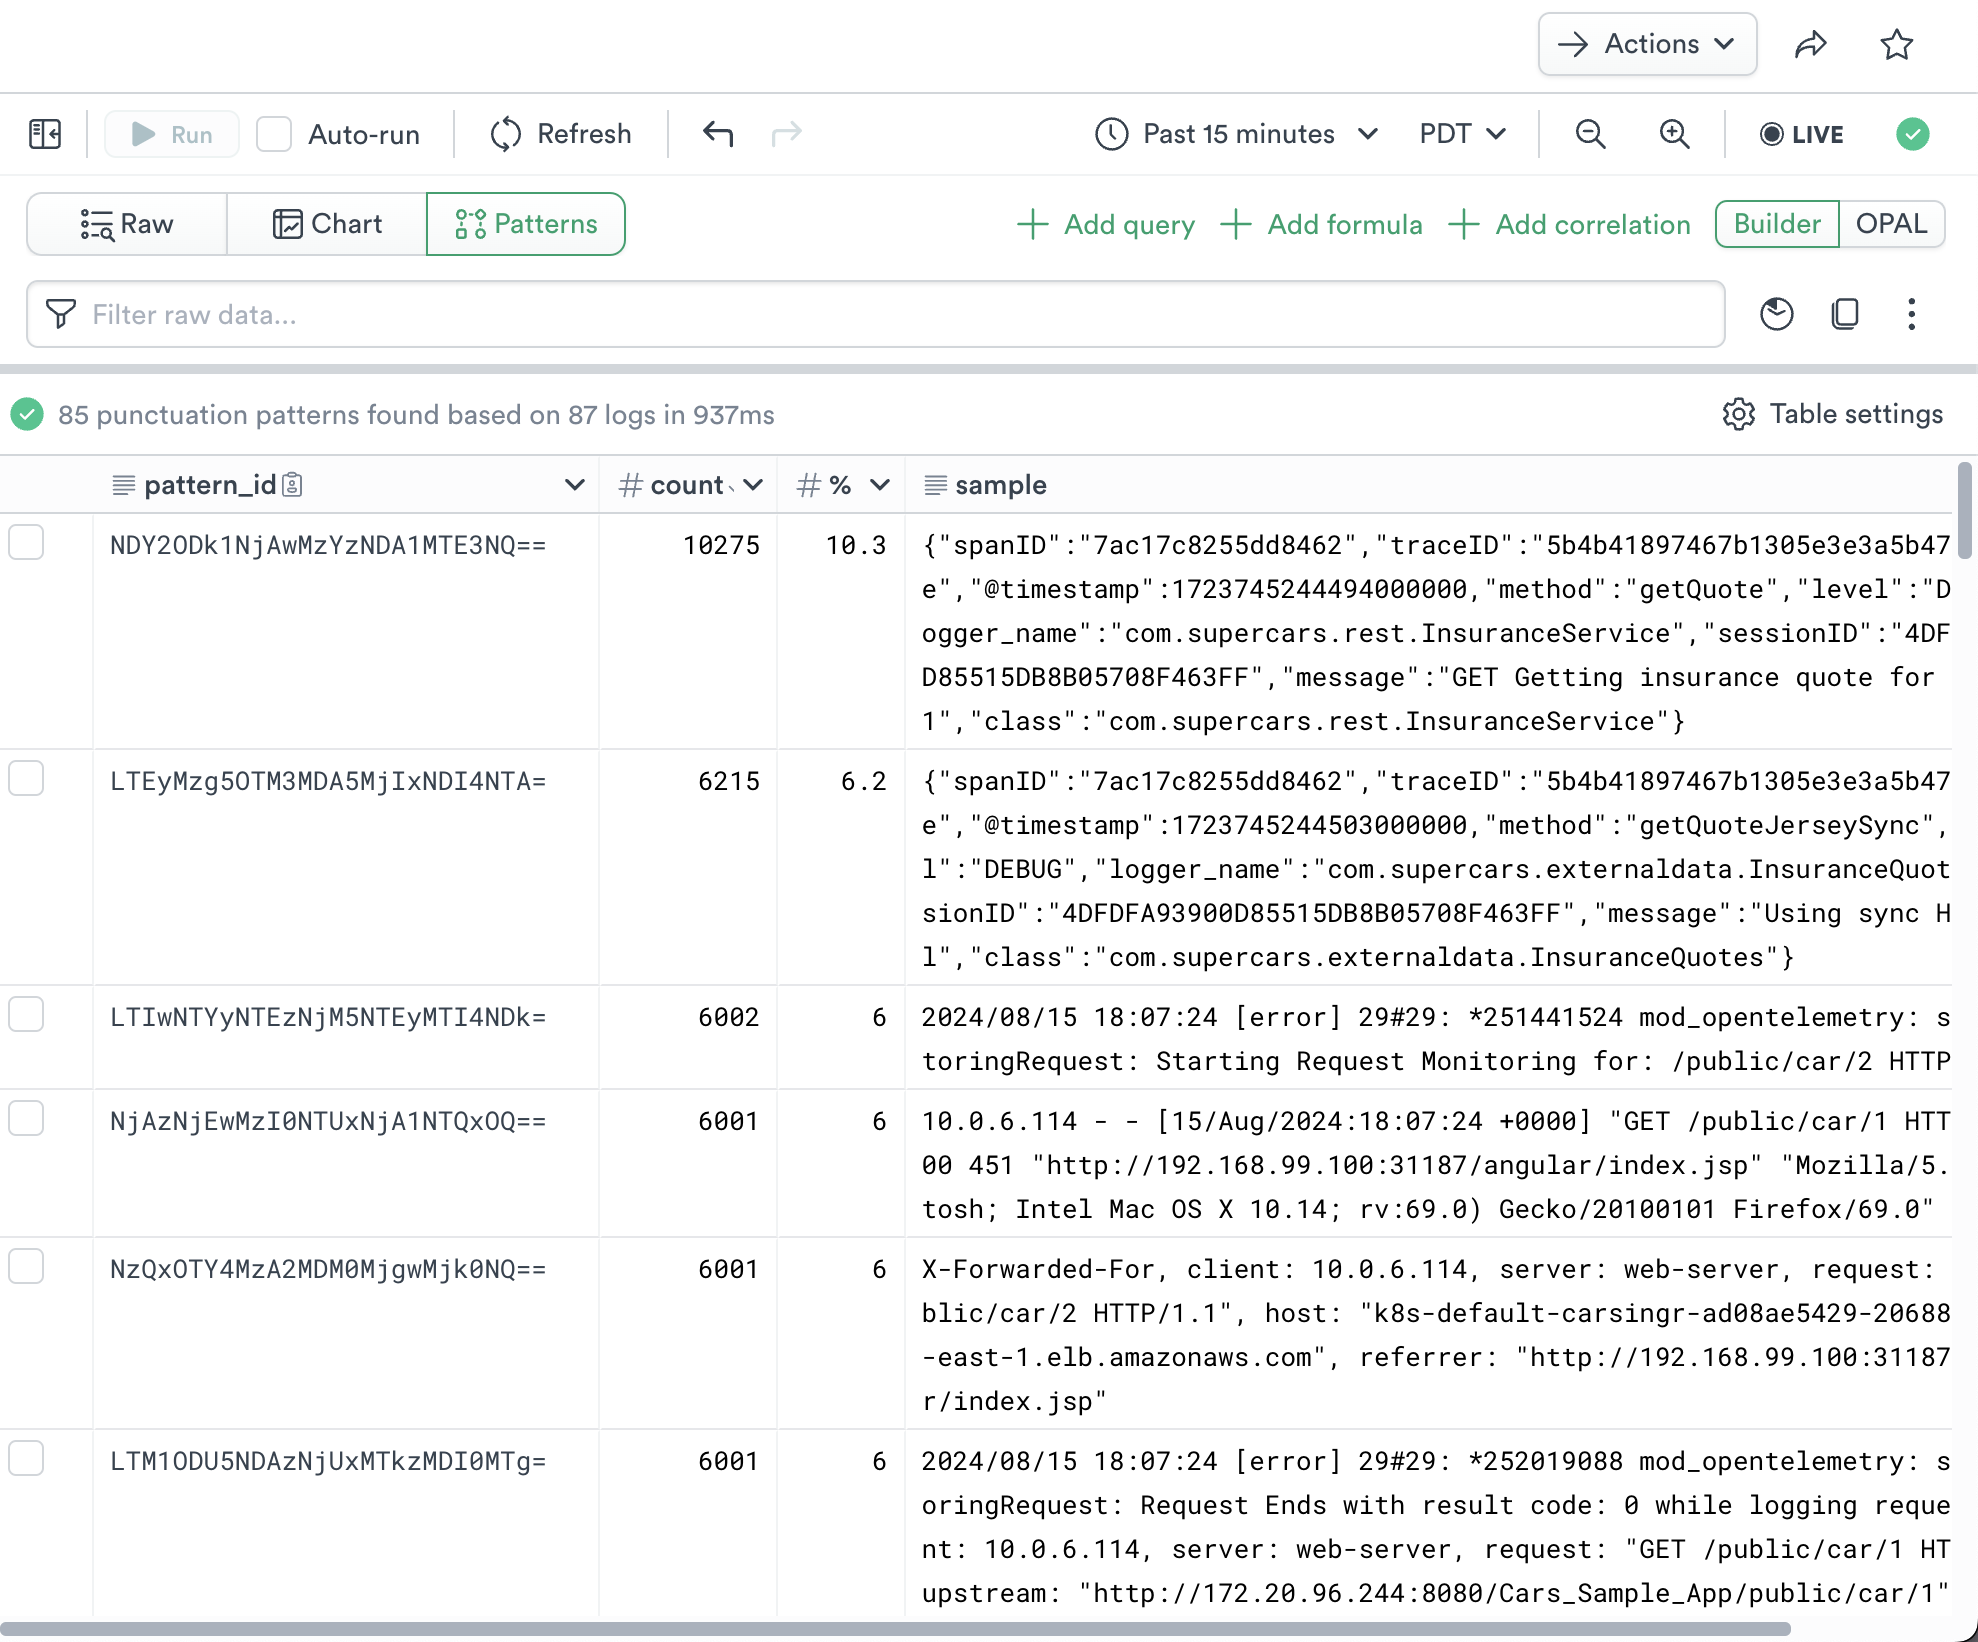
The log data from a busy system can be voluminous and difficult to understand. Click Patterns to apply a pattern-finding algorithm. Use context clicks on the cells in the table to filter by or exclude pattern IDs, then return to Raw mode and continue your analysis.

Figure 3 - Log Pattern Analysis
How it works: Pattern analysis fingerprints log rows using textual characteristics and groups matching fingerprints by prevalence. An example row is included.
Visualization
Click Chart to display the Log Events as a visualization of the events. Log Explorer will automatically produce a Line Chart from a count of events, but you can use the Expression Builder to build a custom visualization matching your data. See Visualization Types Reference for full discussion of the available visualizations and options.
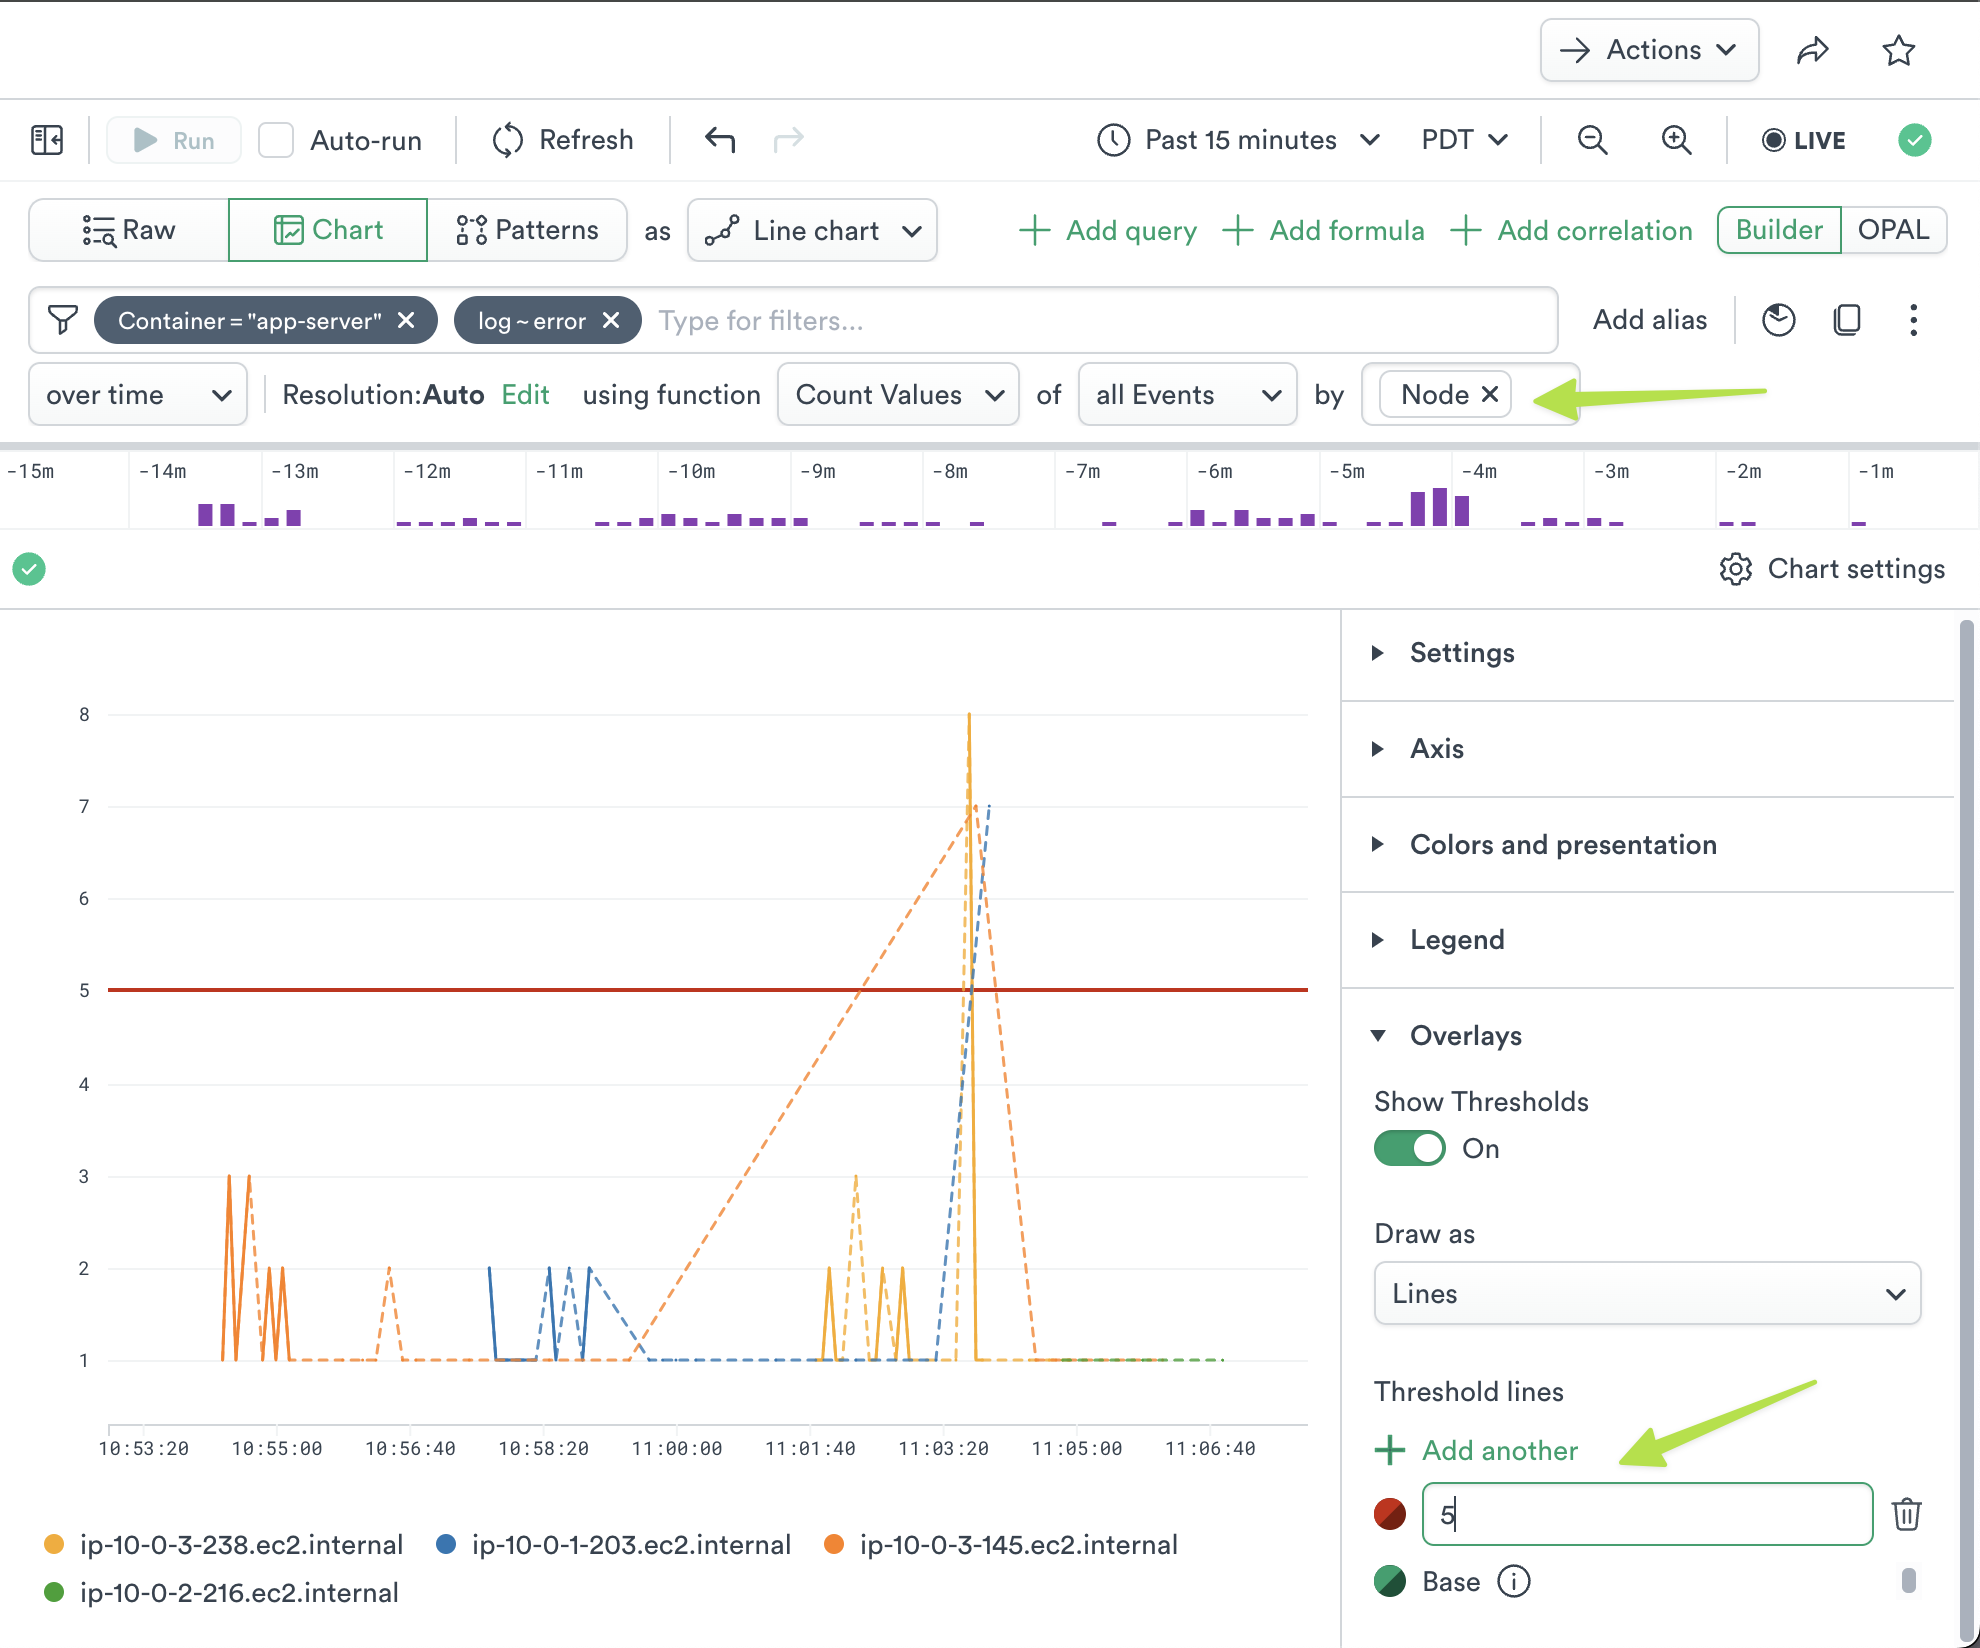
For instance, we might group the default chart by “Node”, add a Threshold at “5”, and click Run.

Figure 4 - Changing Visualization
A given element in a chart also has a contextual menu. In this case, click a line to see these options:
Show this data only - This allows you to display only that graph line in the visualization.
Exclude this data - Remove the data from the visualization.
Copy - Copy the graph line.
Inspect - Inspect the data for the graph line.
For selected resource - Displays the related resource which you can open in a new window.
View related - View the following related data in new windows:
Dashboard
Metrics
Logs
Actions
Use the Actions button at the top right corner to perform the following tasks:
Exporting Data
To download the data displayed in Log Explorer, click the Export button. You may select CSV or JSON format, and a maximum size limit (one thousand, ten thousand, or one hundred thousand rows). Note that hidden fields will be included. Use the pick_col OPAL verb to reduce the width of downloaded data.
If you need to extract more data, see the Observe API.
