Send .NET application data to Observe
This page describes how to install the Observe Agent, then instrument your .NET applications to send data to Observe.
To view the list of instrumented libraries and compatible versions, see Traces instrumentations in the OpenTelemetry documentation.
To manually instrument custom logic, see Instrumentation for .NET in the OpenTelemetry documentation.
Compatibility
To send .NET application data to Observe, you must have .NET 4.6.2+ on the following platforms:
- x86
- AMD64 (x86-64)
- ARM64 (Experimental, CentOS images not supported)
Get the Observe Agent
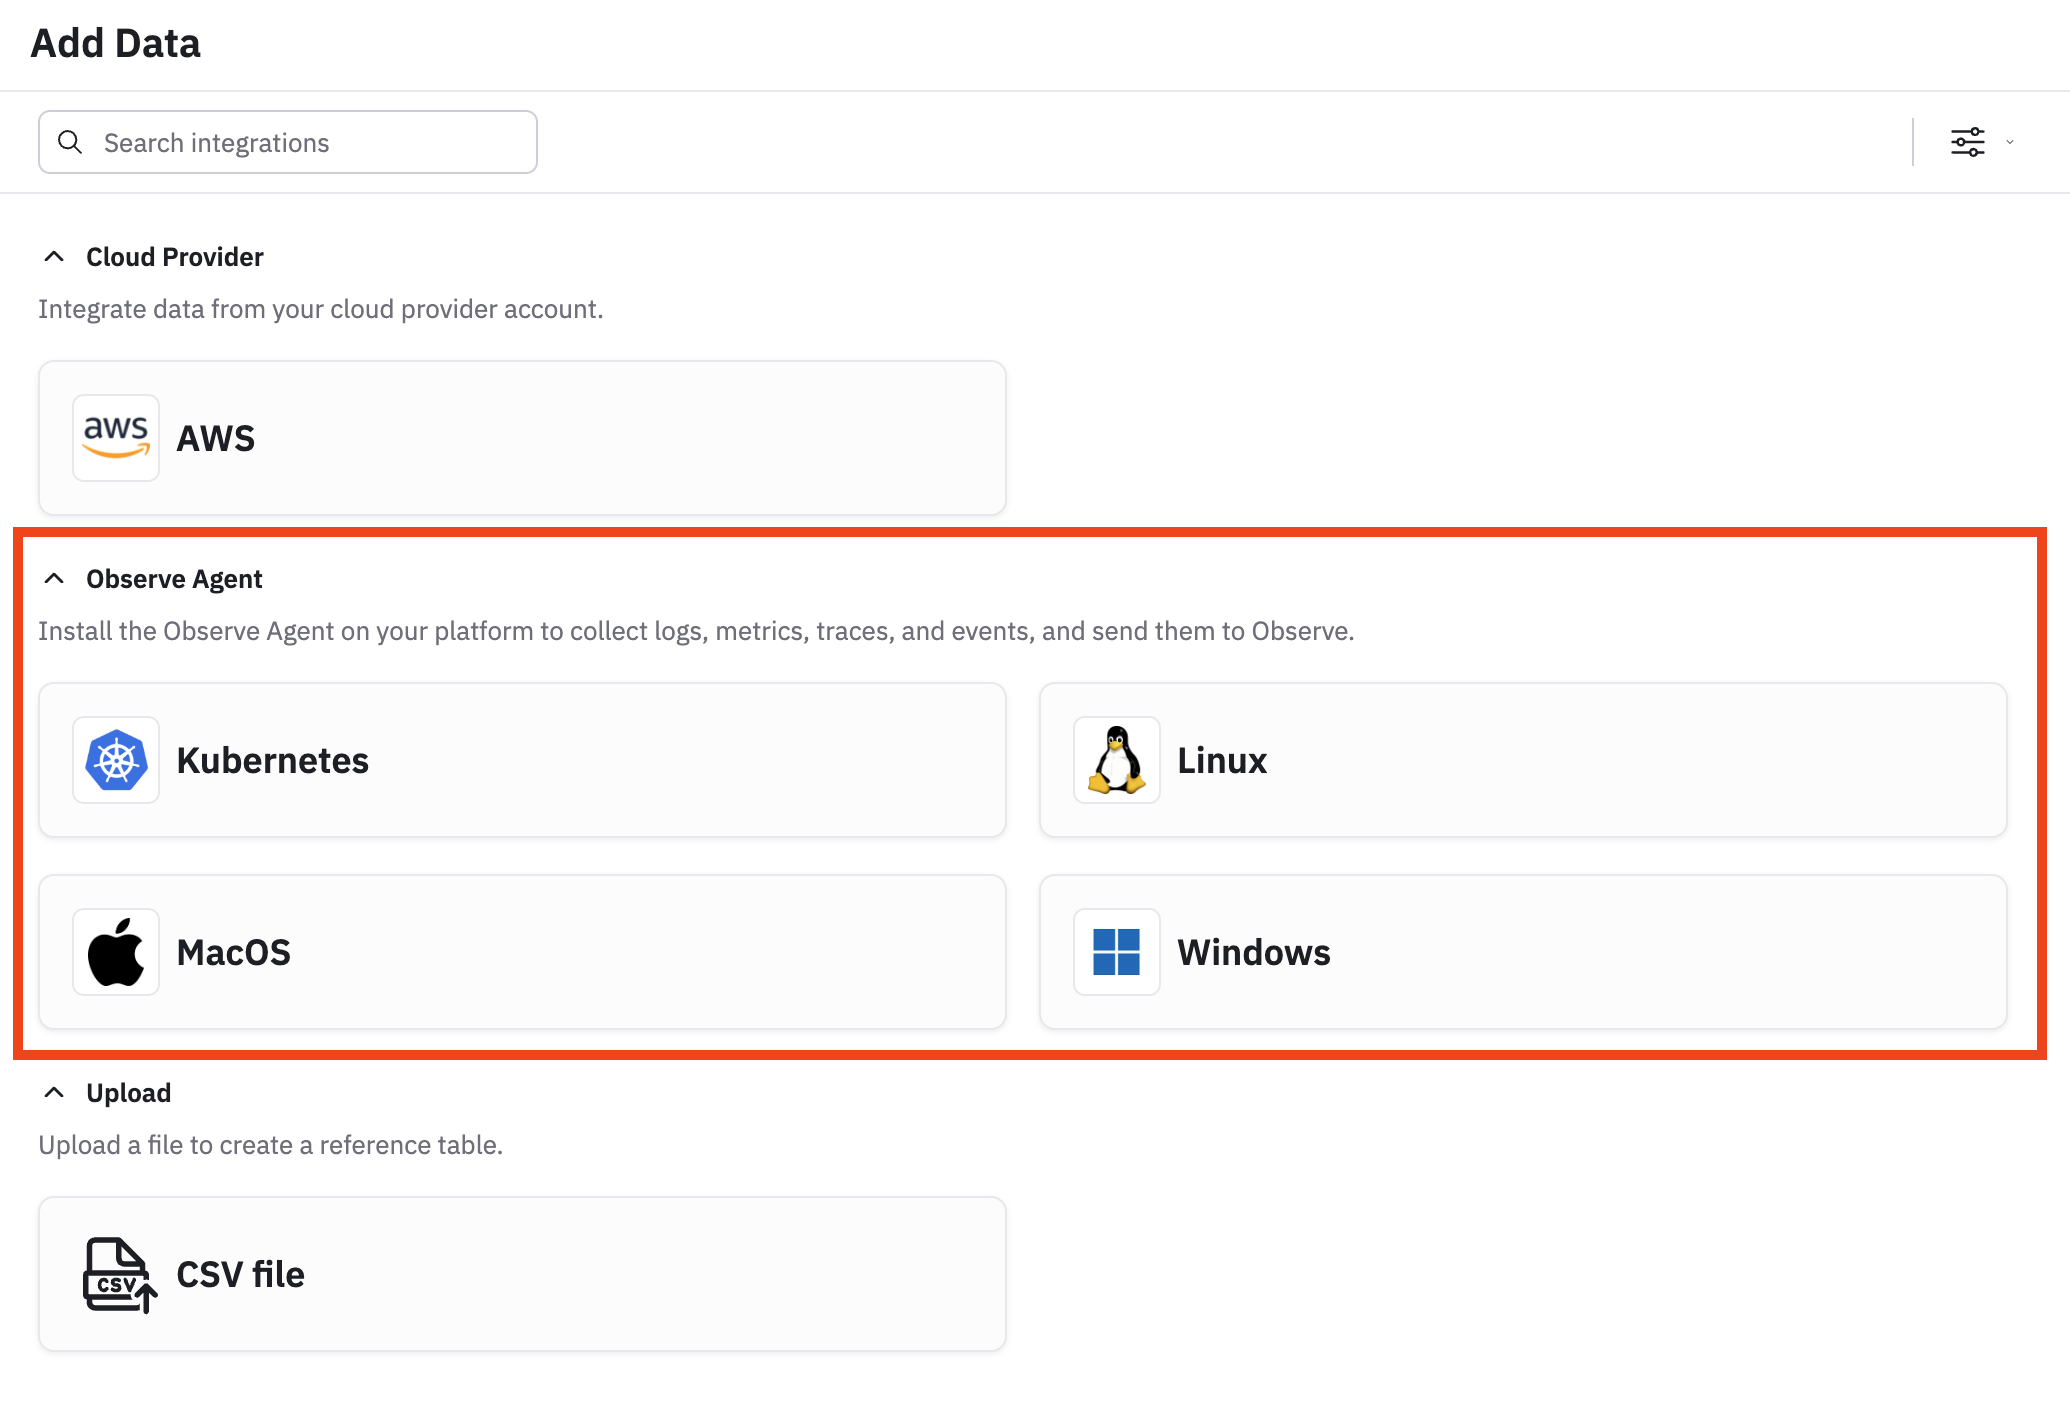
Use the Add Data portal in the product to get the Observe Agent installed in your environment.
- From the left navigation rail, select Data & integrations > Add data.
- In the Observe Agent section, pick your environment, then follow the instructions to create a data ingest token and install the Observe Agent.
Install the OpenTelemetry zero-code instrumentation for .NET
The instrumentation is distributed via an installer script. Follow the instructions for your operating system.
# Download the bash script
curl -sSfL https://github.com/open-telemetry/opentelemetry-dotnet-instrumentation/releases/latest/download/otel-dotnet-auto-install.sh -O

# Install core files
sh ./otel-dotnet-auto-install.sh

# Enable execution for the instrumentation script
chmod +x $HOME/.otel-dotnet-auto/instrument.sh

# Setup the instrumentation for the current shell session
. $HOME/.otel-dotnet-auto/instrument.sh
Instrument an ASP.NET application deployed on IIS
Run the following in Powershell (note, the final command will cause IIS to restart):
Import-Module "OpenTelemetry.DotNet.Auto.psm1"

Install-OpenTelemetryCore

Register-OpenTelemetryForIIS
Configure the instrumentation
Set the following environment variables. Replace the placeholders such as ${YOUR_SERVICE_NAME} with the actual information from your environment.
OTEL_SERVICE_NAME=${YOUR_SERVICE_NAME}
OTEL_RESOURCE_ATTRIBUTES=deployment.environment=${YOUR_APP_ENVIRONMENT}
OTEL_EXPORTER_OTLP_ENDPOINT=http://${YOUR_OBSERVE_AGENT_ENDPOINT}:4318
Run your instrumented app
./MyNetAppNext steps
Navigate to Traces in your Observe tenant to view traces from your application.
- Use Trace Explorer to find traces in your environment.
- Use service management to view your services and their dependencies.
- Monitor and track new deployments on your service.
- View logs associated with a trace.
- Use the APM reference to see what data is collected by APM.
Updated about 2 months ago