Azure App Services
Microsoft Azure App Services allows you to quickly build, deploy, and scale Web apps and APIs on your terms.
Installed Datasets
- Azure/App Service
- Azure/App Service App Dependencies
- Azure/App Service App Requests
- Azure/App Service Events
- Azure/App Service Exceptions
- Azure/App Service Logs
- Azure/App Service Metrics
- Azure/App Service Operations
- Azure/App Service Traces
- Azure/Application Insights
View Azure App Services in Observe
By default, Observe provides the following dashboards:
Azure App Services dashboard
The Azure App Services dashboards provide a high-level overview of your Azure App Service. From the dashboards, you can answer questions such as the following:
- What is the execution time for my app?
- What are the HTTP response codes for my app?
- How often is my app executing?
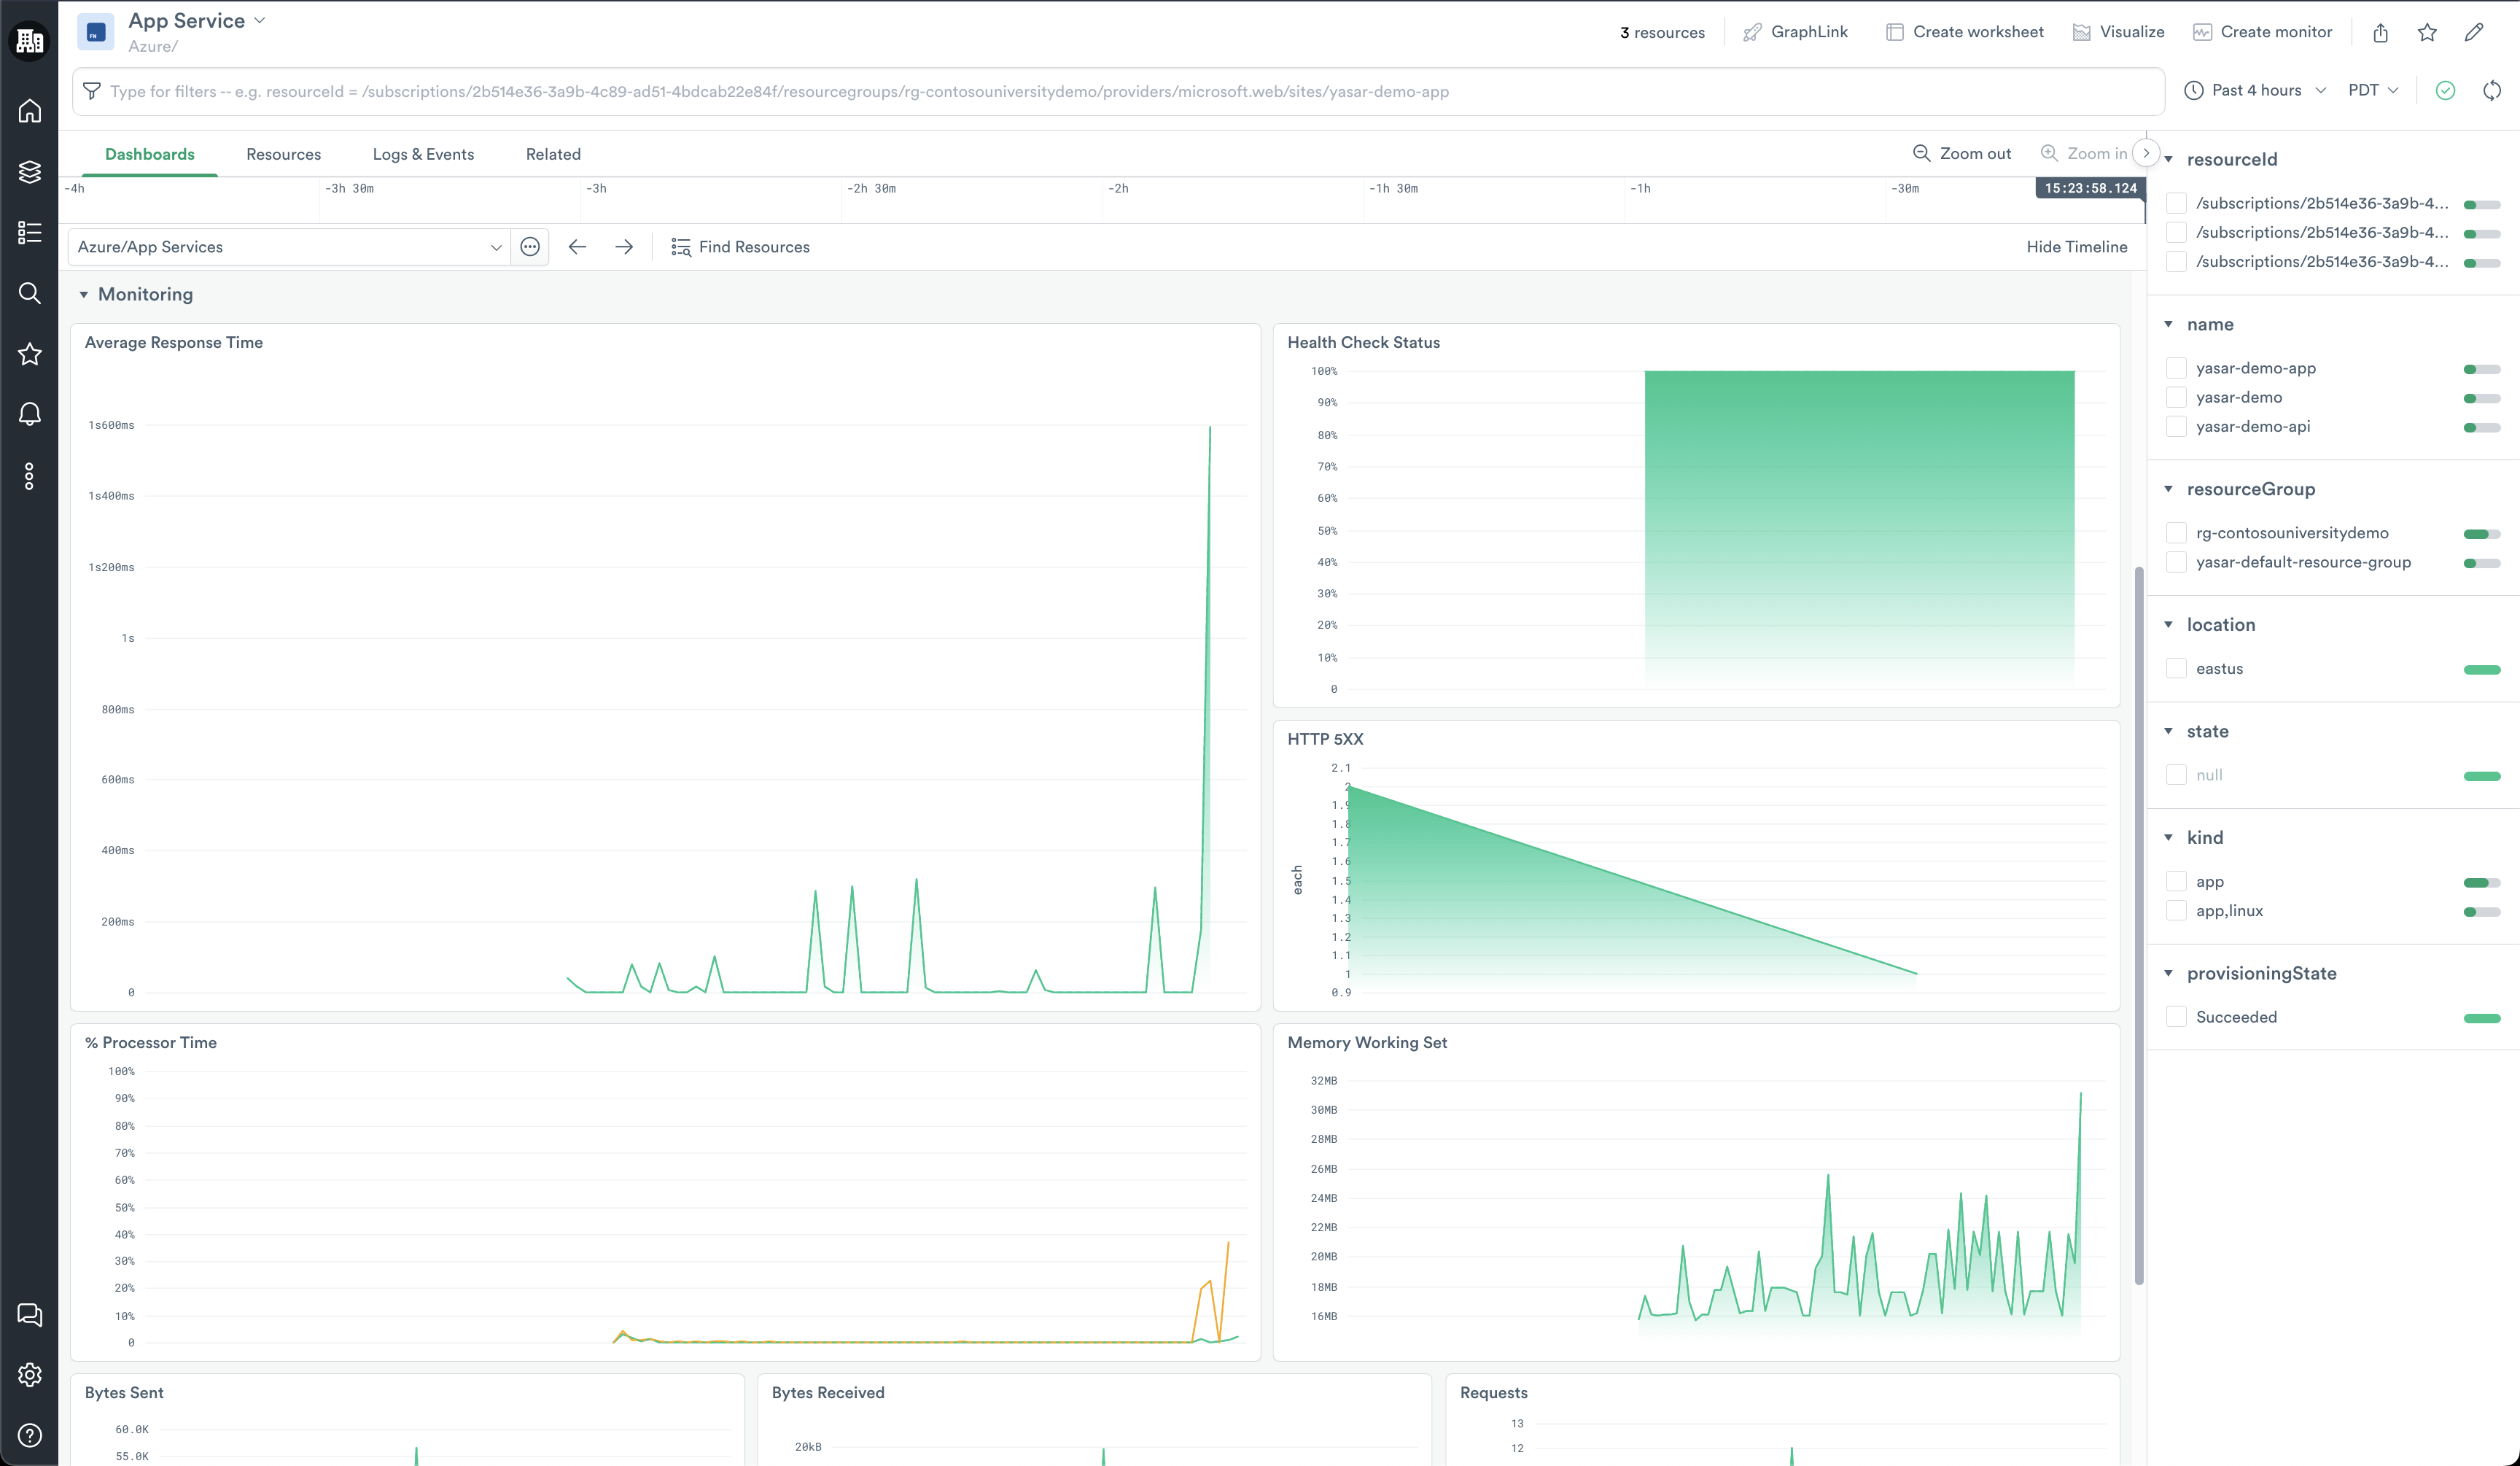
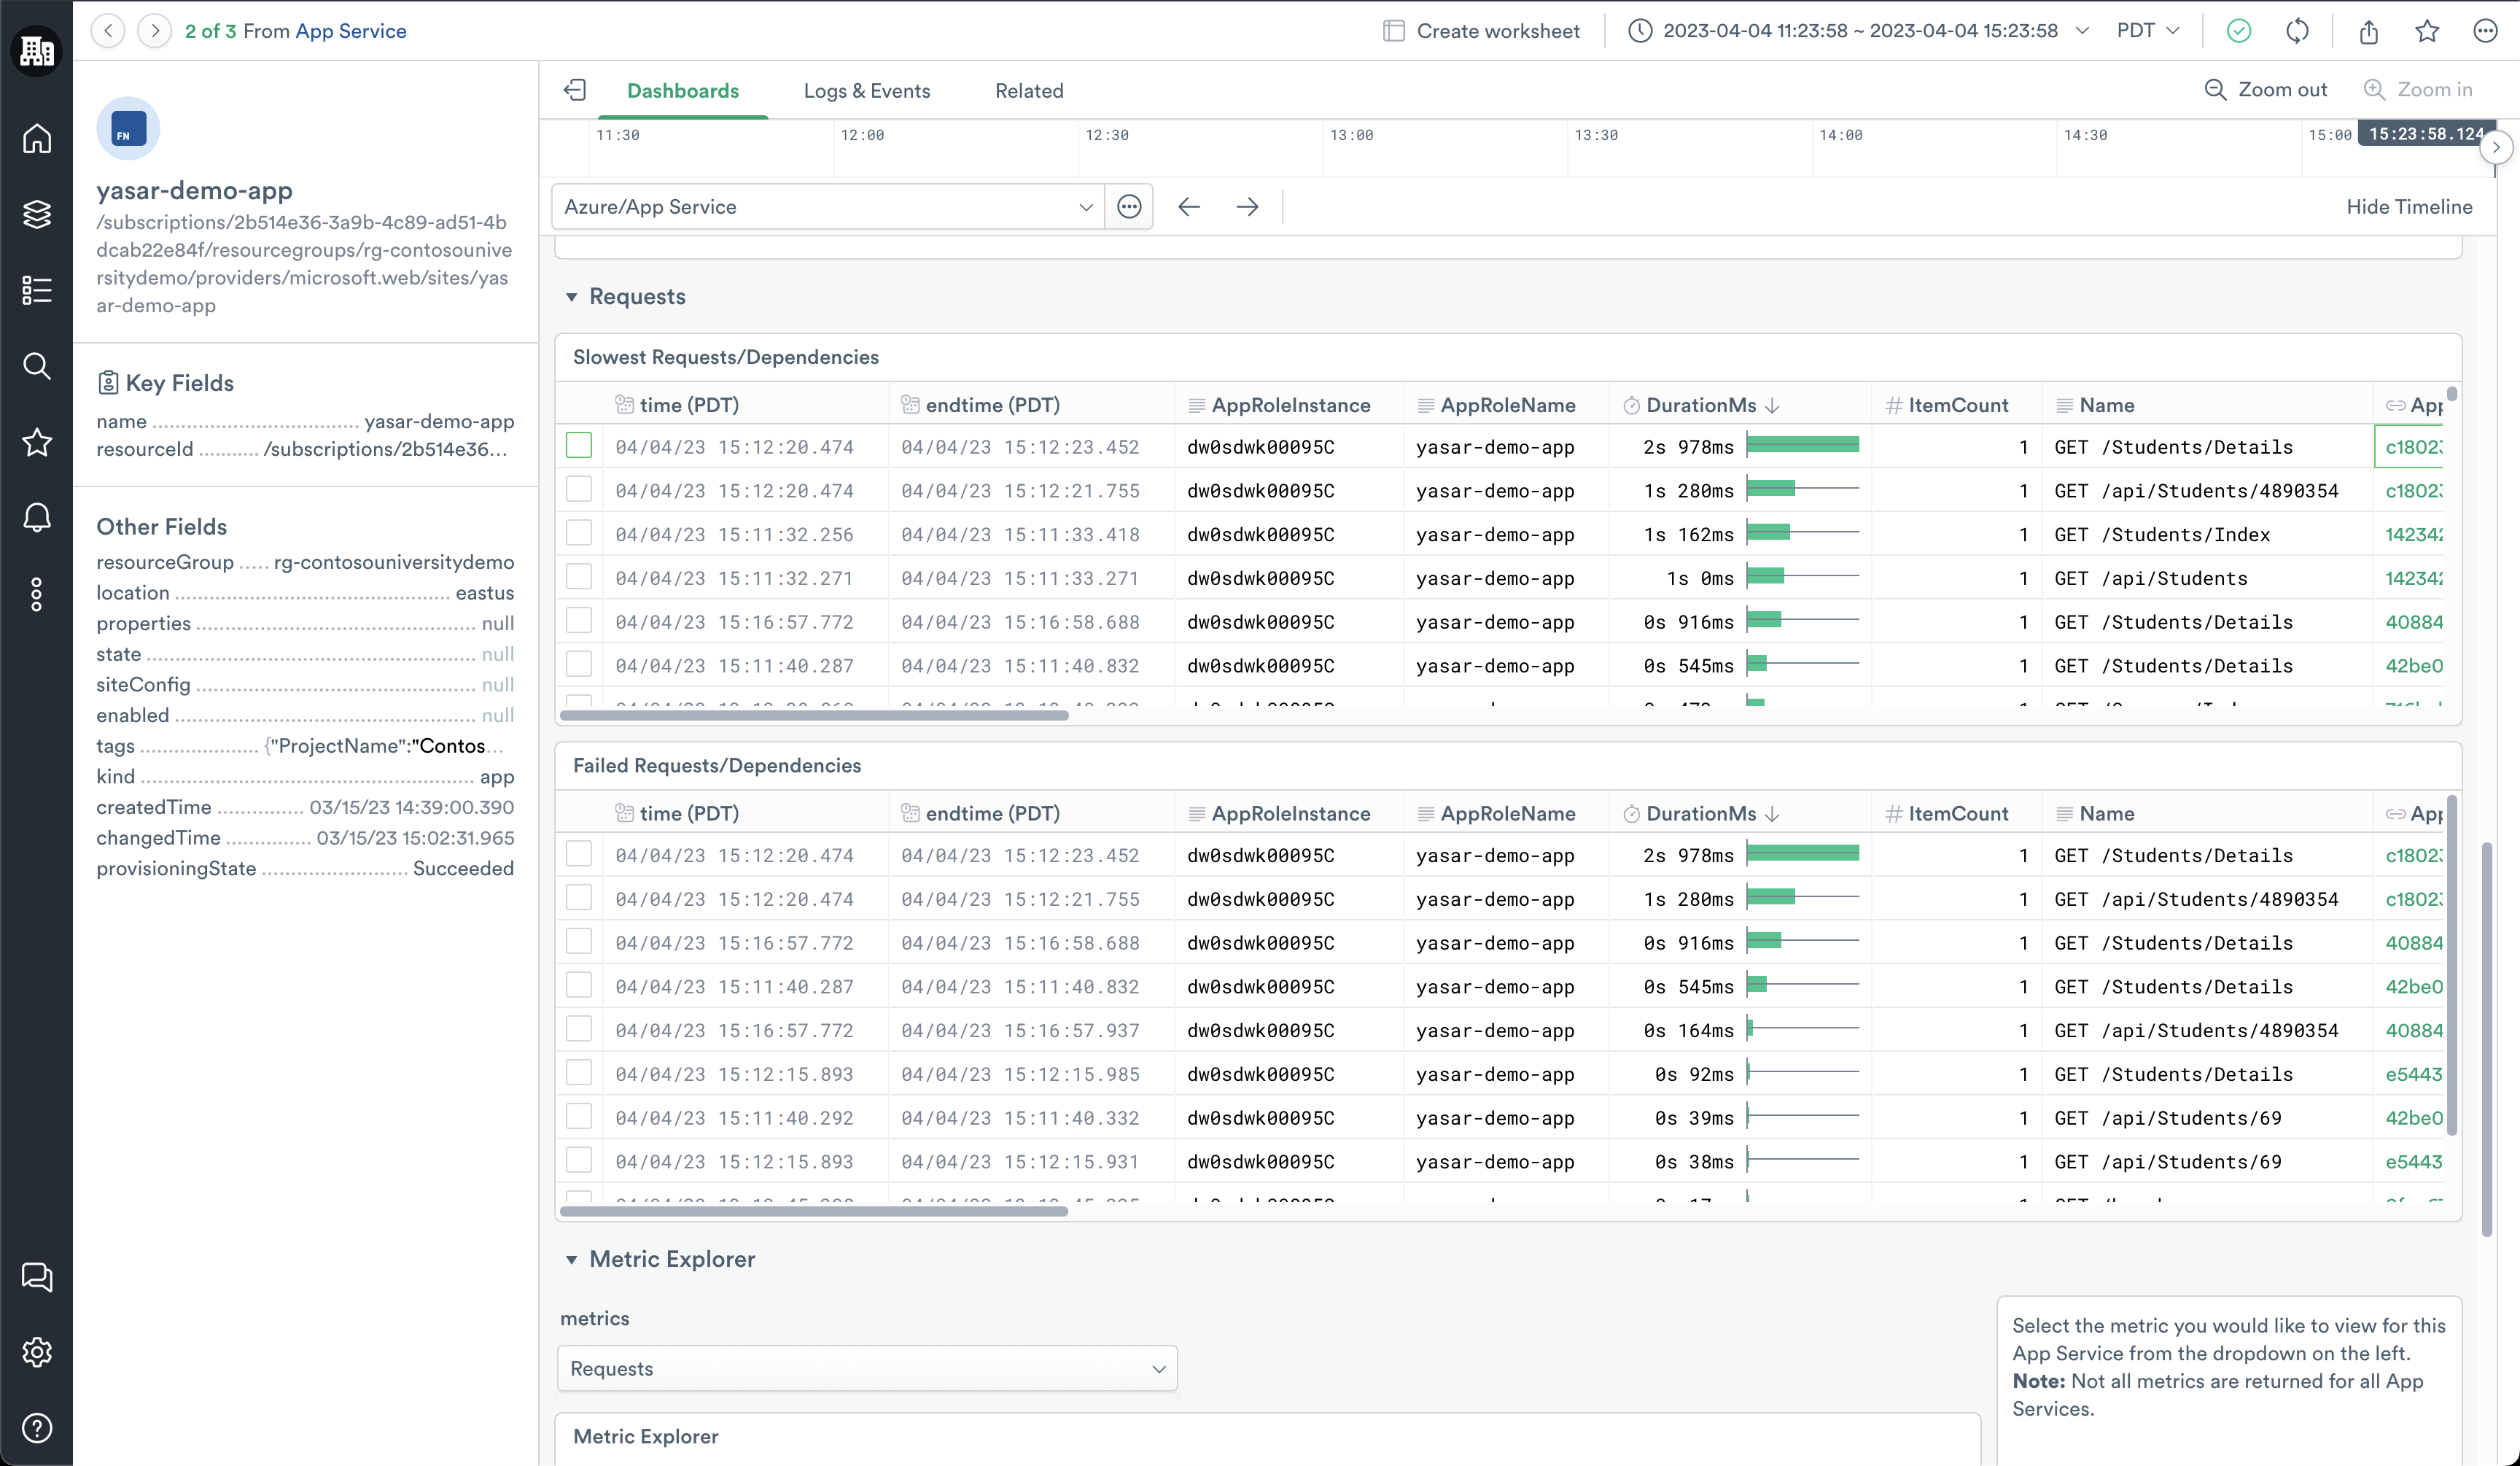
Once you find an Azure App Service of interest, you can select it from the honeycomb at the top of the dashboard and then click Open to go to the instance view of the Azure App Service. Here you can find more detailed information including the following:
- What are my slowest requests or dependencies?
- What requests fail on my app?
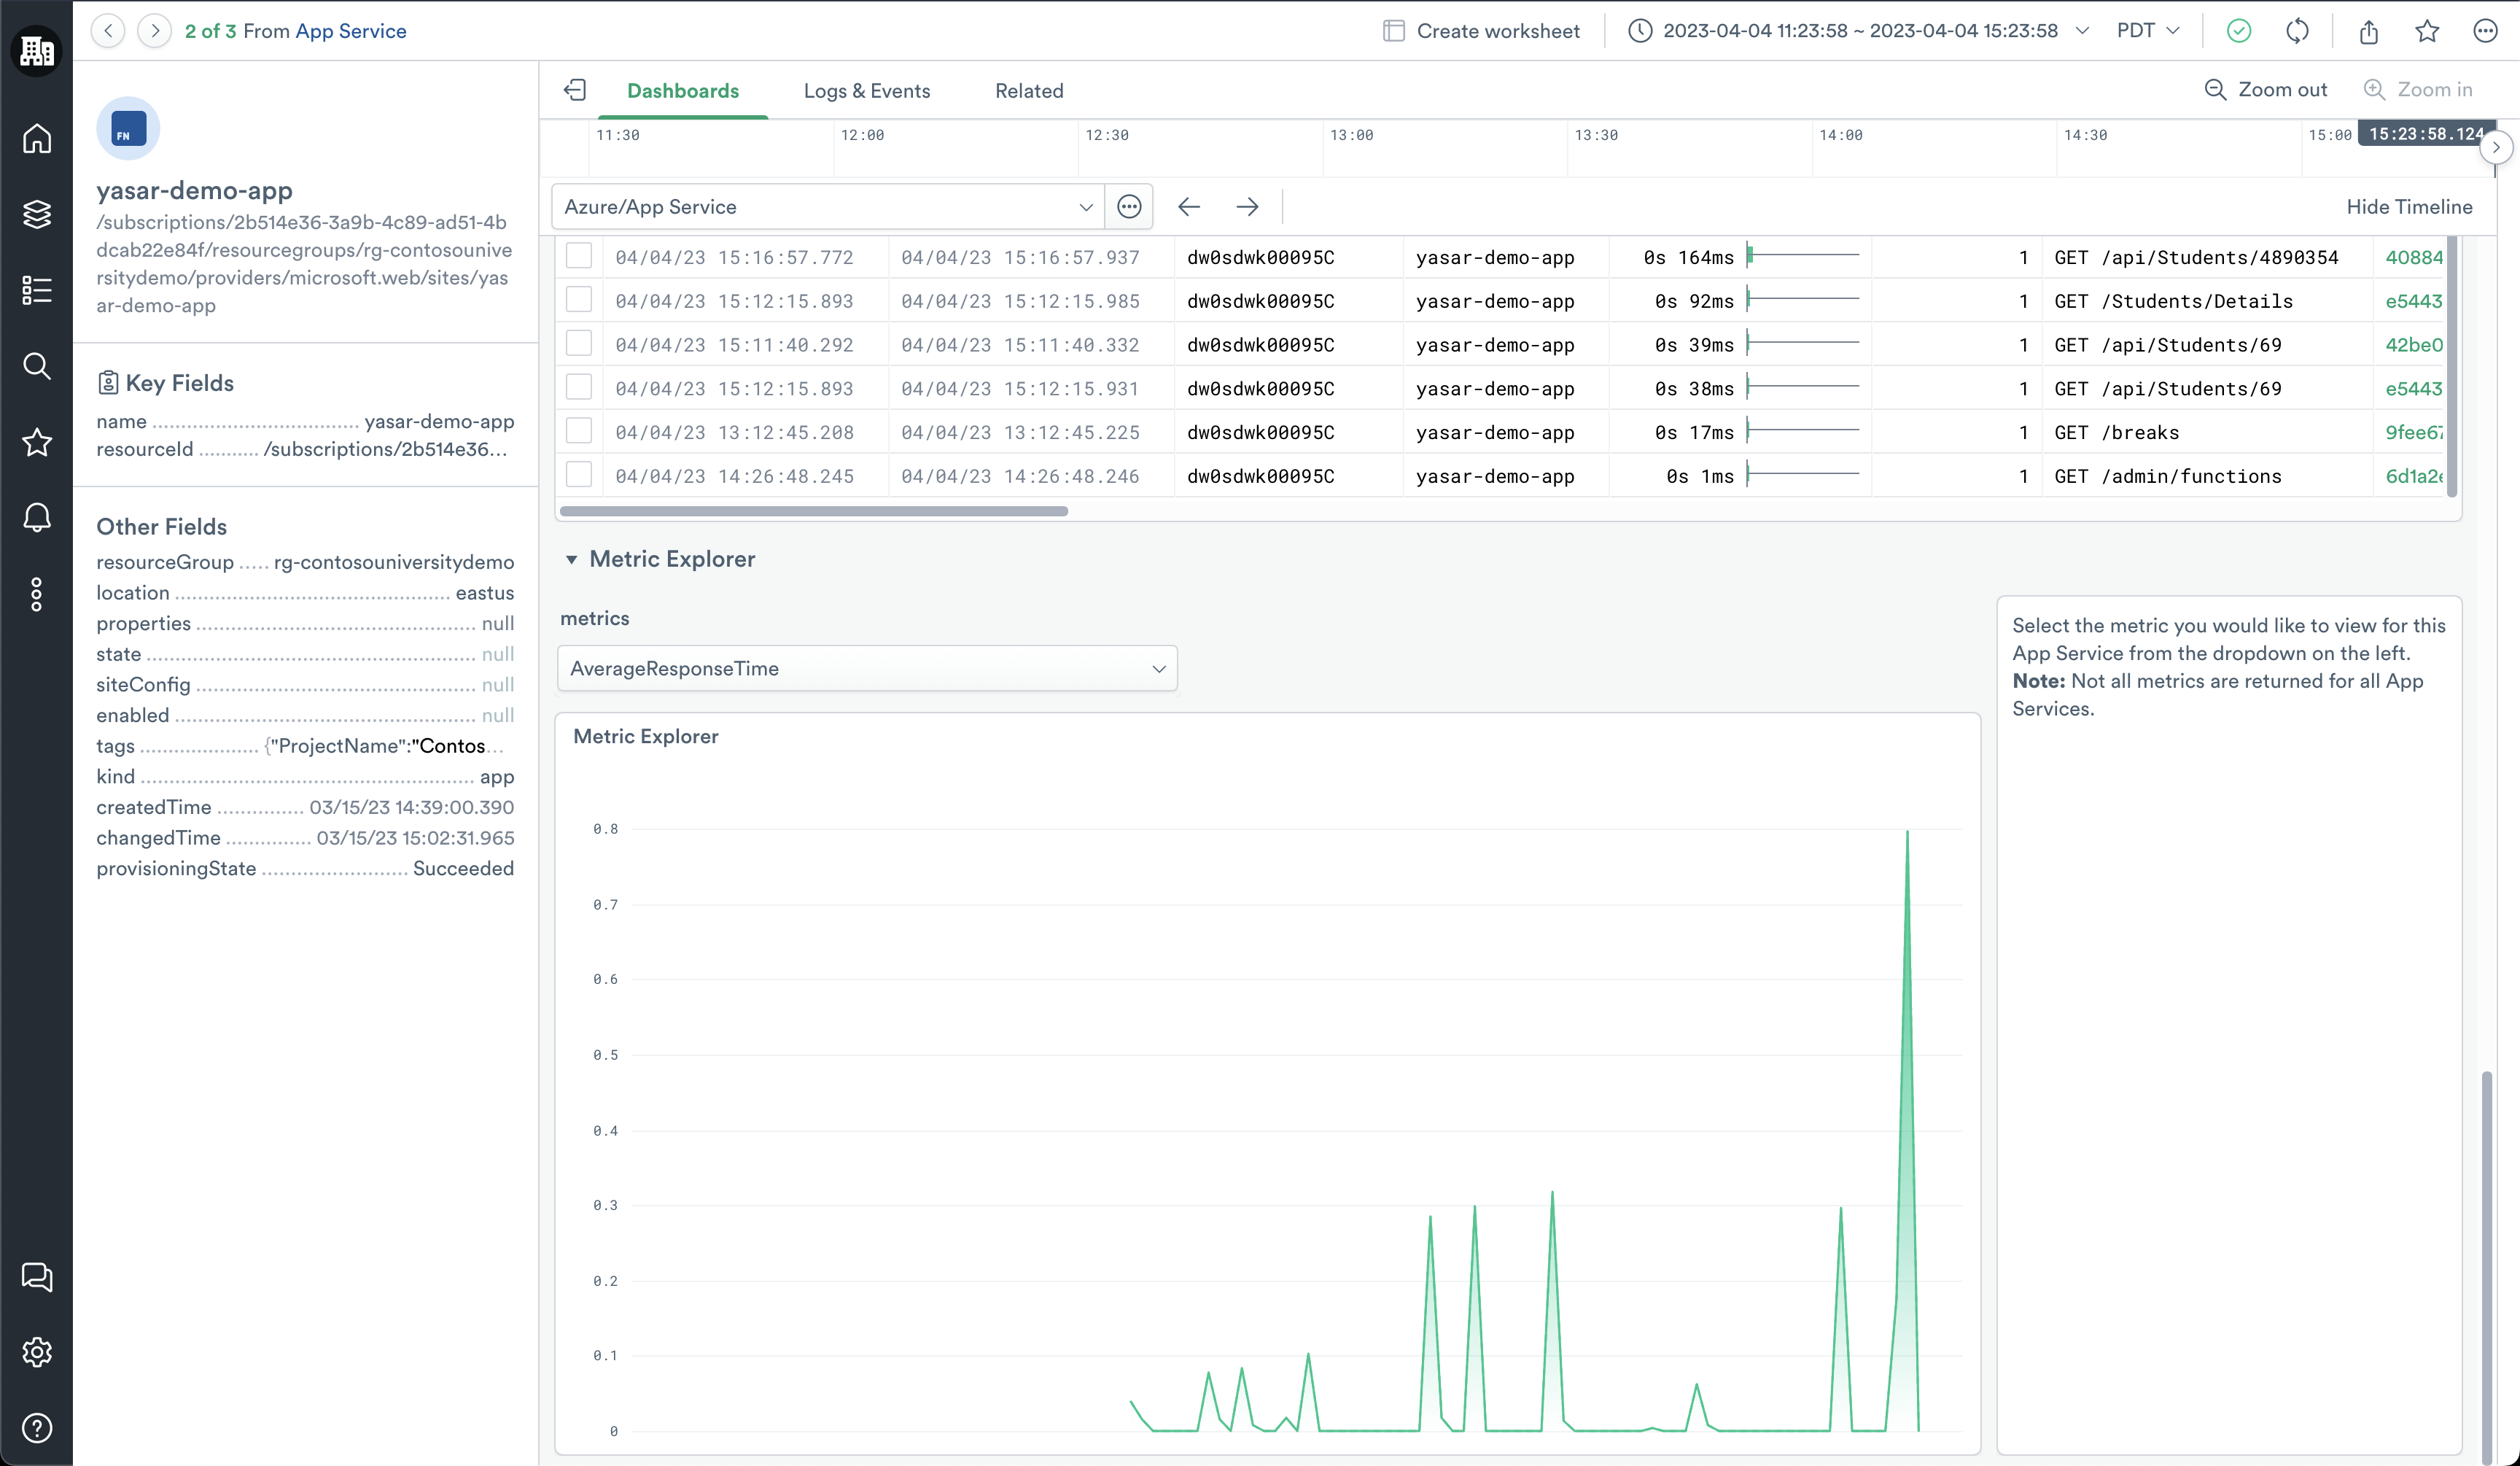
In addition to pre-defined metrics, use the Metrics Explorer graph at the bottom of the dashboard to visualize any metric related to an Azure App Service.
If you find a request that you want to explore further, you can double-click the Azure App Service Operation ID from the table and go to the detailed view of the operation. It provides you with a Gantt view of all of the requests or dependencies that make up the operation as well as any associated events and traces.
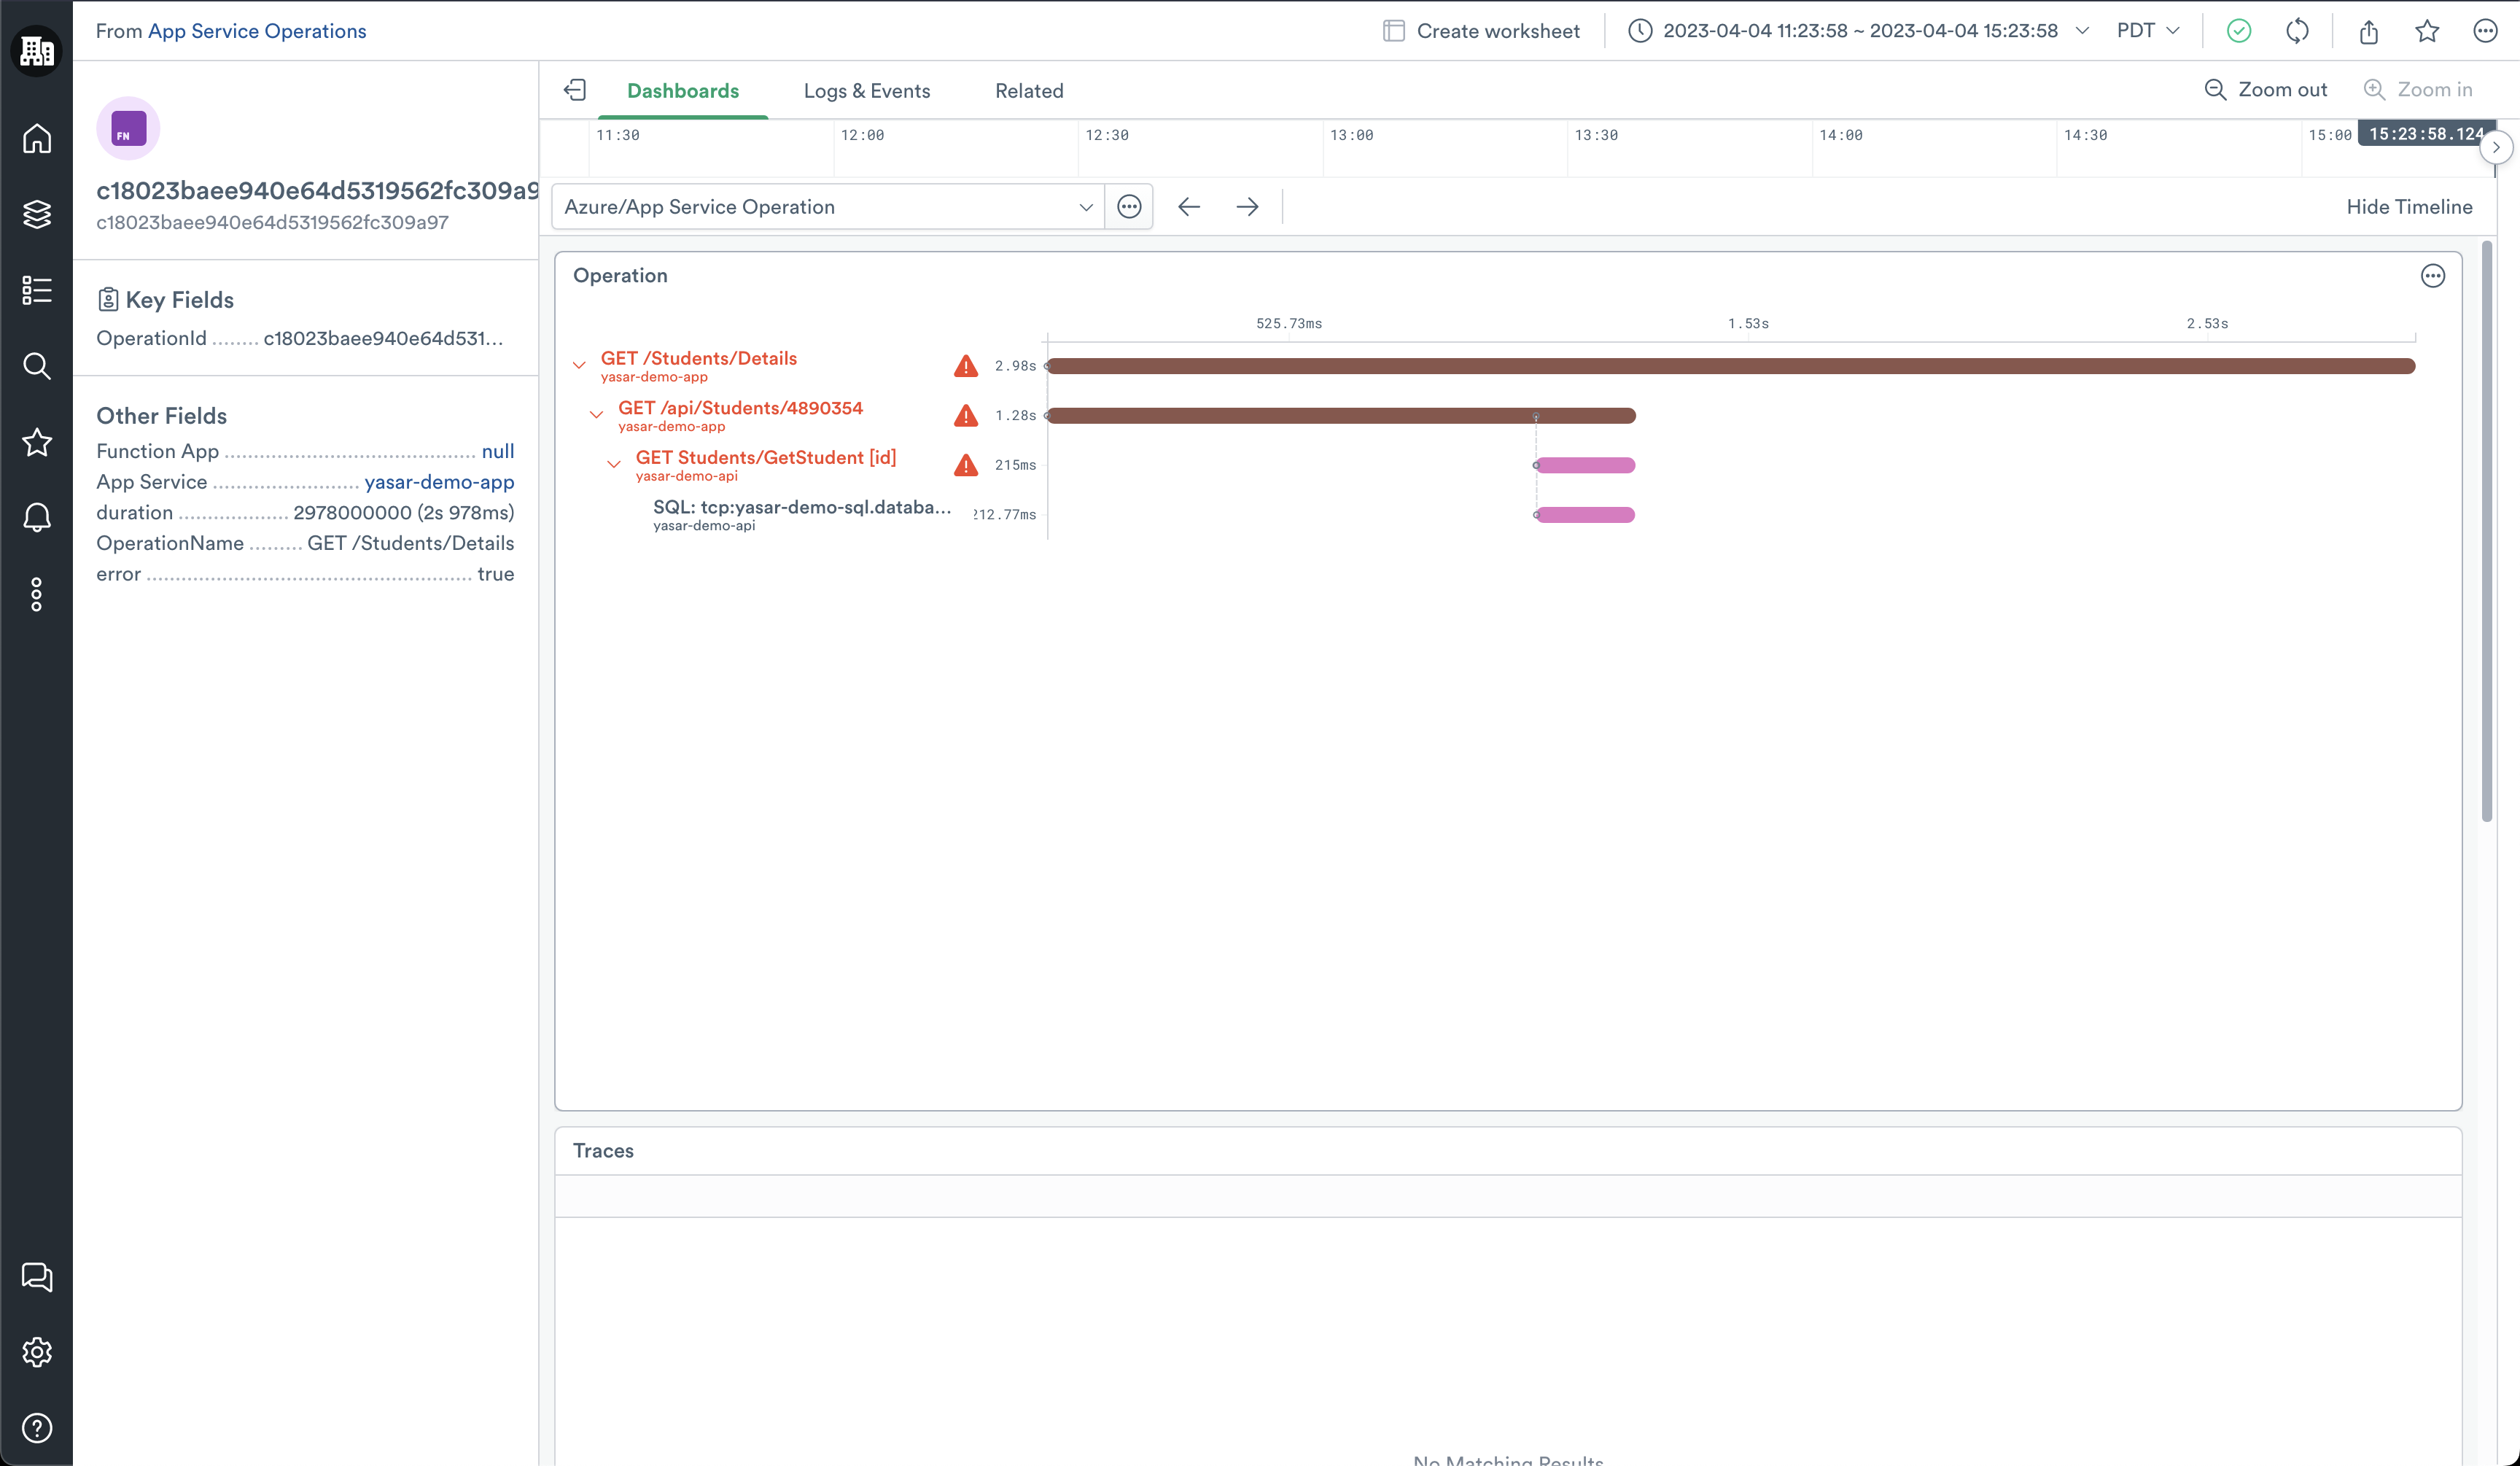
Click on any of the requests or dependencies in the chart to expose a side panel that provides the details related to that request or operation.
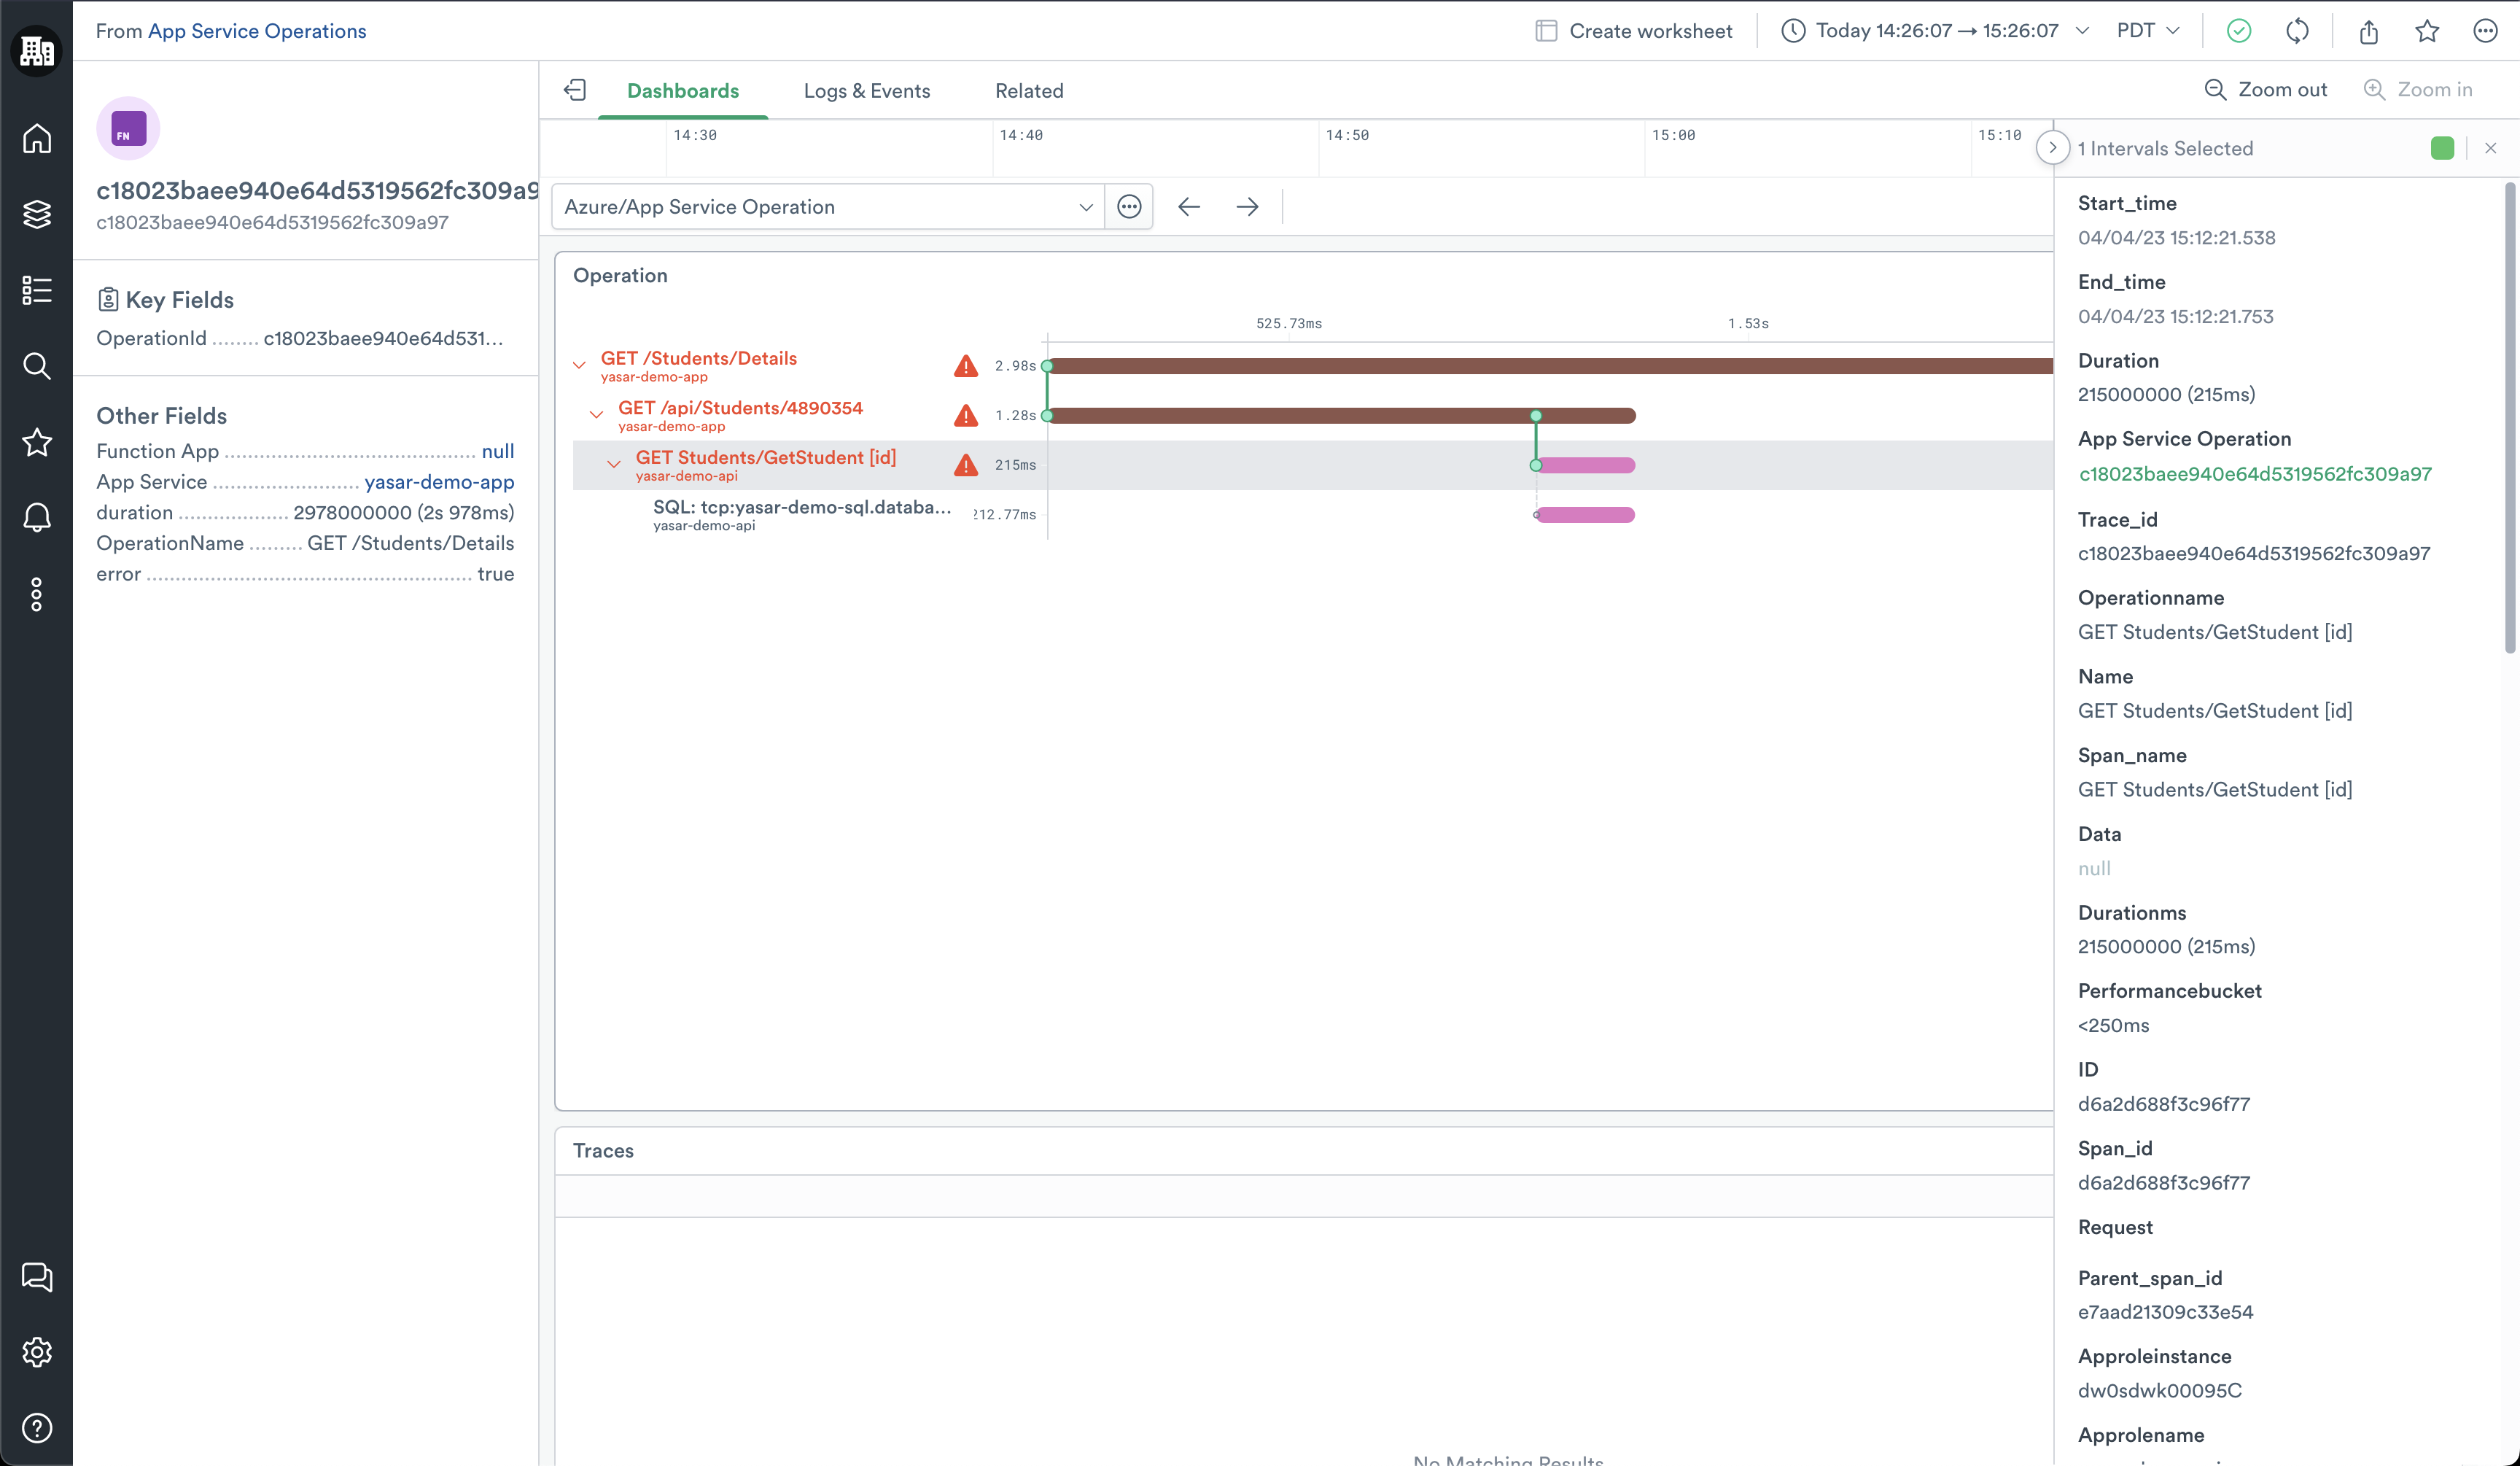
Azure App Service Operations Search dashboard
The Azure App Service Operations Search dashboard provides insights into operations for the Azure Function app. From here, you can collect answers to the following questions:
- What is my average operation duration?
- How many requests is my App receiving?
- How much many errors is my App generating?
- What are my slowest operations?
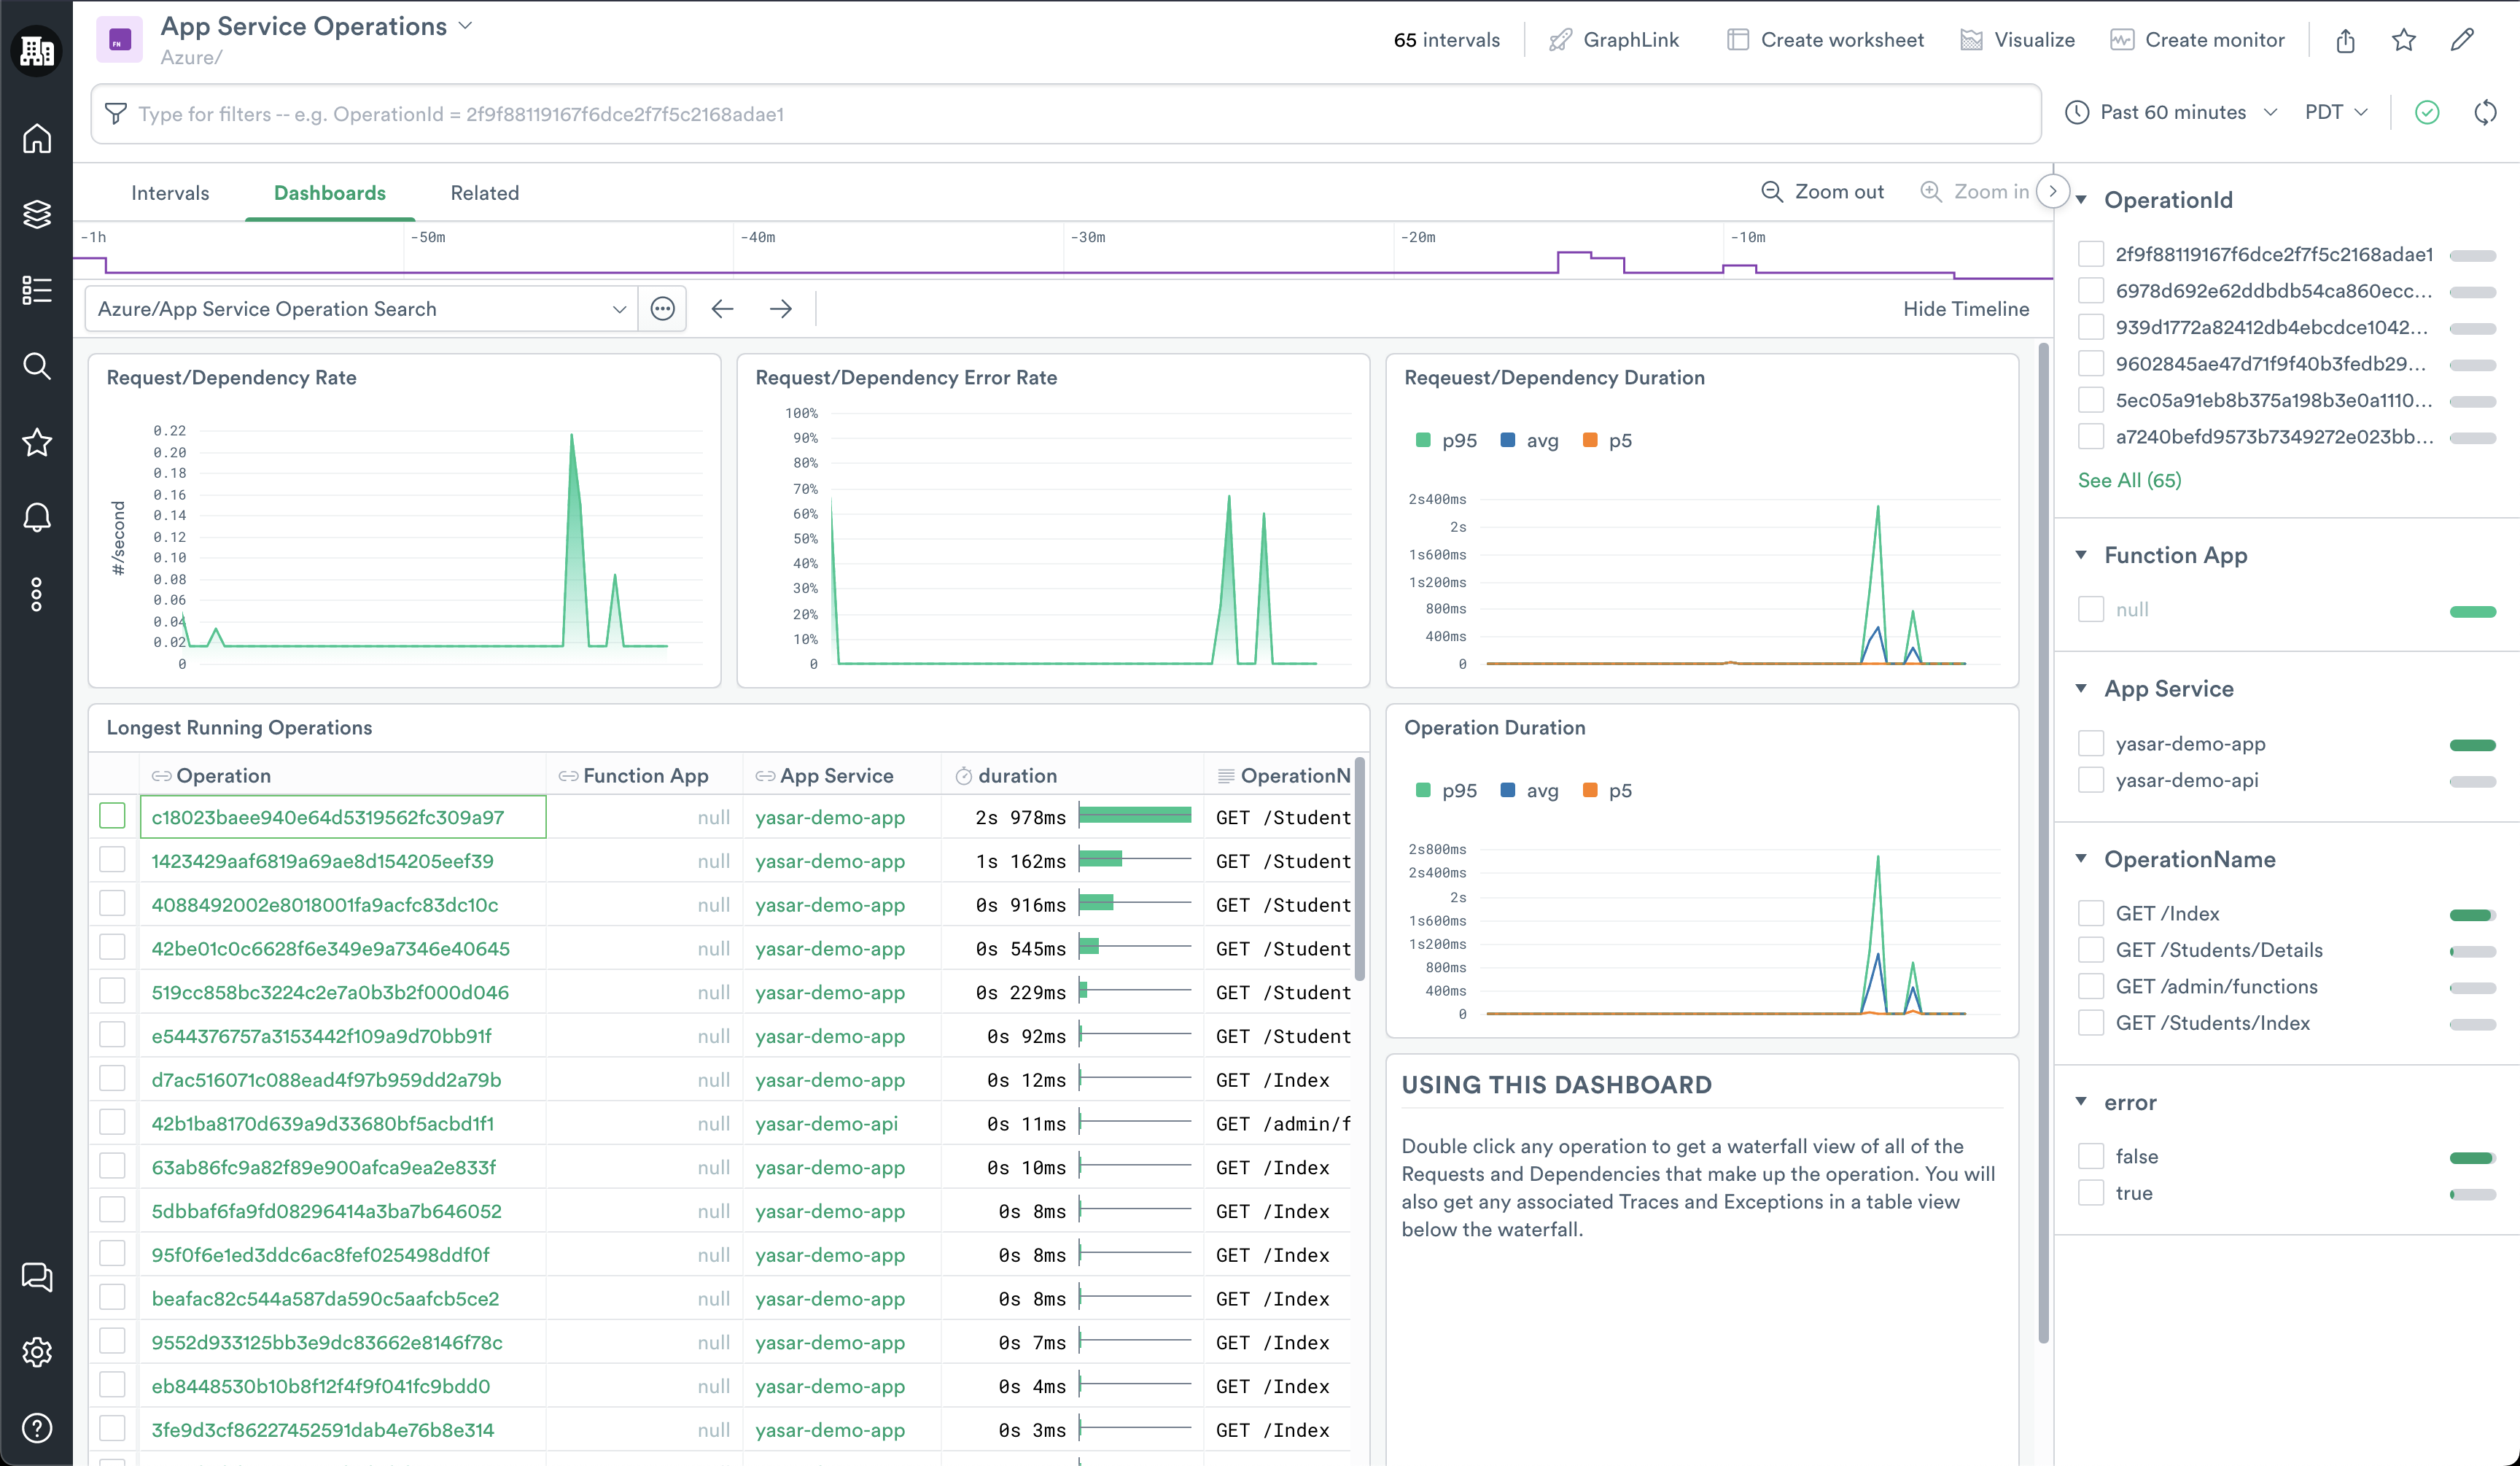
If you find a request you want to explore further, you can double-click the Azure App Service Operation ID from the table and go to the detailed view of the operation. It provides you with a Gantt view of all of the requests or dependencies that make up the operation as well as any associated events and traces.

Clicking any of the requests or dependencies in the chart exposes a side panel that provides all of the details related to that request or operation.

Installing the Azure Functions App
To install the Azure App Services app, see Install and configure the Microsoft Azure app.
Azure Functions Metrics
To learn more about Azure Functions Metrics, see Monitoring Azure App Services data reference in the Microsoft documentation.
Updated 2 months ago