Azure SQL Database
Azure SQL Database is an always-up-to-date, fully managed relational database service built for the cloud. With the Observe Azure SQL Database integration, you can gain valuable insights into your database performance. You can monitor one or more Azure SQL databases with the SQL Database app.
Installed Datasets
The following Datasets are installed for Azure SQL Database:
- SQL Database
- SQL Database Audit Logs
- SQL Database Deadlocks
- SQL Database Error Logs
- SQL Database Logs
- SQL Database Metrics
- SQL Database Query Logs
- SQL Database Query Store Runtime Metrics
- SQL Database Timeouts
- SQL Database Wait Statistics
- SQL Server
Azure SQL Database Monitor templates
- Azure SQL Database Serverless Memory less than 20% - This monitor alerts if memory drops below a given threshold for any serverless SQL database.
- Azure SQL Database Storage Space Used greater than 80% - This monitor alerts, if storage space used exceeds a given threshold (default 80%).
- Azure SQL Database Serverless CPU Threshold - This monitor alerts on CPU usage above a given threshold for any serverless SQL Database.
- Azure SQL Database CPU Threshold - This monitor alerts on CPU usage above a given threshold.
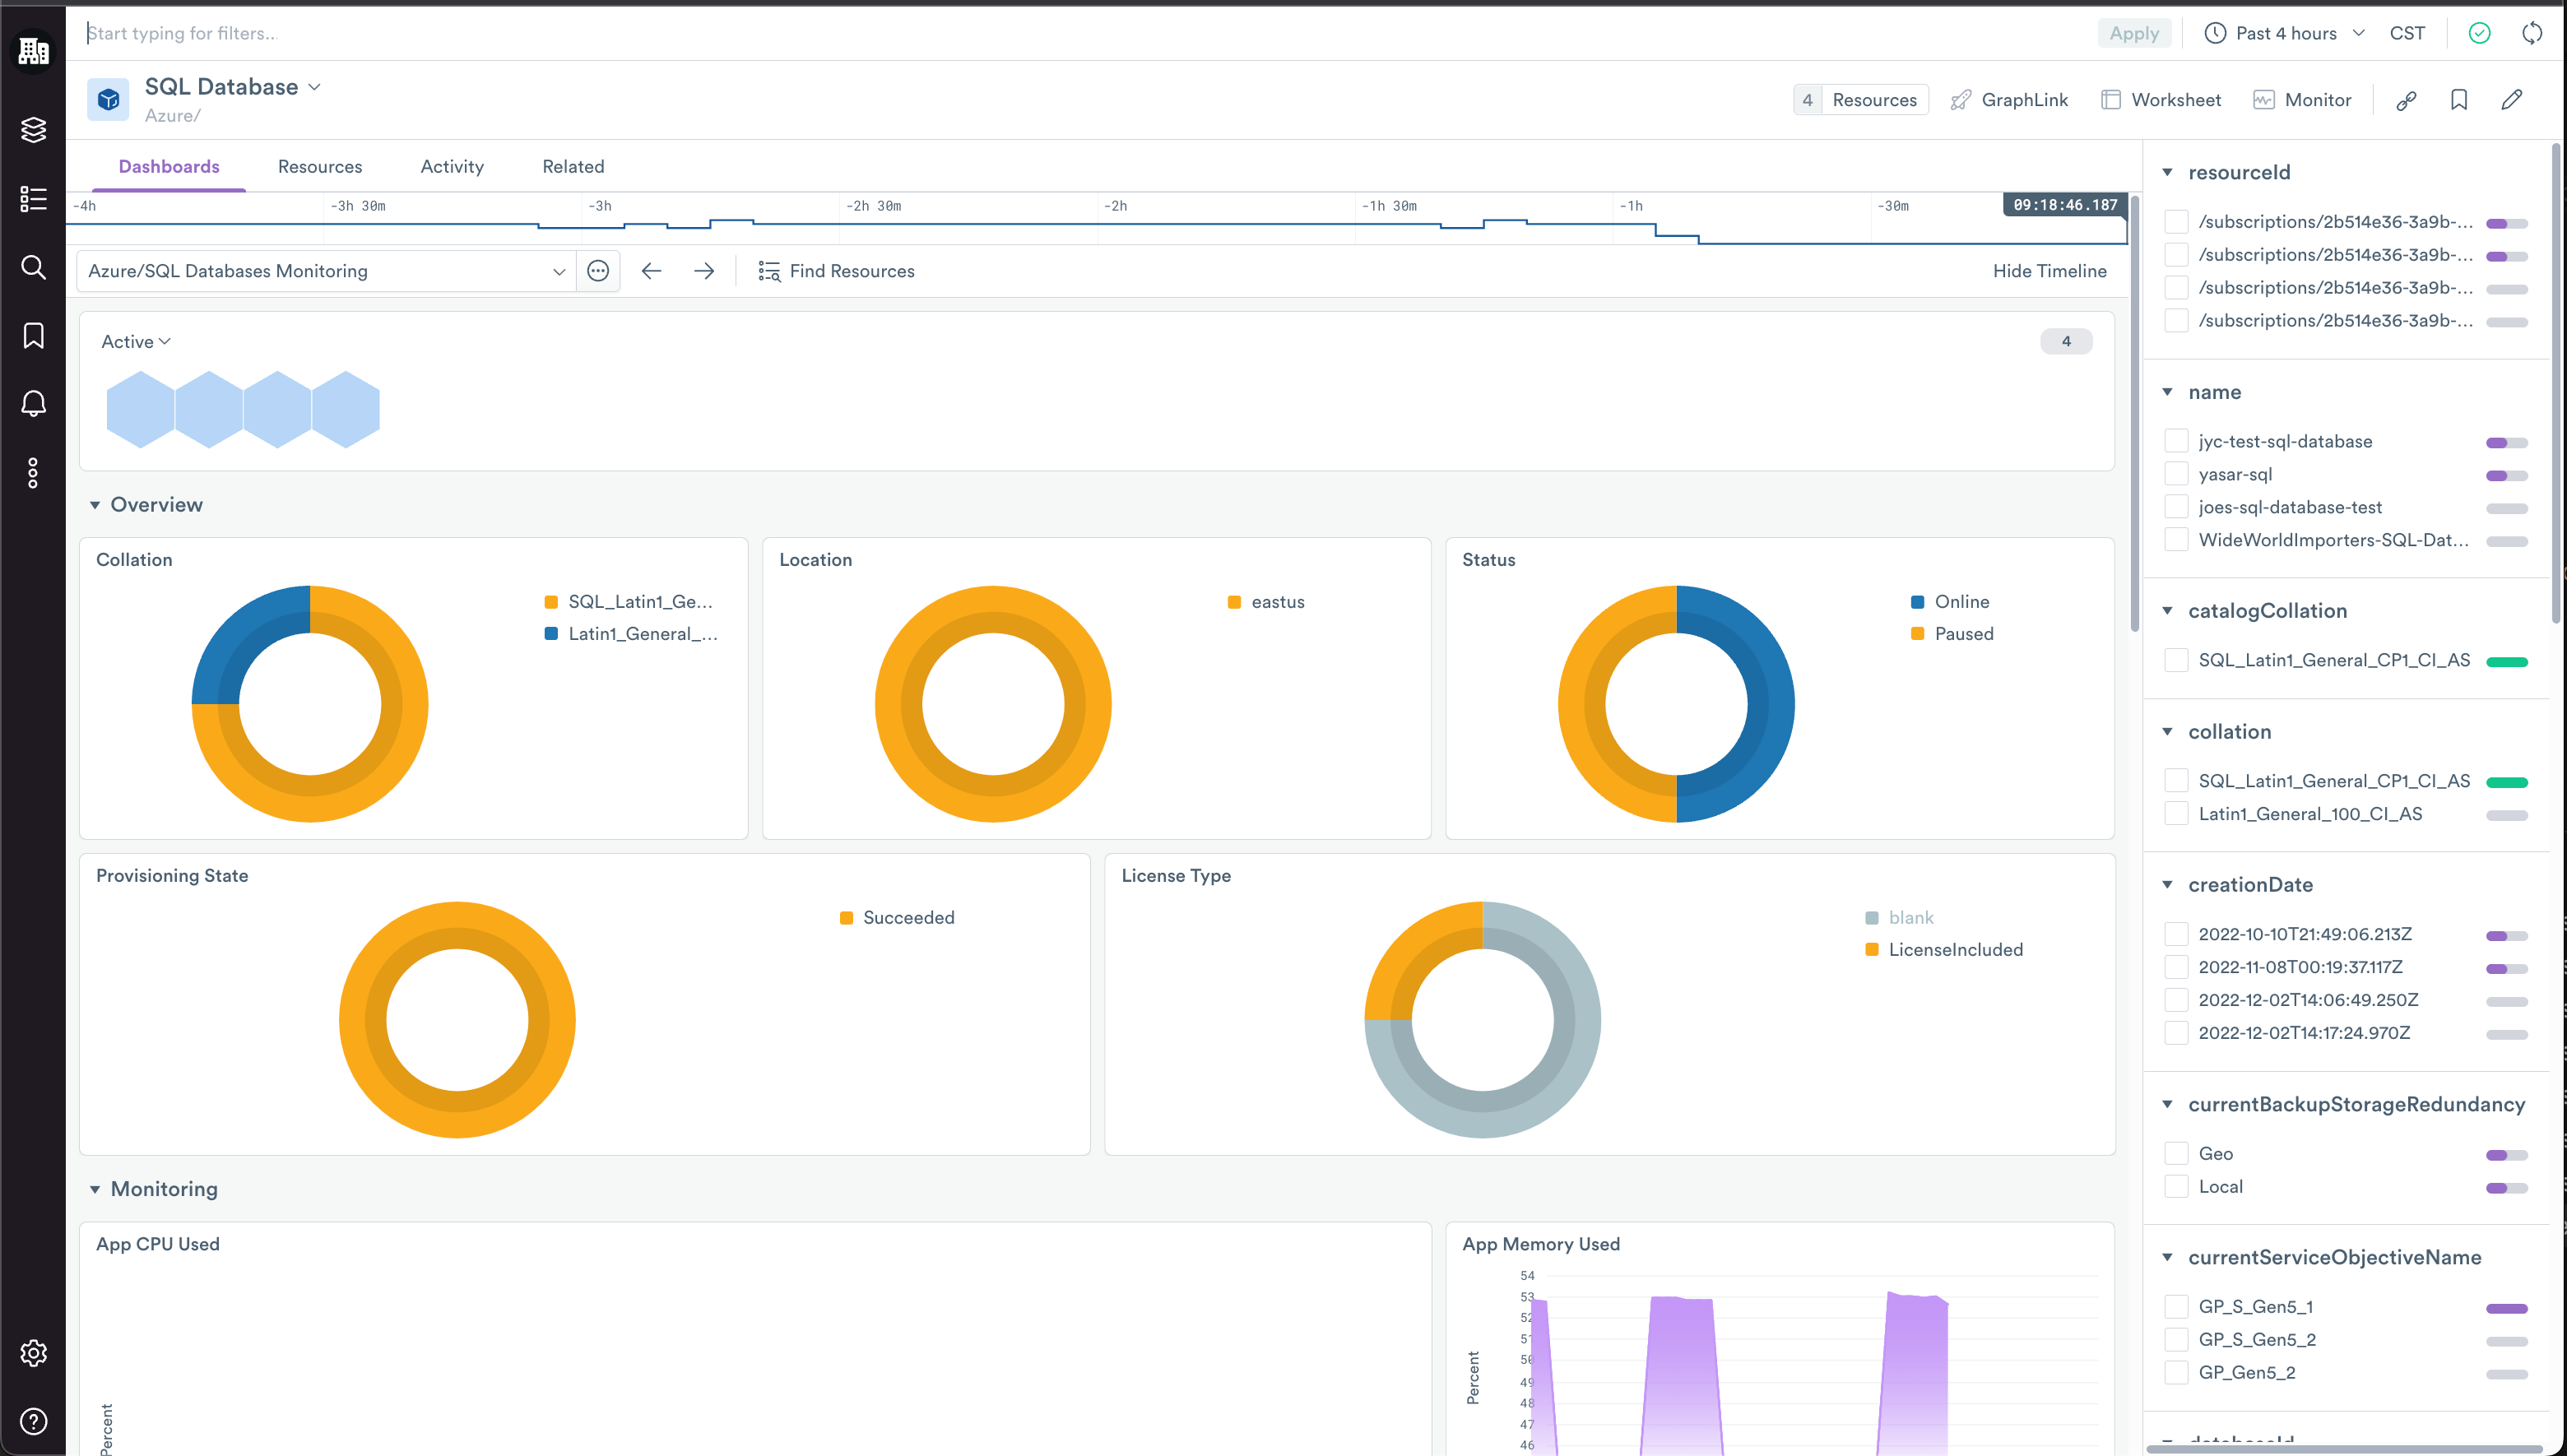
View an Azure SQL Database in Observe
The SQL Databases Monitoring dashboard, included in the SQL Database resource dataset, helps you answer the following questions:
- What resources are my databases using (CPU, memory, storage)?
- How many workers are my databases using?
- Do my SQL Databases have any timeouts or deadlocks?
- How long is my average query duration?
Once you've found a database of interest, you can click on the name of the database, and click Open from the right menu. This takes you to the SQL Database Monitoring dashboard for that database. This dashboard includes more detailed information including:
- Database Connections
- More detailed resource usage
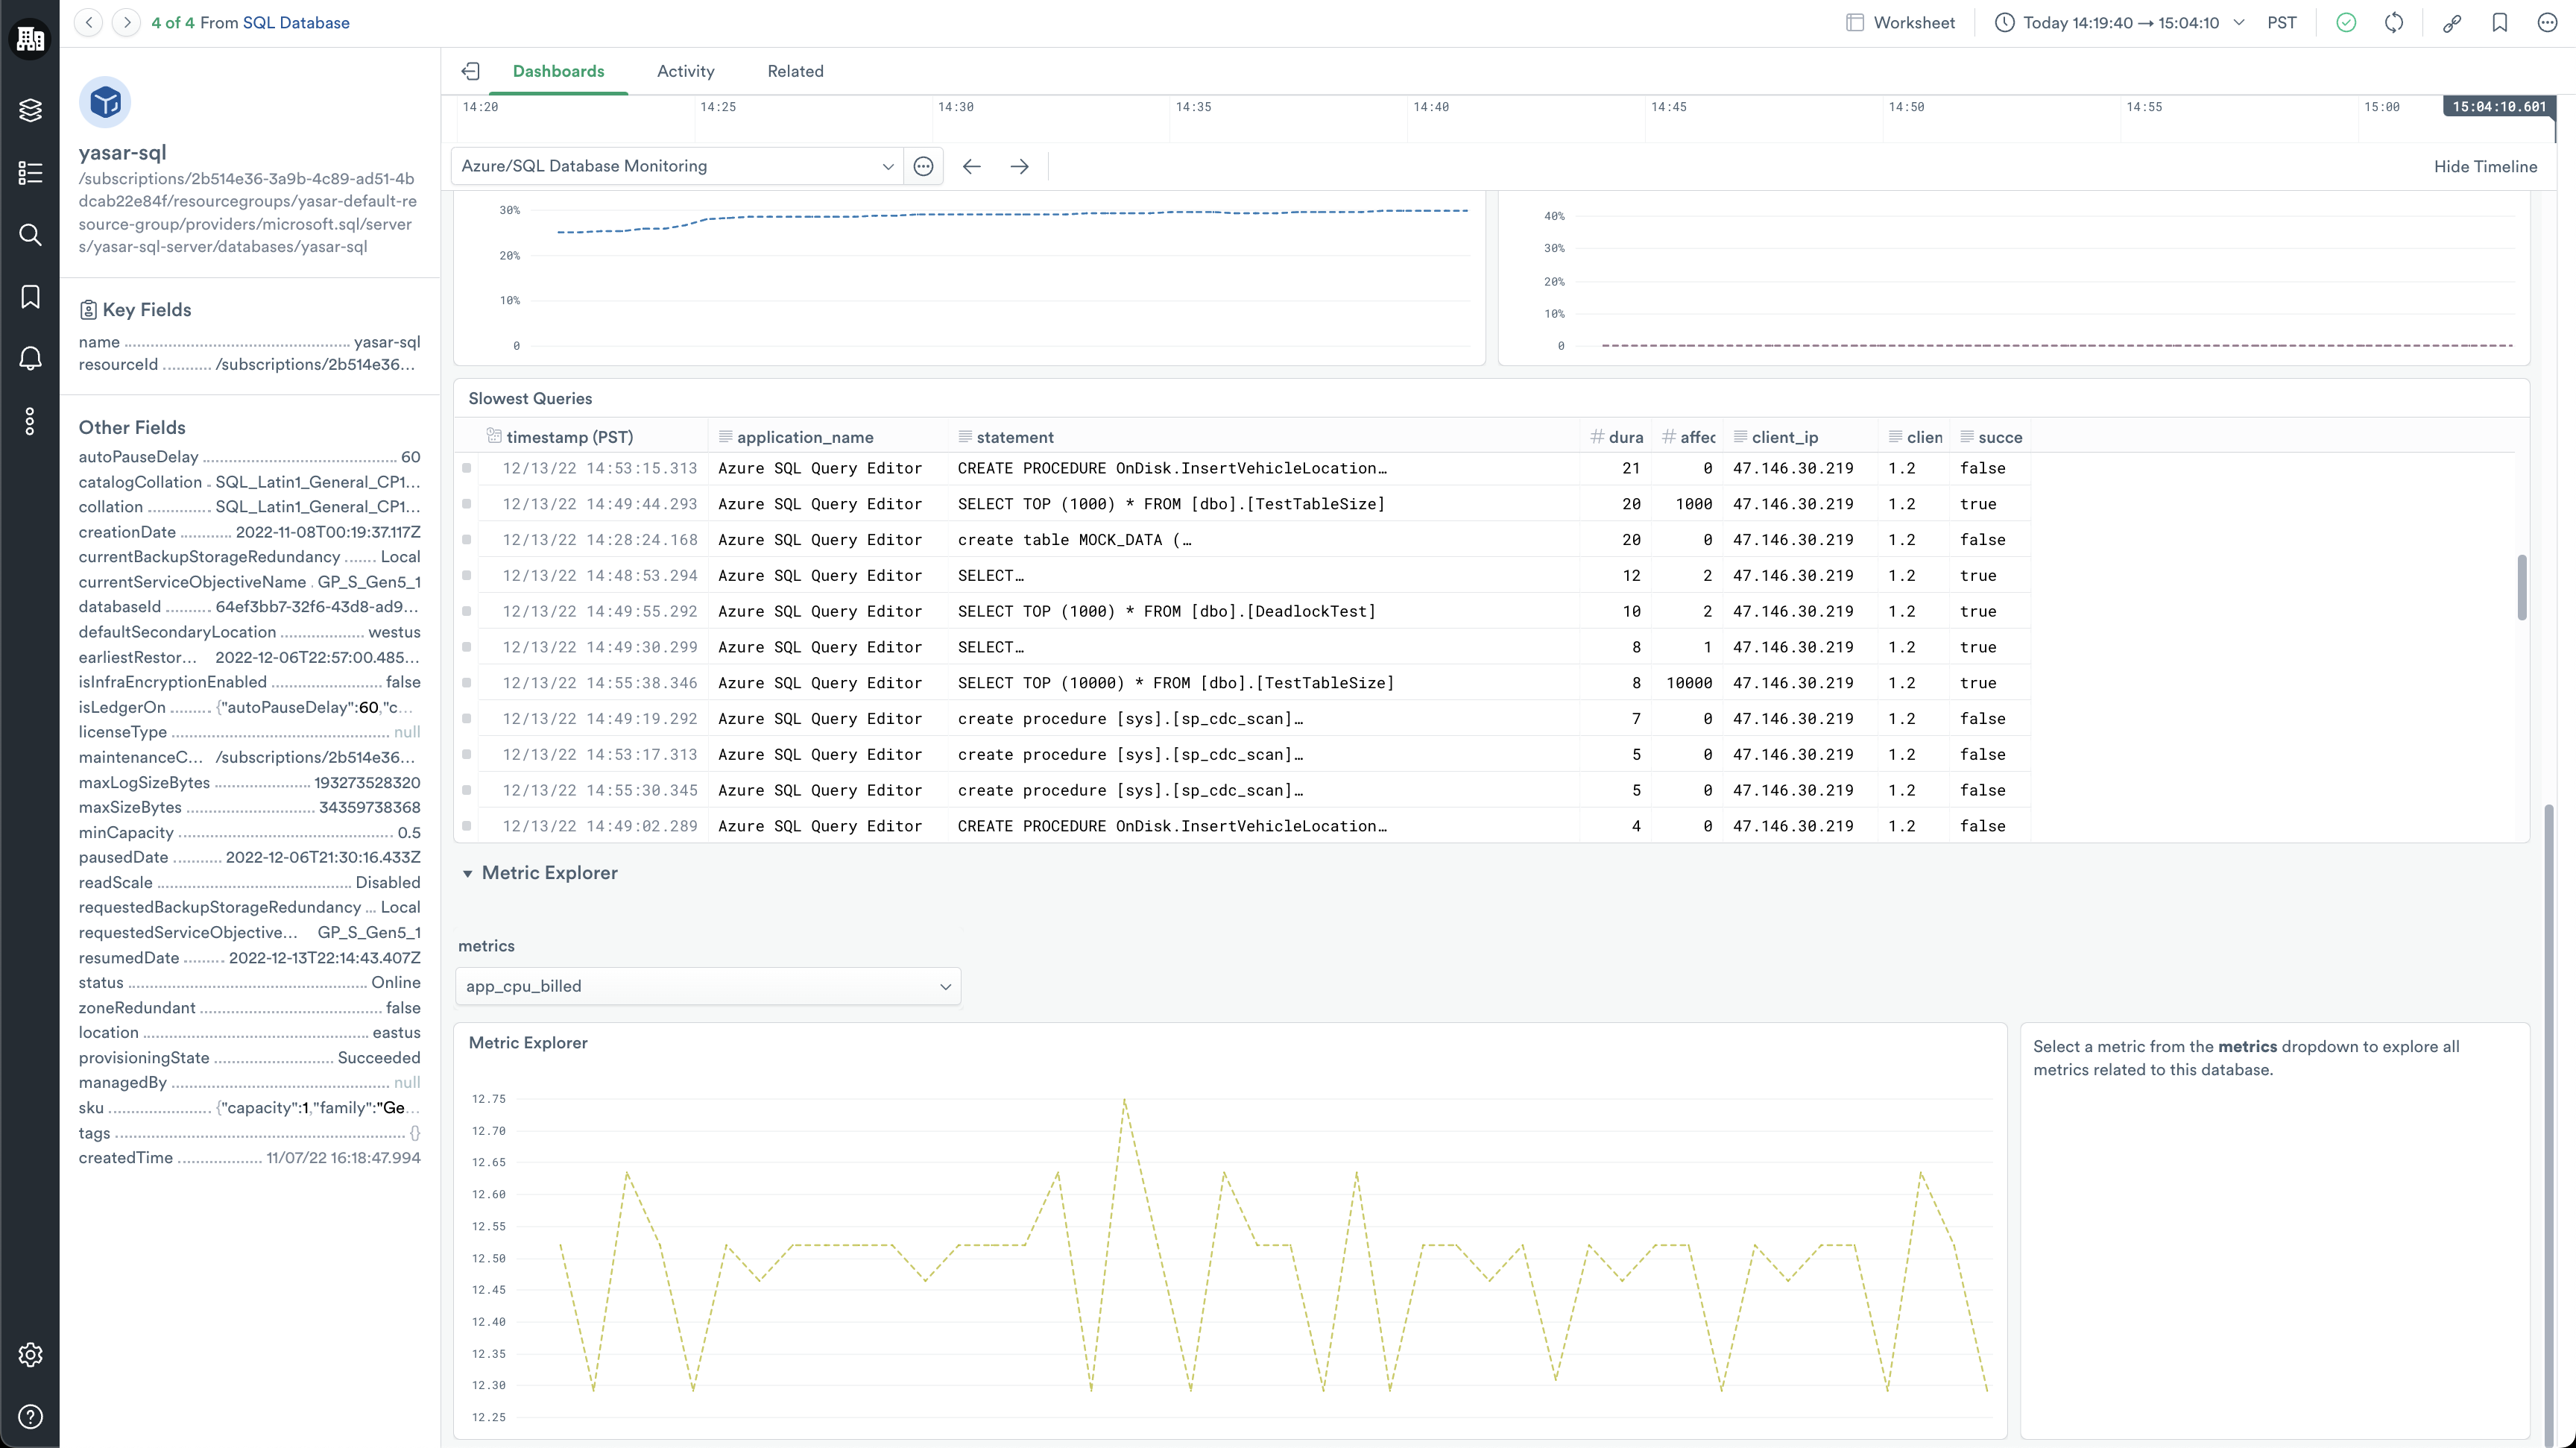
- A table of queries sorted by query length to troubleshoot slow queries
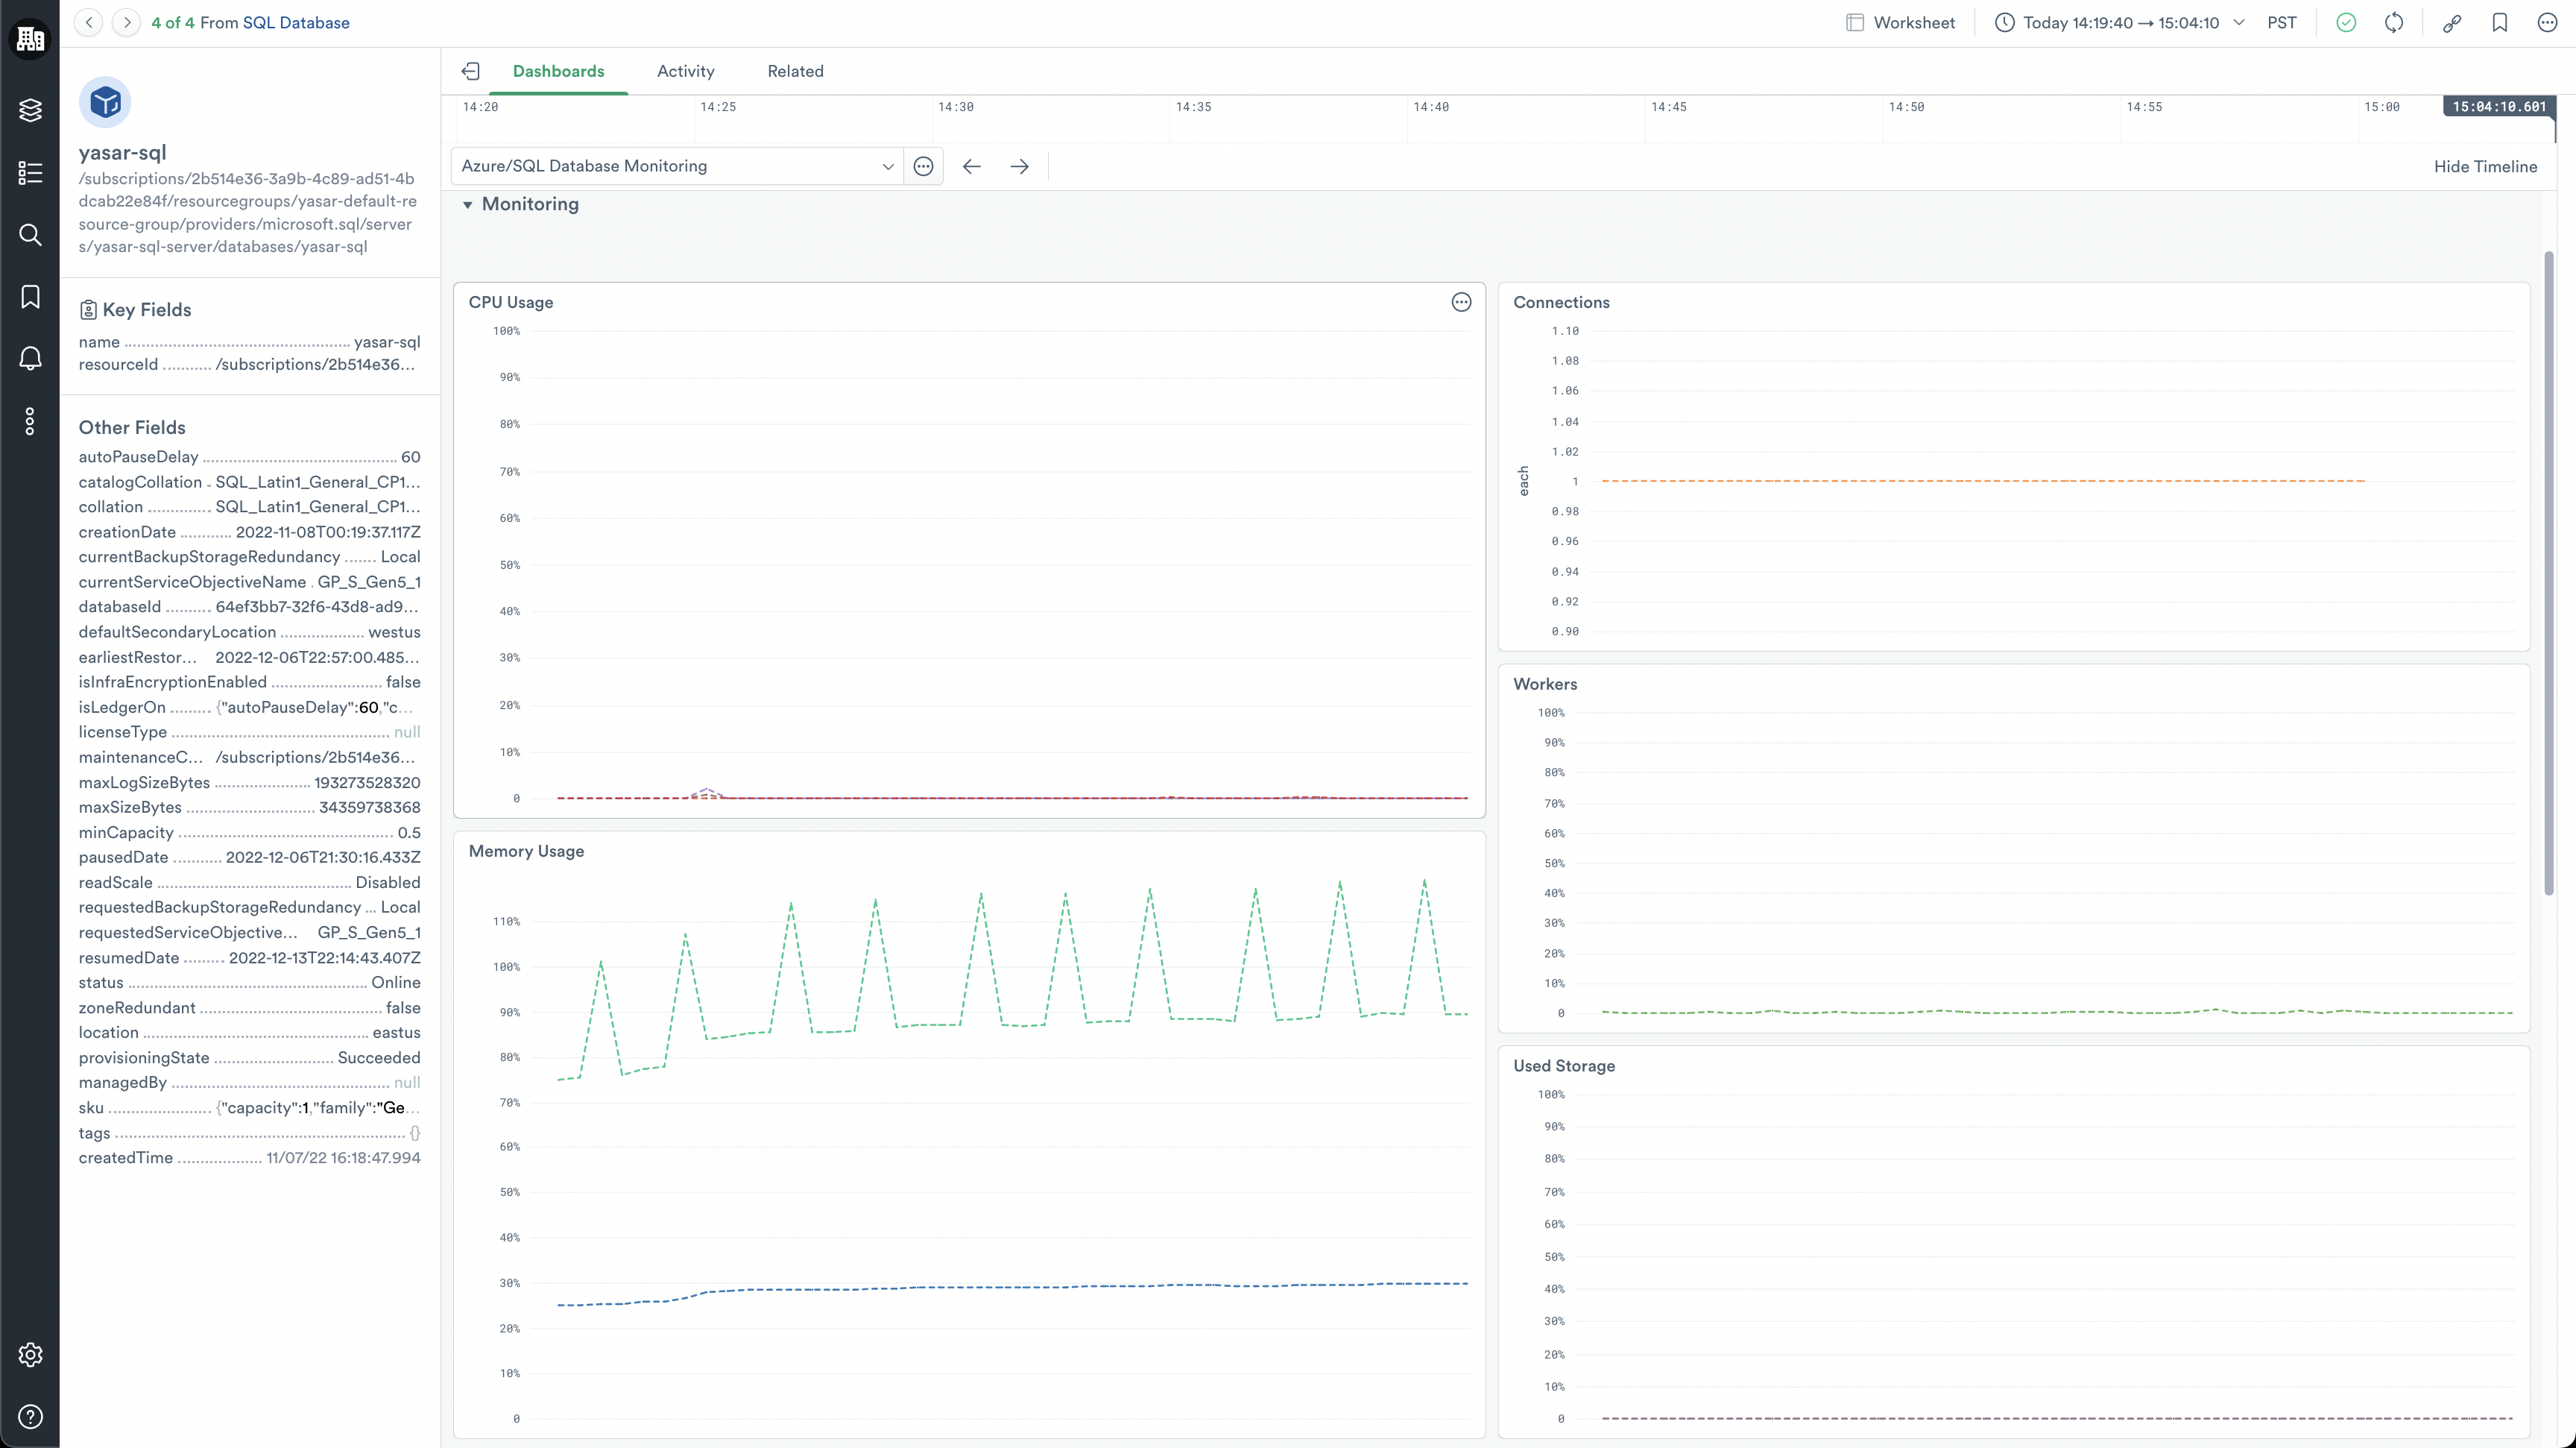
The instance dashboard also includes a Metrics Explorer dashboard that allows you to explore any metric that applies to your database.
Installing the Azure SQL Database app
To install the Azure SQL Database app, see Install and configure the Microsoft Azure app.
Azure SQL Database Metrics
To learn more about Azure SQL Database Metrics, see Monitoring and performance tuning in Azure SQL Database and Azure SQL Managed Instance in the Microsoft documentation.
Updated 6 months ago