Create and share dashboards
Dashboards are a convenient way to visualize important data in one place. Observe provides a quick and easy method of creating Dashboards from your datasets.
Dashboard listing
Logging into Observe, and clicking Dashboards, displays a list of all available Dashboards on your instance. Recently viewed dashboards are listed at the top, and common filters are on the left. In the Search bar, you can enter filters to narrow your search to a specific dashboard or dashboards.
Create a new dashboard
There are several ways to create a new dashboard:
- Use the New dashboard button on the Listing page
- Duplicate an existing dashboard
- Open an existing dashboard and click Save as New
- From a Worksheet or Explorer, use Add to Dashboard and select New
Tutorial: Using weather data
In this tutorial you will create a new Dashboard from the Dataset, Resource Set, and Metrics that you created as part of the Weather Tutorial. We will add two cards to illustrate how to use quick edit and multi-card edit .
Create a new dashboard
- From the Dashboards interface, click New Dashboard.
- Click Add Card, and then select a card type such as Dataset Visualization.
- Give your card a title.
- Select a dataset from the dropdown.
- Chart your data and select your visualization type
- Click Apply.
You should now have one card placed on the dashboard. Create a second card with a different set of data and visualization by repeating the above steps. See Visualization types to learn more about the visualization types supported in Observe.
Quick edit
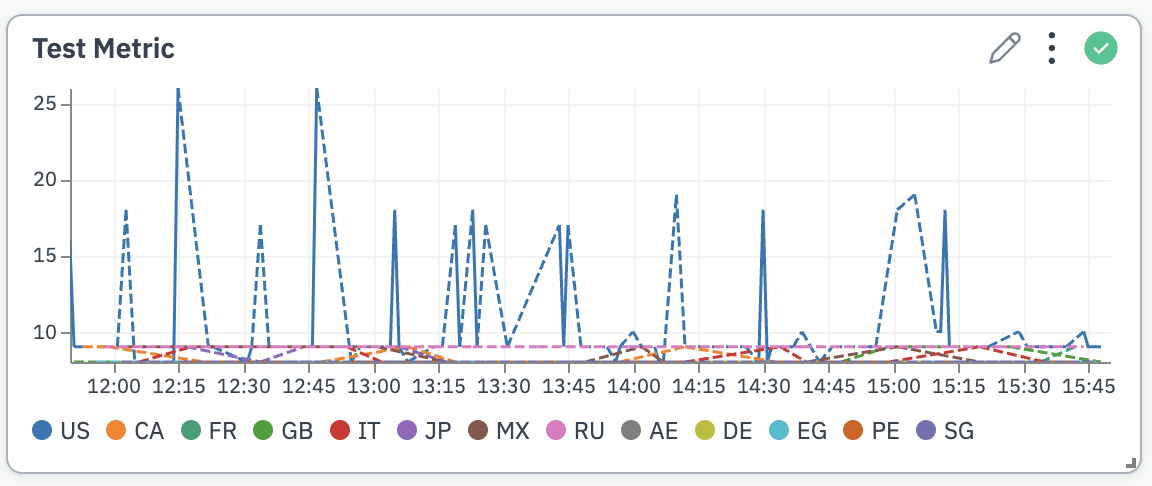
Click the Pencil icon on the card to enter quick edit mode. You can make changes to the query and visualization settings for that specific card.
Multi-card edit
Click the Manage all queries button. This will open an editor page similar to worksheets, where you can edit multiple cards at once, along with more advanced settings.
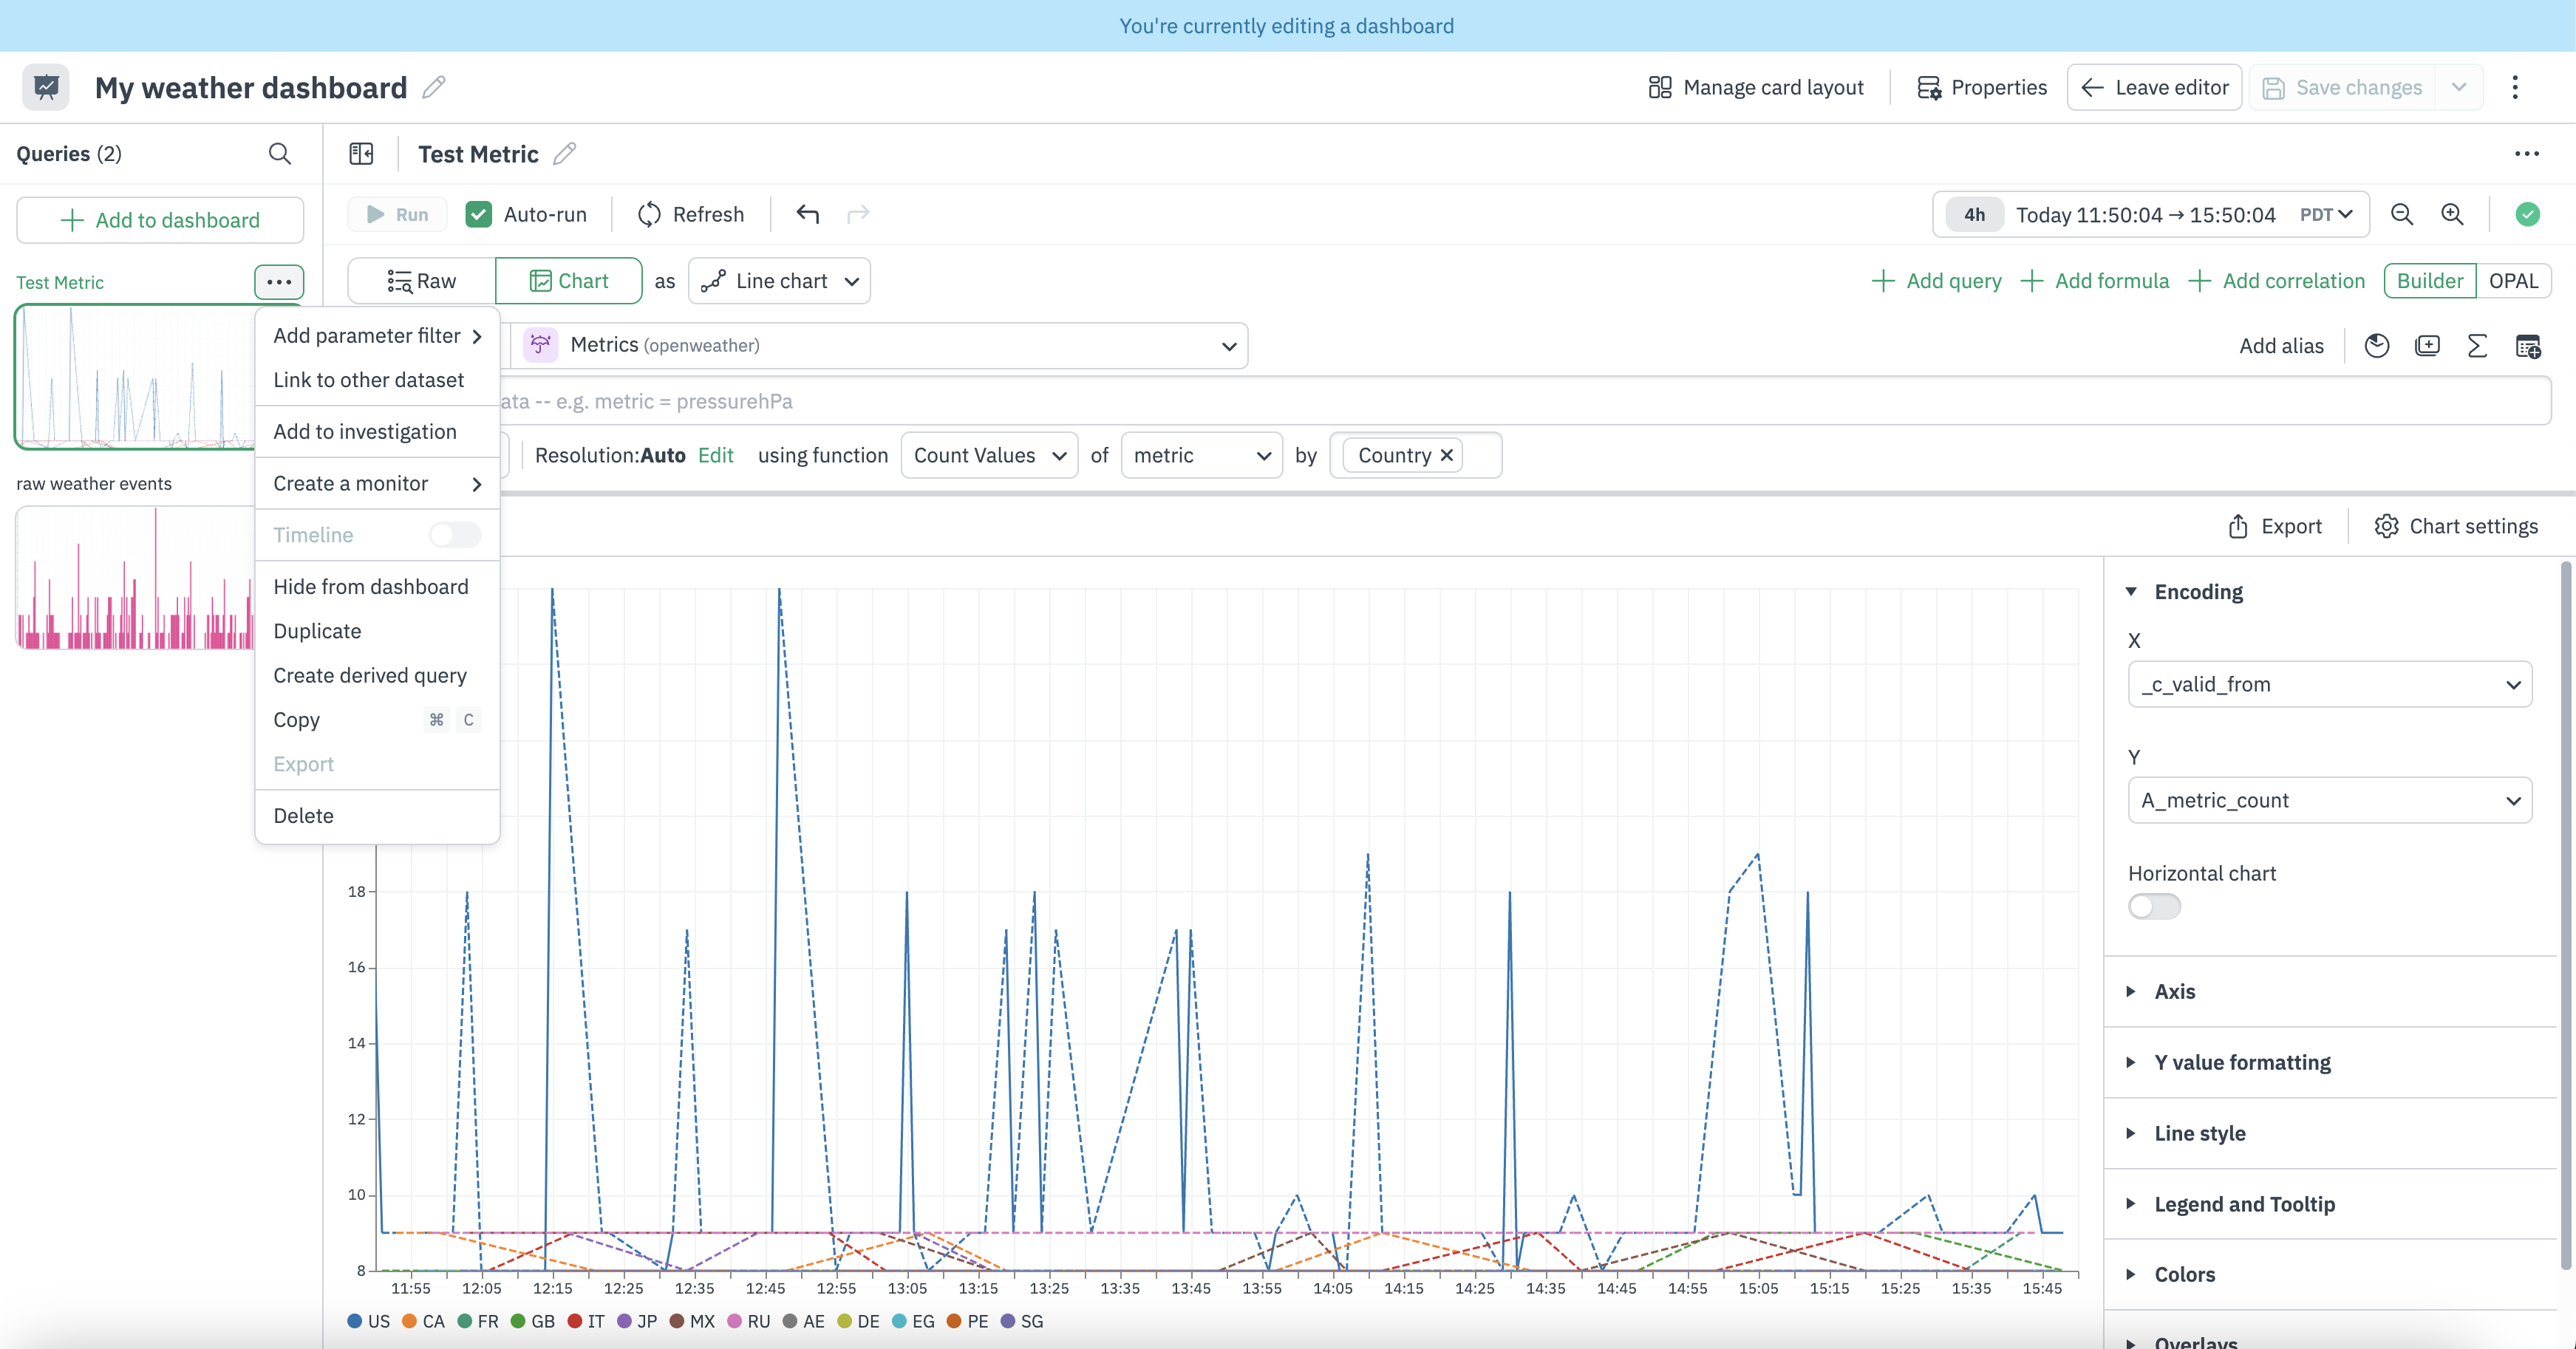
To return to the quick edit screen click Manage card layout.
Add filtering options to your dashboard
There are two main ways to add filtering to your dashboard.
- Parameter - A form field or input that allows filtering on charts and tables.
- Dashboard Filtered Panel - Enables easy filtering of dashboard based on a selected dataset.
Bind parameters to dashboard cards
Use the Select all option to bind parameter to all applicable cards in a dashboard. The following functionality is supported:
- Binding parameters to cards with custom OPAL expressions (note: subquery support is not yet available)
- Binding parameters to individual queries within multi-query cards
Note
This video walk-through utilizes the new Metric Tag parameter which is currently in Private Preview. Contact your Observe data engineer for early access.
A Dashboard Parameter lets you use common patterns like drop downs, numerical inputs and text fields to filter data. For instance if you want to filter a dashboard that uses many datasets and many panels (such as metrics, traces, and logs) by terms in a separate dataset (such as customer project names), you would use a Parameter to identify the customer project. Parameters support advanced features like mapping from names to IDs, multi-selection, All Values, and free form text entry.
To add a Parameter, edit the dashboard. Select Add Parameter and choose from the following options first:
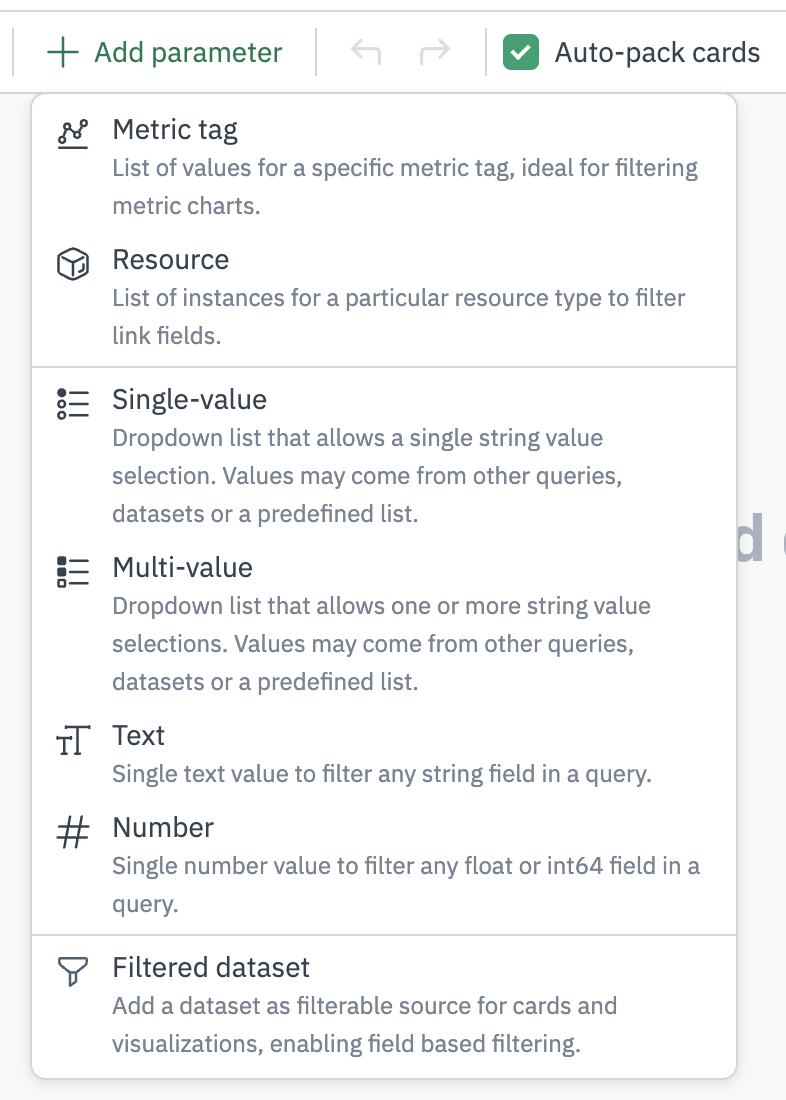
Single and Multi Select parameters can be populated in three ways: a Dataset, a Card from the dashboard, or a Custom list. This allows the user to select one or more parameters from a dynamic list to filter selected Cards in the dashboard. If the parameter is set to null or the "All Values" selection, no filtering is done in the selected Cards.
The Resource Instance parameter dropdown's list of options can only be populated with the primary key of a resource dataset. For instance you might use Cluster Name, and populate the drop down with resources from your Kubernetes Clusters resource set. You may optionally allow a Null resource, which effectively means no filtering is done in the selected Cards.
After selecting a default value in the parameter builder, click Next to select dashboard cards that should be filtered by the parameter. On this screen you will map the parameter filter value to columns on the filtered cards. Your options will be limited by the data types involved. For instance a Number Input parameter can only be used to filter numeric columns, such as int64.
Click Apply to add the new Parameter to the Dashboard, then use your mouse to drag it to the correct section, position, and size. Click Save to test the parameter filtered dashboard.
Add a dashboard filter panel
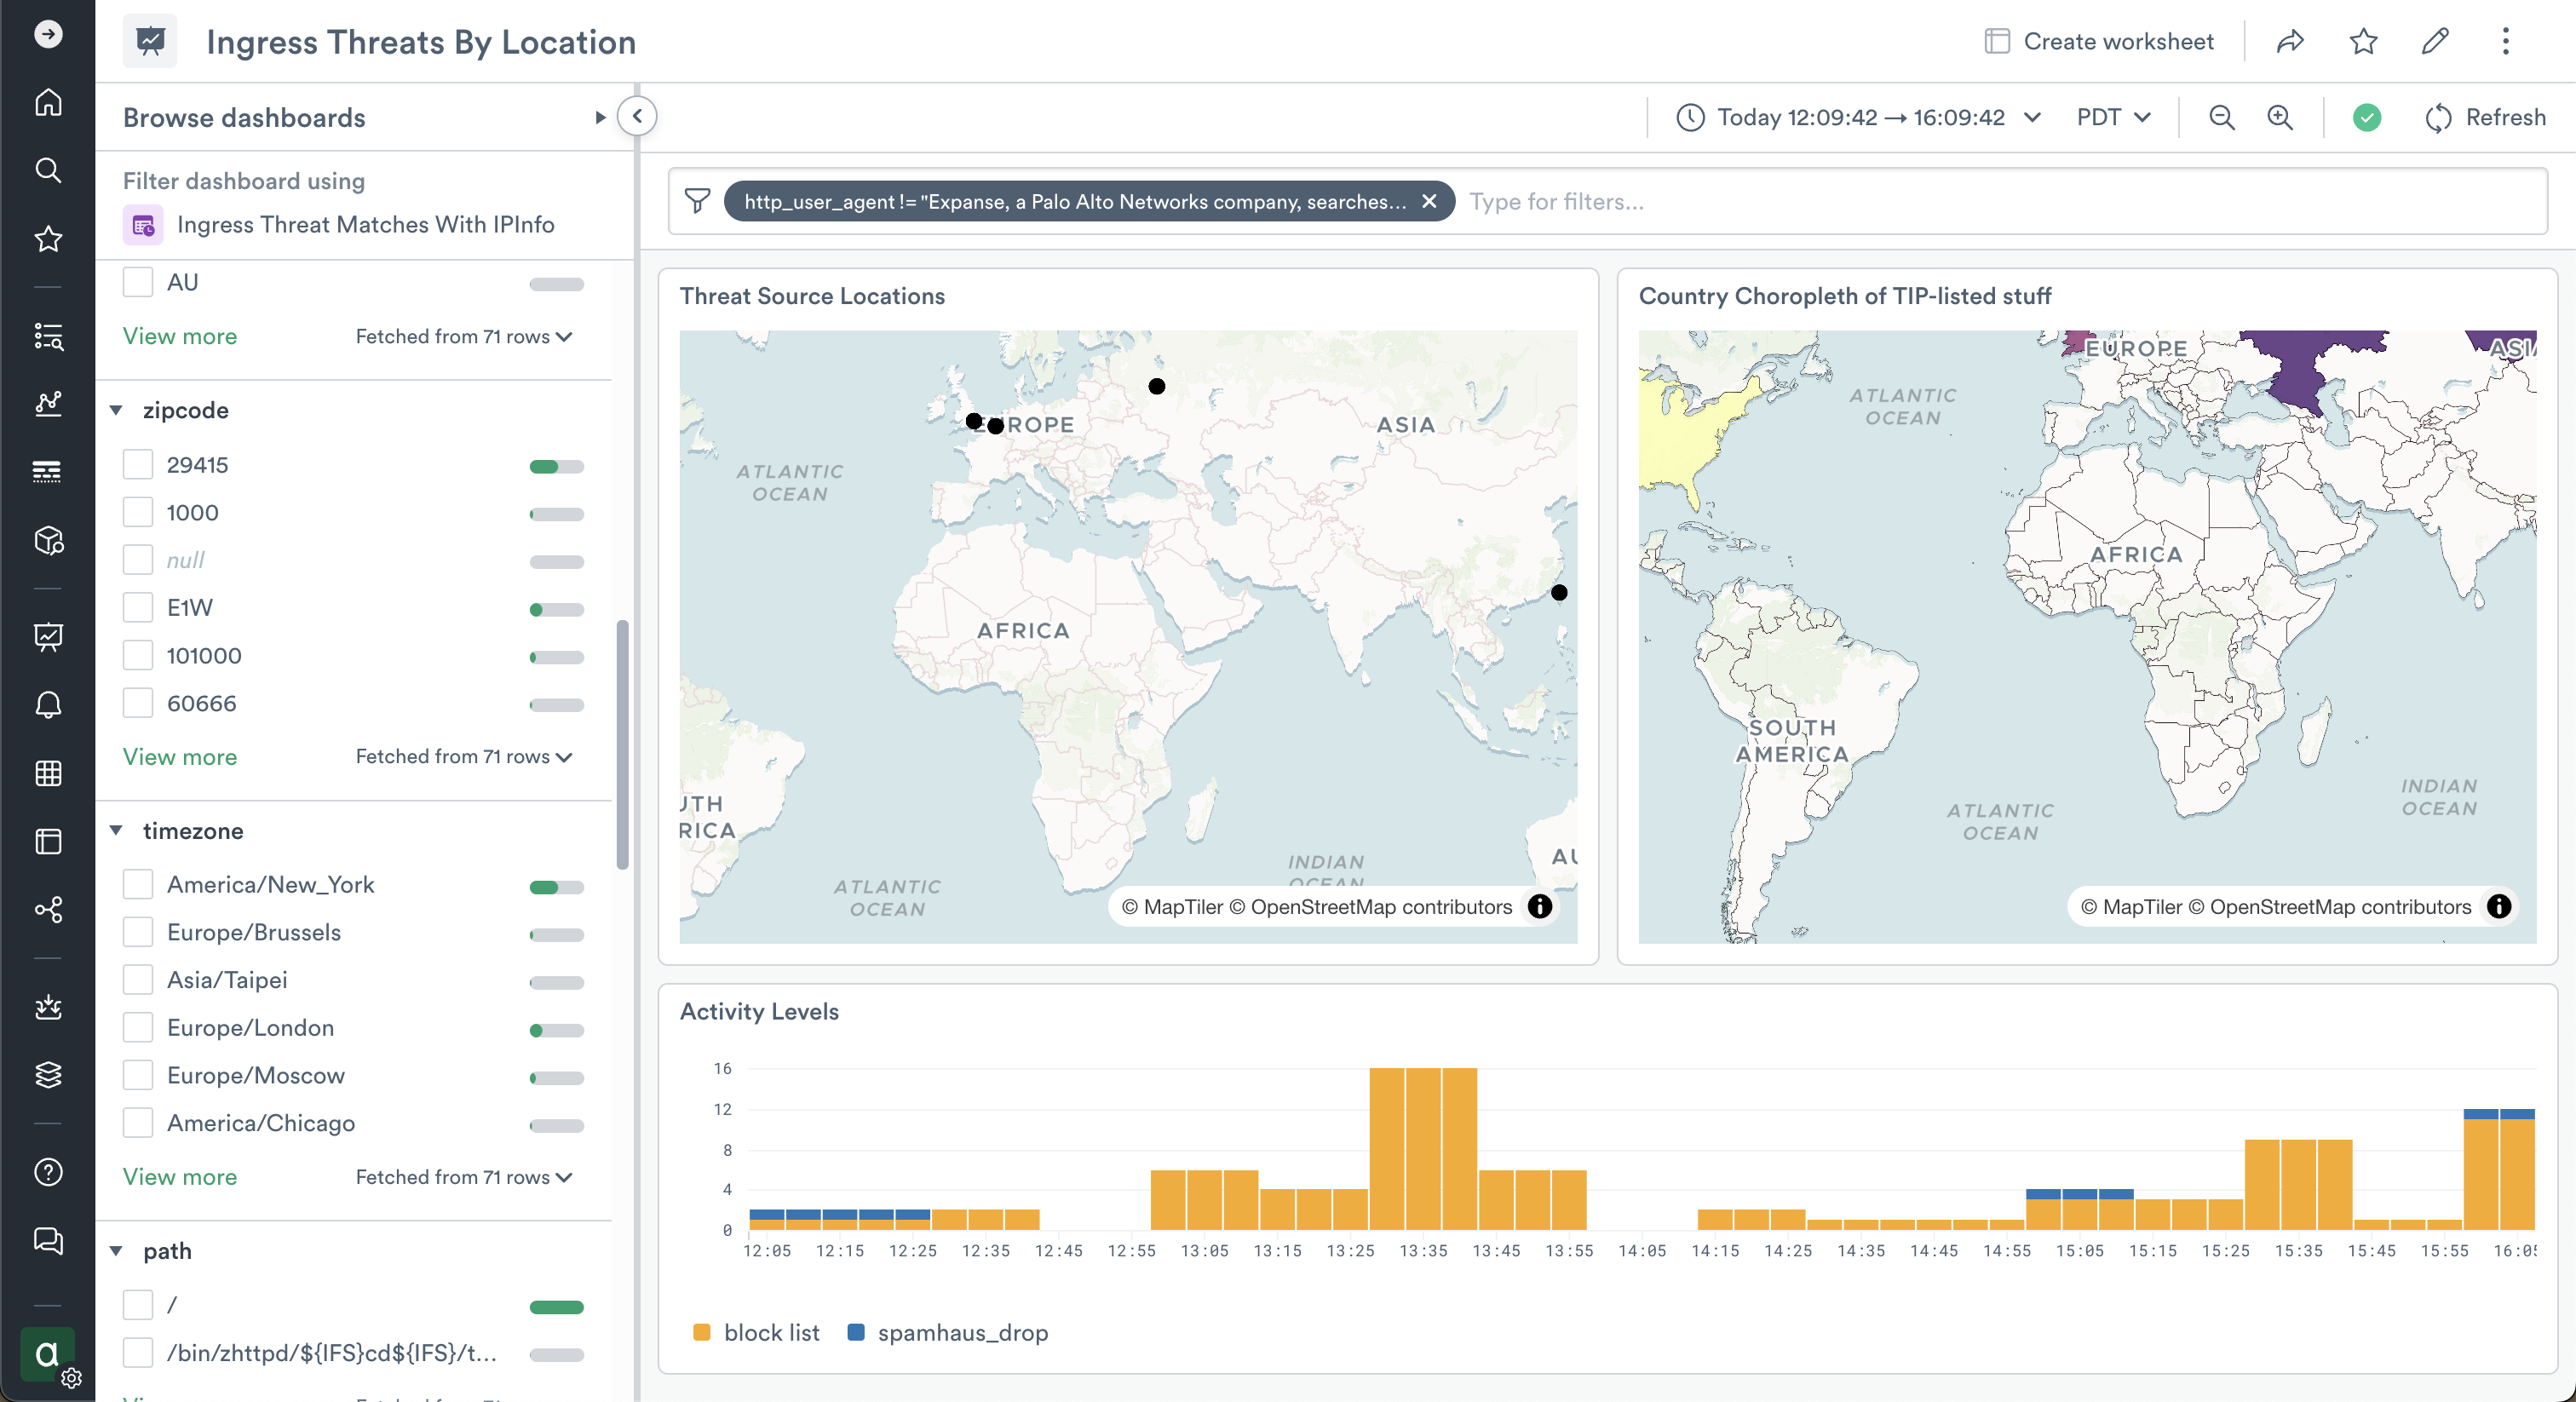
The Dashboard Filter Panel allows you to set a single Dataset as a filtering panel on a dashboard. The columns of the filtered dataset can be used as parameters to filter the cards on the dashboard. This is functionally identical to using the Filter bar, but can be used without a keyboard. When a Dashboard Filter Panel is in use, you can use the panel on the left to select values from columns in the data as filters for any column in the chosen dataset. Filtration done with the left panel is added to the Filter bar, where it can be edited. For instance, you can use the Filter bar to apply operations such as ~ or !~ which can't be applied via the filter panel.
To add a Dashboard Filter Panel, edit the dashboard. Select Add parameter, then click Filtered dataset. Select a dataset from the list. A dataset that is a source to cards in the dashboard can have filtration automatically applied to those cards; alternatively, you can select which cards and columns you want to filter with this dataset. Resource datasets that are linked from the data in dashboard cards are also eligible for automatic filtration.
To edit the filtered dataset used by an existing Dashboard Filter Panel, edit the Dashboard. Open the filtered dataset panel (if it is collapsed) by clicking the caret button on the top left beneath the Dashboard name. Click the pencil icon beneath "Filter dashboard using" and select a Dataset from the list. A dataset that is a source to cards in the dashboard can automatically be linked.
NoteOnce a Filtered Dataset is added to a Dashboard, it can be used as an input to cards in that Dashboard.
Configure custom dashboard drilldowns
You can link dashboards together using custom dashboard drilldowns to support troubleshooting workflows where you need to view multiple dashboards or traverse from dashboards to external URLs.
The following types of custom dashboard drilldowns are available:
- Text links support links from within text cards. Use these when you'd like to add explanatory text around a link.
- Card links enable a link from the top level of a card, next to the title, to a dashboard or external url.
- Data links support pivoting from a user selection, such as clicking on a line in a graph, to a dashboard or external URL.
All three types of custom dashboard drilldowns allow dashboard creators to pass the context of a dashboard that a user is viewing to another dashboard or URL, in order to support troubleshooting workflows.
Text links can be accessed by the URL icon when editing a text dashboard card.
Card links allow linking from the top level of a dashboard card to another dashboard or URL. Adding a new card link is possible via the kebab menu on a card while in Edit Mode.
Data links allow passing the user selection with a chart context, as well as the parameter or filtered dataset filters on the page. Add a new Data link is possible via the visualization settings when editing a dashboard card.
Custom dashboard drilldowns can also be used to link to external URLs and pass data (time, parameters) from dashboard interactions to those external URLs.
Use the metric tag parameter
Metric data often has associated tags, or labels, which provide extra data around the metric data points. Common examples of tags include cluster, host, service and other important metadata.
As of March 2025, Observe automatically indexes the metric label for all metric datasets and enables using that data to power parameters for filtering dashboard data.
Our new Metric Tag parameter allows users to easily filter dashboard data through the tags, or labels, which are associated with metric data.
Using this parameter type, you can easily filter down dashboard data using the tag, or label, metadata which is present in your metric data. While the values for the Metric Tag parameter are sourced from metric data, you can filter all types of data on your dashboard -- logs, metrics, spans and more -- using the Metric Tag Parameter.
Dashboard filtered Datasets
The Dashboard editor will make suggestions when you are configuring Filtered Datasets and Parameters. For example, we might make a new dashboard, add a card for Container Logs, add a card for Container Resources, and add a card for an unrelated dataset such as AWS ELB Active Connections metrics. When adding a Filtered Dataset to this dashboard, Kubernetes container relevant datasets are suggested as the best options to use.
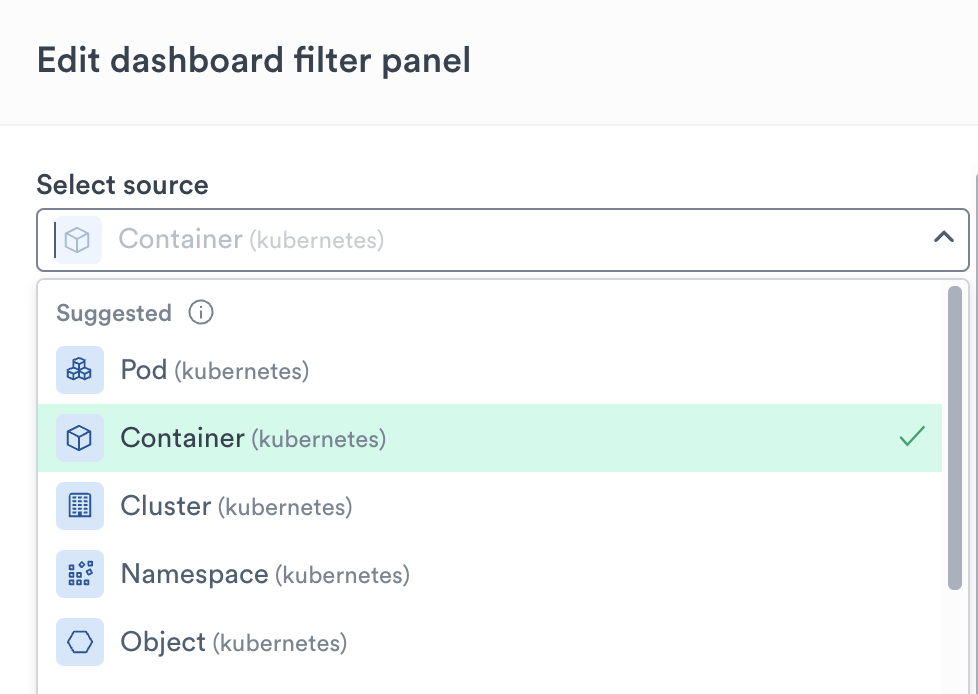
After selecting a column and clicking Next, the selected column name is used to automatically suggest linkages in the relevant cards.
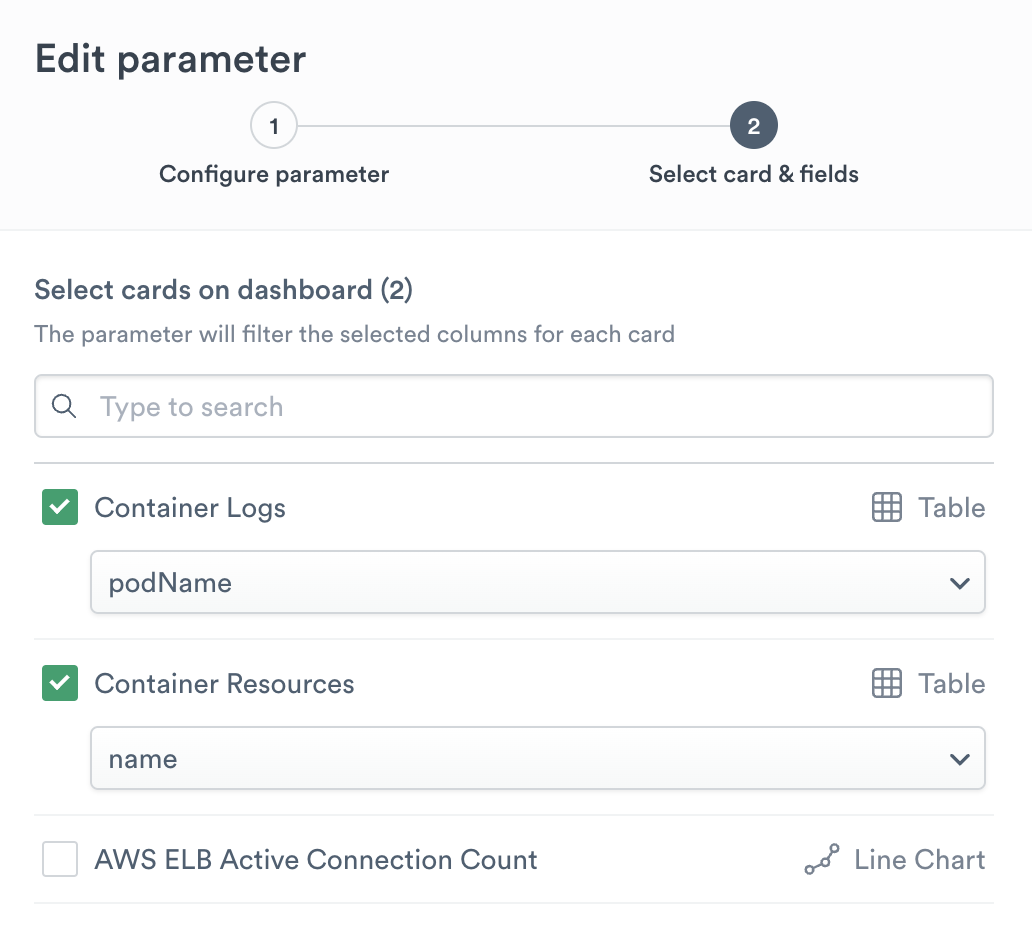
NoteThe same suggestion capabilities are used for dashboard parameters.
Copy and share your dashboard across Observe instances
A dashboard can be copied and pasted between instances. On the source instance, a user with Reader access to a dashboard can copy it to clipboard. Navigate to the dashboard via dashboard list or favorites, open it, and use the top right corner context menu to Copy. On the destination instance, a user with Writer or Admin can navigate to the Dashboard list and use the Paste button on the top right. If the source dashboard needs a data source, a data source with the same name will be referenced in the destination. If there is no data set that matches, a warning will be displayed but the dashboard can still be saved.
The body of data that is copied to clipboard is a base64-encoded text blob, which can be saved to text for source code control.
Use dashboards
To learn about presenting, sharing, and drilling down from dashboards, see Use dashboards to visualize data .
Generate dashboard reports
To learn about emailing dashboards as a PDF attachment, see Generate dashboard reports .
Updated 9 days ago