Microsoft Azure (Public Preview)
The Observe Azure App allows you to collect data from your Azure resources within your subscription. Based on the region, the Azure app simultaneously ingests logs and metrics from standard Azure services.
The Observe Azure App works with the datasets within the application. Observe can automate many everyday data modeling tasks, ensuring an accurate picture of your infrastructure. Observe can also update your workspace with new datasets when new functionality releases for this integration.
If you currently utilize Azure data, consult with Observe to see if the Azure Integration could enhance your existing data collection strategy.
What data does Observe ingest?
Observe catalogs the resources deployed with a given location (region) and collects logs and metrics from those resources.
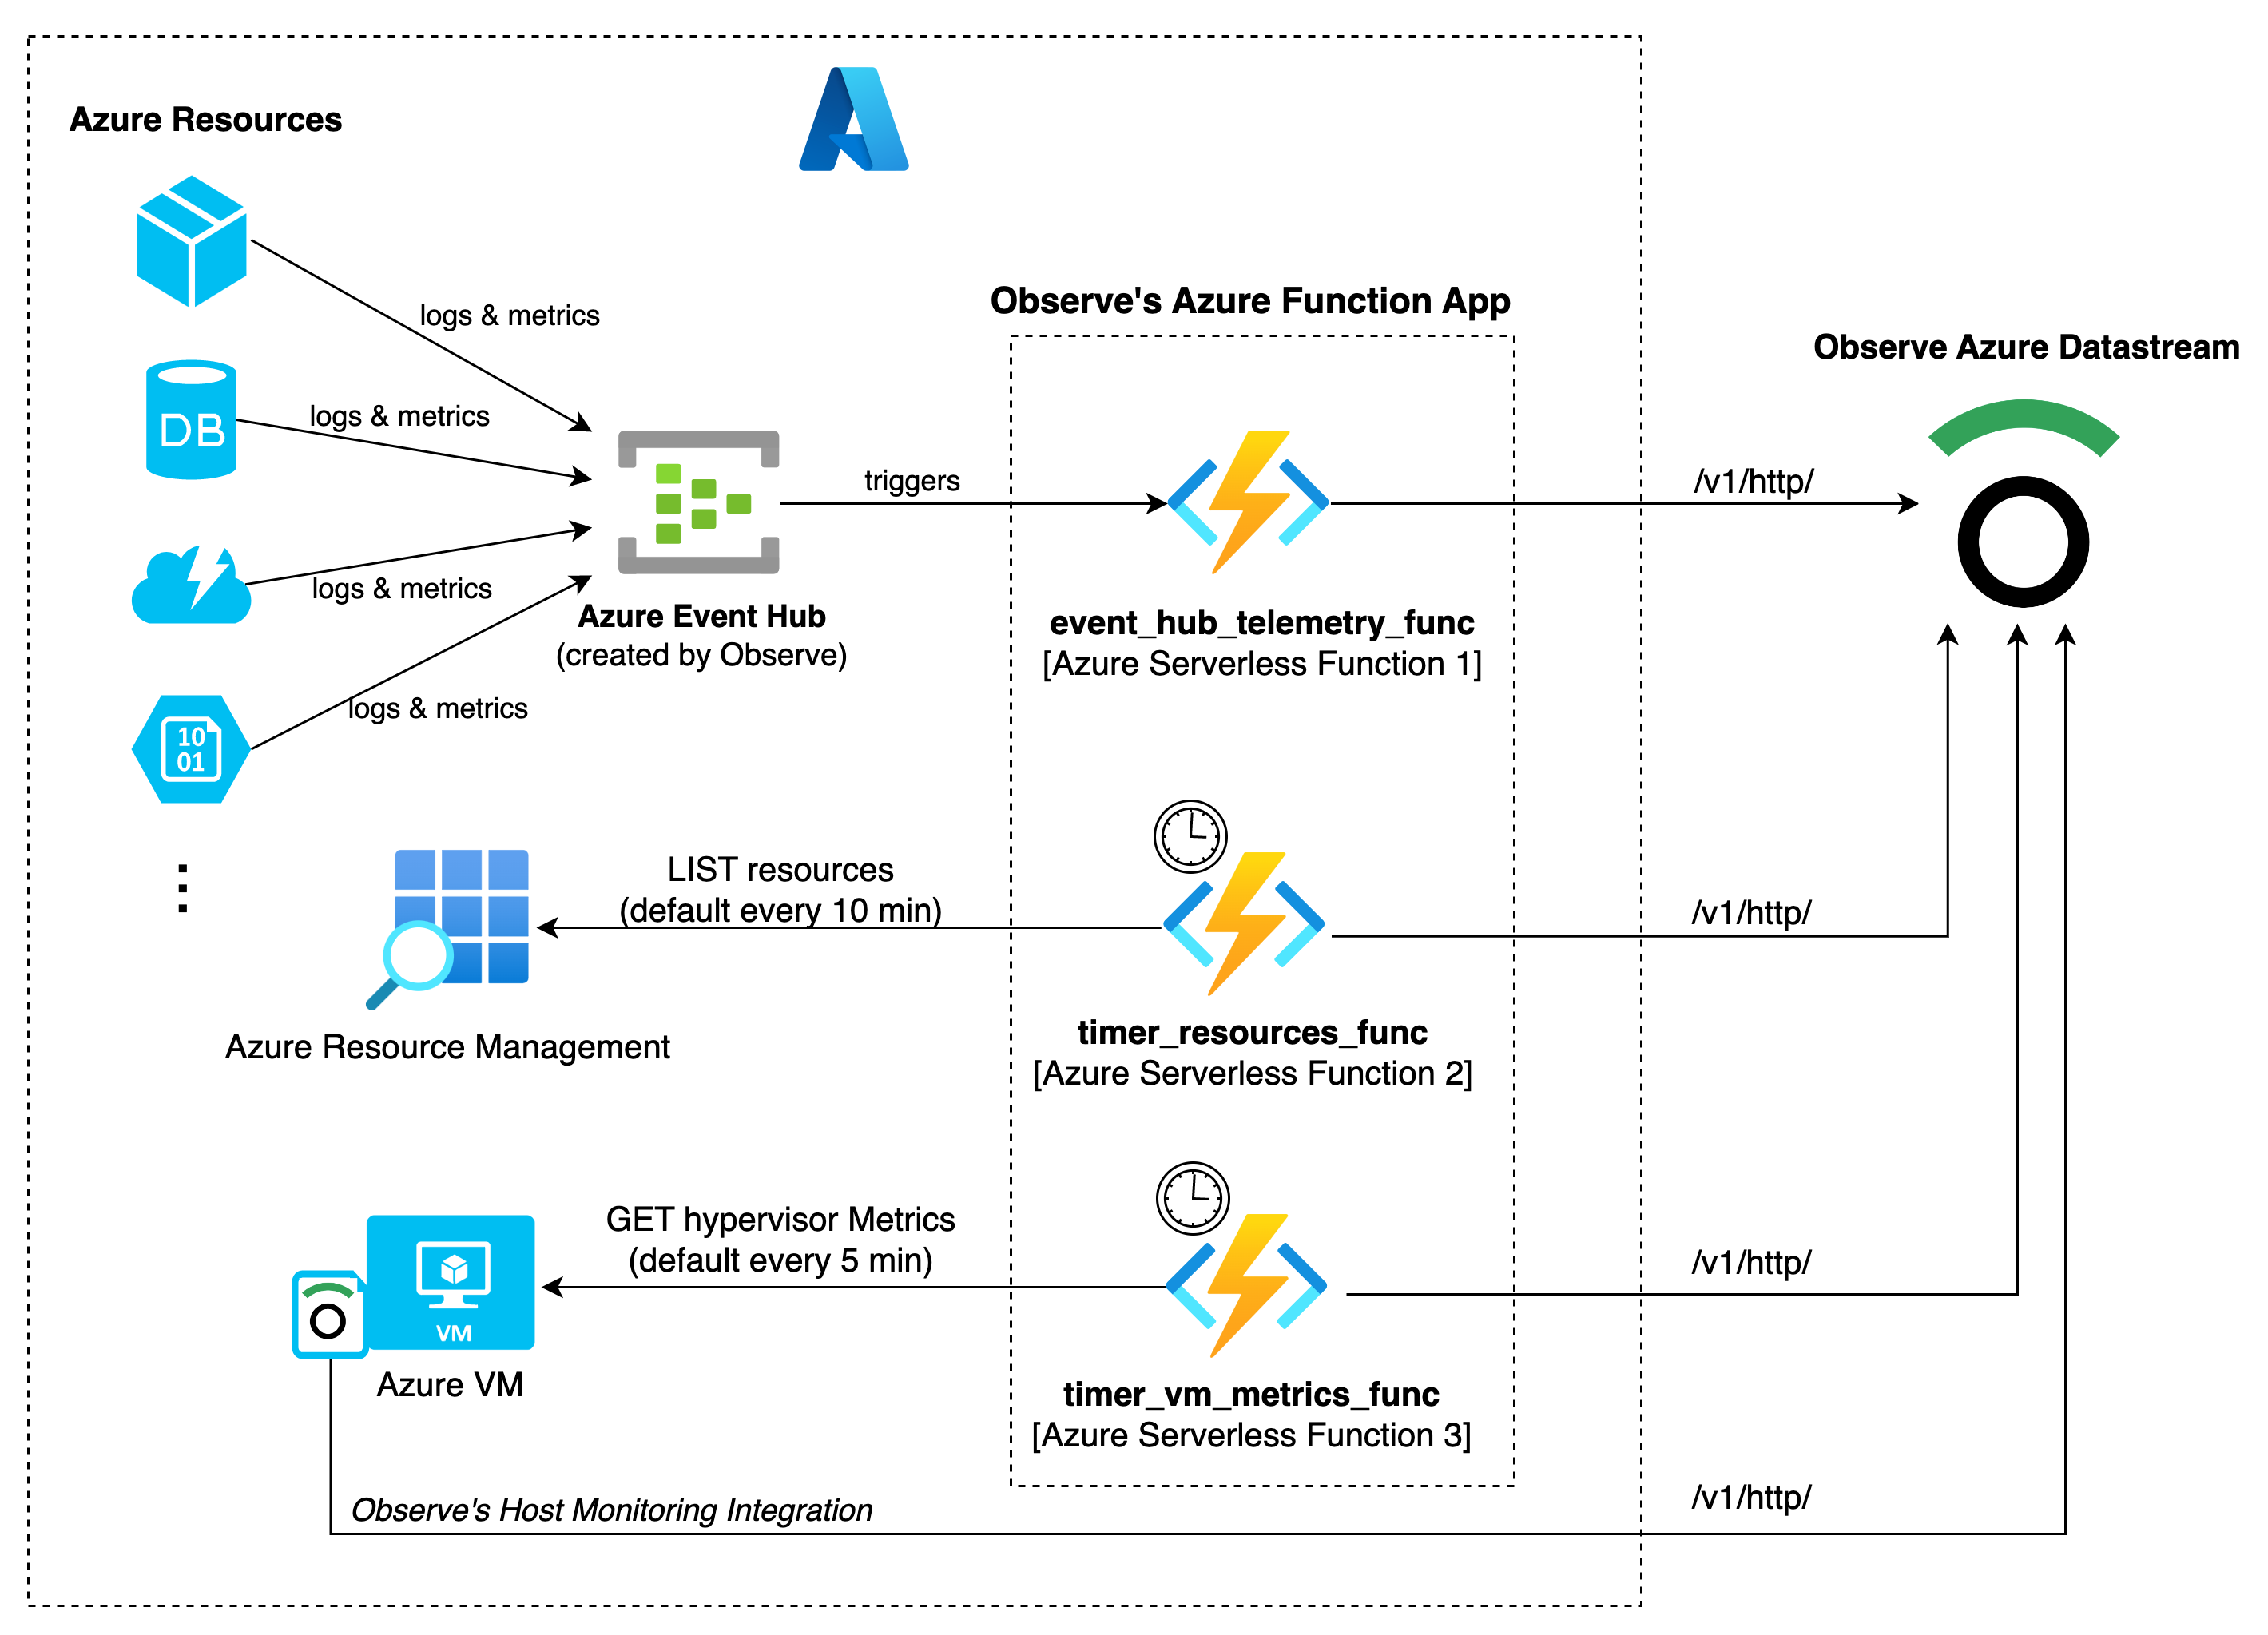
Figure 1 - Overview of Observe Azure data collection using the Observe Function App
The Observe Function App contains three functions responsible for data collection:
event_hub_telemetry_func
- captures the data sent to Event Hub from the Azure resources Diagnostic settings. Event Hub triggers this function and forwards the data to Observe.timer_resources_func
- returns all resources within the location (region) and the corresponding metadata. It runs on an assigned NCRONTAB schedule and set to every 10 minutes by default.timer_vm_metrics_func
- returns virtual machine metrics from the hypervisor. It runs on an assigned NCRONTAB schedule and set to every 5 minutes by default.
Standard ingest sources
The Observe Azure app automatically ingests the following types of data from a single location (region):
Azure Kubernetes Service (AKS) basic performance of your AKS Clusters
Note
Azure does not provide operating system (OS) metrics for virtual machines. Consider installing the Observe Host Monitoring app.
Using Azure Integration data
After shaping, the incoming data populates datasets such as the following:
AKS
AKS Clusters - AKS Cluster Logs and Metrics
Functions
Function App - Overall FunctionApp performance and usage
Functions - Function performance
SQL Database
SQL Server - Servers SQL Databases employ
SQL Database - Logs audit, deadlocks, error, query, timeout activity, and metrics such as query store runtime and wait statistics.
SQL Managed Instances
SQL Managed Instance - Status and basic metrics of instances
SQL Managed Instance Databases - Logs of errors and metrics, including query store runtime and wait statistics for databases running within SQL Managed Instances
Virtual Machines
Virtual Machine - Status and basic metrics of your virtual machines
Virtual Machine Disk - Status and usage of allocated disks for your virtual machines
Installation
Observe Azure Collection Setup
You can install the Azure app on the Apps page to install the Azure integration.
Click Configuration and select the Azure integrations you want to install using the app.
Select Connections.
Click Create connection. This creates an ingest token to use with the data stream.
Follow the instructions to create the ingest token.

Figure 2 - List of available Azure integrations
Before you begin, you should, at a minimum, have a datastream available to send Azure data, including an ingest token to be employed by the Data Collection Module terraform-azure-collection.
Install the Azure CLI.
Be sure the Azure CLI installs correctly by logging into Azure.
az login
3. You should receive a token from your browser that looks like this:
[
{
"cloudName": "AzureCloud",
"homeTenantId": "########-####-####-####-############",
"id": "########-####-####-####-############",
"isDefault": true,
"managedByTenants": [],
"name": "Acme Inc",
"state": "Enabled",
"tenantId": "########-####-####-####-############",
"user": {
"name": "[email protected]",
"type": "user"
}
}
]
4. Install the Azure Functions Core Tools.
5. Clone the Observe Terraform Collection Module repo locally.
git clone [email protected]:observeinc/terraform-azure-collection.git
6. Assign the Application Variables.
Inside the root of the terraform-azure-collection, create a file called azure.auto.tfvars
. The file contains the following content:
observe_customer = "<OBSERVE_CUSTOMER_ID>"
observe_token = "<DATASTREAM_INGEST_TOKEN>"
observe_domain = "<OBSERVE_DOMAIN(i.e. observe-staging.com)>"
timer_resources_func_schedule = "<TIMER_TRIGGER_FUNCTION_SCHEDULE>"
timer_vm_metrics_func_schedule = "<TIMER_TRIGGER_FUNCTION_SCHEDULE>"
location = "<AZURE_REGIONAL_NAME>"
Note
The Azure app assigns these default values:
timer_resources_func_schedule
timer_vm_metrics_func_schedule
Both values based on NCRONTAB.
The location
value sets the Azure Regional Name to eastus
by default.
7. Deploy the Azure application.
Inside the root directory of the terraform-azure-collection module, run the following commands:
terraform init
terraform apply -auto-approve
Data collection should begin shortly.
Azure Resource Configuration
To capture logs and metrics of most resources, you must add diagnostic settings. Please expand the desired Azure service name for instructions on adding diagnostic settings.
AKS
Note
For comprehensive Kubernetes monitoring, install the Observe Kubernetes App
Log into the Azure portal.
In the Azure search field, enter Kubernetes Services.

Figure 3 - Search for Kubernetes Services
3. Choose the service you want to monitor.
4. From the left menu, select Diagnostic Settings.

Figure 4 - Kubernetes Services - Select Diagnostic Settings
5. Click Add diagnostic setting.

Figure 5 - Kubernetes Services - Add Diagnostic Setting
6. Give your setting a name, select all the metrics listed, then click Stream to an Event hub. Make sure to select the Event hub namespace and Event hub name with your Observe customer ID in it.

Figure 6 - Kubernetes Services - Diagnostic Setting
7. Click Save.
Functions
Log into the Azure portal.
Search for the Function App in the search field and select the Function App.

Figure 7 - Search for Function App
3. Select the Function App to monitor.

Figure 8 - Function App - Select Function App
4. Search for Diagnostic settings and select it.

Figure 9 - Function App - Select Diagnostic Settings
5. Select Add diagnostic setting.

Figure 10 - Function App - Add Diagnostic Settings
6. Select the following options:
Diagnostic setting name - Observe
Function Application Logs
All Metrics
Stream to an event hub
7. Select the event hub created by the Observe collection function.
8. Click Save.

Figure 11 - Function App - Diagnostic Setting
SQL Database
Log into the Azure portal.
In the Azure search field, enter SQL Database.
Select your database.

Figure 12 - SQL Database - Select SQL Database
4. From the left menu, choose Diagnostic Settings and click Add diagnostic setting.

Figure 13 - SQL Database - Add Diagnostic Setting
5. Choose all Logs, audit logs, and all Metrics. Send to the event hub with your customer ID.

Figure 14 - SQL Database - Diagnostic Setting
6. Create a name for Diagnostic Setting and click Save.
SQL Managed Instances
Log into the Azure portal.
In the Azure search field, enter SQL Managed Instances.
Select your SQL Managed Instance.

Figure 15 - SQL Managed Instances - Select SQL Managed Instance
4. From the left menu, choose Diagnostic Settings and click Add diagnostic setting.

Figure 16 - SQL Managed Instances - Add Diagnostic Setting
5. Choose all Logs, Audit logs, and all Metrics. Send to event hub with your customer-id.

Figure 17 - SQL Managed Instances - Diagnostic Setting
6. Create a name for the diagnostic setting and click Save.
Virtual Machines
Currently, the Azure app collects this data using the timer_resources_func
and timer_vm_metrics_func
functions within the Observe Function app deployed. It does not require any diagnostic settings.
Removing the Observe Azure Collection Module
Remove the terraform-azure-collection module by running the following in the root directory:
terraform destroy
Note
You may encounter the following bug in the Azure provider during your removal of the app:
`Error: Deleting service principal with object ID “########-####-####-####-############”, got status 403
ServicePrincipalsClient.BaseClient.Delete(): unexpected status 403 with OData error: Authorization_RequestDenied: Insufficient privileges to complete the operation.`
If this happens, remove the azuread_service_principal.observe_service_principal
from the terraform state and continue the destroy process.
terraform state rm azuread_service_principal.observe_service_principal
terraform destroy
Find the service_principal object name by using the
id
returned, for example, replace it with yourid
.
terraform state list -id=249783e5-bcfd-480b-b8e8-5f8aaa7452e8
2. Remove the object from the state. Make sure to wrap the object in single quotes, for example, replace the name with that returned in the previous step.
terraform state rm 'module.collection["eastus"].azuread_service_principal.observe_service_principal'
3. Perform the terraform destroy function again.
terraform destroy
Collecting data from multiple locations
To collect data from multiple locations, re-deploy the Observe Azure Collection with the updated location you want to collect data.
FAQ
Debugging
Note
Be sure that you installed Diagnostic Settings for your integration before you begin to troubleshoot your instance.
Q: I’ve installed the Observe collection module terraform-observe-collection, but no data flows into Observe; what do I check?
Check to see if your functions uploaded to your Observe Function app, called “observe-app-
- ”

Figure 18 - Debugging Function App
However, if you can’t find them, you most likely missed a step in the terraform-azure-collection. The most commonly seen error is not installing the missing Azure Functions Core Tools.
Enable Azure’s Application Insights and select your Observe Resource Group. Ensure functions perform correctly.

Figure 19 - Enabling Application Insights On Your Resource Group

Figure 20 - Select Application Insights Inside Your Resource Group

Figure 21 - Review Observe Application Insights
Note
If you decide to remove the Observe collection module, please remove Azure Application Insights from the portal first.
If the functions exist, try restarting the instance for your Observe Function App.

Figure 22 - Restart Function App Machine