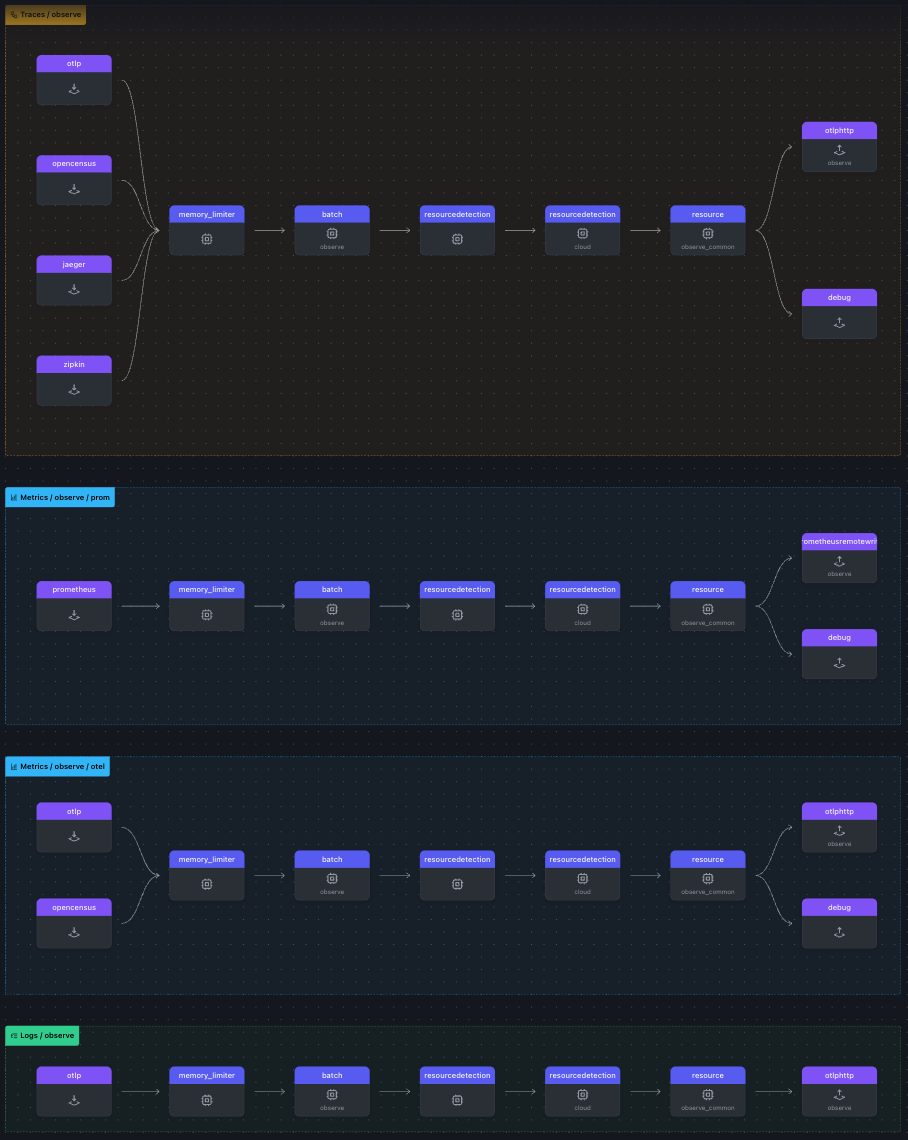
Full host example
This page provides a full example host configuration. Below is a visual representation of the config, followed by the actual config:
extensions:
  health_check:
  pprof:
    endpoint: 0.0.0.0:1777
  zpages:
    endpoint: 0.0.0.0:55679

receivers:
  otlp:
    protocols:
      grpc:
        endpoint: 0.0.0.0:4317
      http:
        endpoint: 0.0.0.0:4318

  opencensus:
    endpoint: 0.0.0.0:55678

  # Collect own metrics
  prometheus:
    config:
      scrape_configs:
      - job_name: 'otel-collector'
        scrape_interval: 10s
        static_configs:
        - targets: ['0.0.0.0:8888']

  jaeger:
    protocols:
      grpc:
        endpoint: 0.0.0.0:14250
      thrift_binary:
        endpoint: 0.0.0.0:6832
      thrift_compact:
        endpoint: 0.0.0.0:6831
      thrift_http:
        endpoint: 0.0.0.0:14268

  zipkin:
    endpoint: 0.0.0.0:9411

processors:
  memory_limiter:
    check_interval: 10s
    limit_percentage: 80
    spike_limit_percentage: 15
  batch/observe/metrics:
    send_batch_max_size: 20480
    send_batch_size: 16384
    timeout: 1s
  batch/observe/logs:
    send_batch_max_size: 4096
    send_batch_size: 4096
    timeout: 5s
  batch/observe/traces:
    send_batch_max_size: 4096
    send_batch_size: 4096
    timeout: 5s

  resource/observe_common:
    attributes:
      - key: deployment.environment.name
        action: upsert
        value: sandbox

  resourcedetection:
    detectors: [env, system]
    system:
      hostname_sources: ["dns", "os"]
      resource_attributes:
        host.id:
          enabled: false
        os.type:
          enabled: true
        host.arch:
          enabled: true
        host.name:
          enabled: true
        os.description:
          enabled: true
  resourcedetection/cloud:
    detectors: ["gcp", "ecs", "ec2", "azure"]
    timeout: 2s
    override: false

exporters:
  debug:

  otlphttp/observe/metrics:
    compression: zstd
    endpoint: https://132713446497.collect.observe-sandbox.com:3444/v2/otel
    headers:
      authorization: Bearer ds1aZvcbD3PTmpYFG03I:rCTJHqSuYl-3H6D450nBV5v0J1qfiiQ-
      x-observe-target-package: Metrics # Otel metrics go in a common "Metrics" package
    retry_on_failure:
      enabled: true
      initial_interval: 1s
      max_elapsed_time: 5m
      max_interval: 30s
    sending_queue:
      enabled: true
  prometheusremotewrite/observe:
    endpoint: https://132713446497.collect.observe-sandbox.com:3444/v1/prometheus
    headers:
      authorization: Bearer ds1aZvcbD3PTmpYFG03I:rCTJHqSuYl-3H6D450nBV5v0J1qfiiQ-
      x-observe-target-package: Host Explorer # Kubernetes Explorer or Host Explorer
    max_batch_request_parallelism: 10
    remote_write_queue:
      num_consumers: 10
    resource_to_telemetry_conversion:
      enabled: true
    send_metadata: true
    timeout: 10s

  otlphttp/observe/logs:
    compression: zstd
    endpoint: https://132713446497.collect.observe-sandbox.com:3444/v2/otel
    headers:
      authorization: Bearer ds1aZvcbD3PTmpYFG03I:rCTJHqSuYl-3H6D450nBV5v0J1qfiiQ-
      x-observe-target-package: Host Explorer
    retry_on_failure:
      enabled: true
      initial_interval: 1s
      max_elapsed_time: 5m
      max_interval: 30s
    sending_queue:
      enabled: true

  otlphttp/observe/traces:
    compression: zstd
    endpoint: https://132713446497.collect.observe-sandbox.com:3444/v2/otel
    headers:
      authorization: Bearer ds1aZvcbD3PTmpYFG03I:rCTJHqSuYl-3H6D450nBV5v0J1qfiiQ-
      x-observe-target-package: Tracing # Traces go in a shared Tracing package
    retry_on_failure:
      enabled: true
      initial_interval: 1s
      max_elapsed_time: 5m
      max_interval: 30s
    sending_queue:
      enabled: true

service:
  telemetry:
    logs:
      processors:
        - batch:
            exporter:
              otlp:
                protocol: http/protobuf
                endpoint: http://localhost:4318

  pipelines:
    traces/observe:
      exporters: [otlphttp/observe/traces, debug]
      receivers: [otlp, opencensus, jaeger, zipkin]
      processors:
      - memory_limiter
      - batch/observe/traces
      - resourcedetection
      - resourcedetection/cloud
      - resource/observe_common # to add Observe common metrics

    metrics/observe/prom:
      exporters: [prometheusremotewrite/observe, debug]
      receivers: [prometheus]
      processors:
      - memory_limiter
      - batch/observe/metrics
      - resourcedetection
      - resourcedetection/cloud
      - resource/observe_common # to add Observe common metrics

    metrics/observe/otel:
      exporters: [otlphttp/observe/metrics, debug]
      receivers: [otlp, opencensus]
      processors:
      - memory_limiter
      - batch/observe/metrics
      - resourcedetection
      - resourcedetection/cloud
      - resource/observe_common # to add Observe common metrics

    logs/observe:
      exporters: [otlphttp/observe/logs]
      receivers: [otlp]
      processors:
      - memory_limiter
      - batch/observe/logs
      - resourcedetection
      - resourcedetection/cloud
      - resource/observe_common # to add Observe common metrics

  extensions: [health_check, pprof, zpages]
Updated about 1 month ago