Send Java application data to Observe
This page describes how to install the Observe Agent, then instrument your Java applications to send data to Observe.
OpenTelemetry automatically instruments and supports a large number of libraries, frameworks, and application servers for Java out of the box. See Supported libraries, frameworks, application servers, and JVMs in the OpenTelemetry documentation on GitHub.
To manually instrument custom logic, refer to Manage Telemetry with SDK in the Java SDK documentation.
Compatibility
To send Java application data to Observe, you must have Java version 8 or higher.
Get the Observe Agent
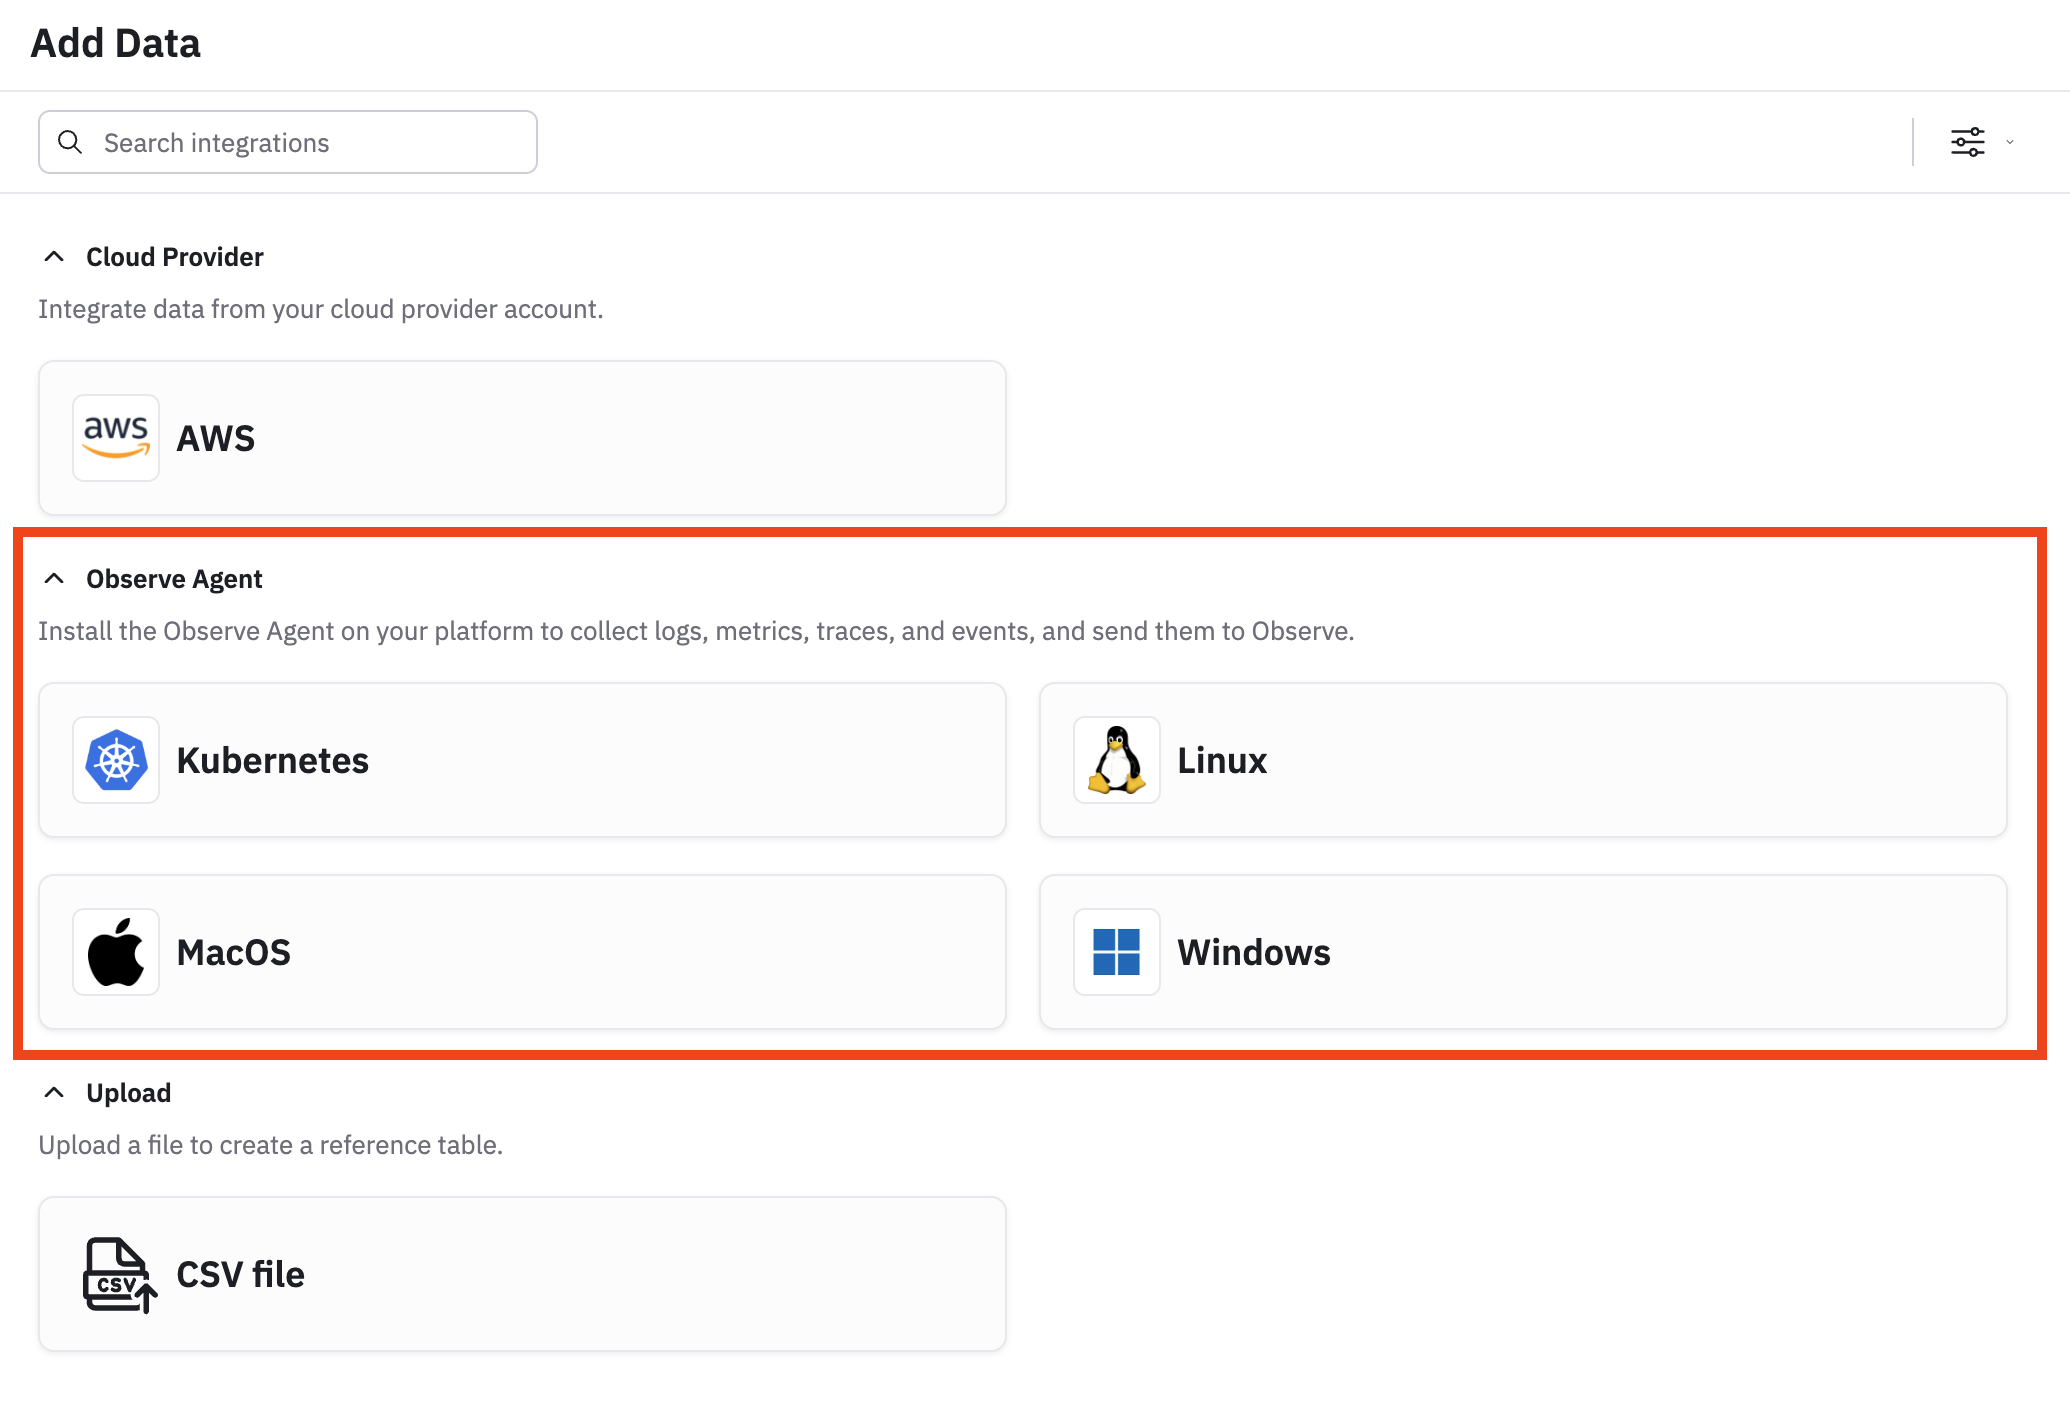
Use the Add Data portal in the product to get the Observe Agent installed in your environment.
- From the left navigation rail, select Data & integrations > Add data.
- In the Observe Agent section, pick your environment, then follow the instructions to create a data ingest token and install the Observe Agent.
Add the OpenTelemetry zero-code instrumentation for Java
The instrumentation is packaged as a JAR file which dynamically injects bytecode to capture telemetry from your Java applications:
curl -L -O https://github.com/open-telemetry/opentelemetry-java-instrumentation/releases/latest/download/opentelemetry-javaagent.jarConfigure the instrumentation
Set the following environment variables. Replace the placeholders such as ${YOUR_SERVICE_NAME} with the actual information from your environment.
OTEL_SERVICE_NAME=${YOUR_SERVICE_NAME}
JAVA_TOOL_OPTIONS=-javaagent:${PATH_TO}/opentelemetry-javaagent.jar
OTEL_RESOURCE_ATTRIBUTES=deployment.environment=${YOUR_APP_ENVIRONMENT}
OTEL_EXPORTER_OTLP_ENDPOINT=http://${YOUR_OBSERVE_AGENT_ENDPOINT}:4318
Run your instrumented application
Run the following command:
java -jar /path/to/myapp.jarNext steps
Navigate to Traces in your Observe tenant to view traces from your application.
- Use Trace Explorer to find traces in your environment.
- Use service management to view your services and their dependencies.
- Monitor and track new deployments on your service.
- View logs associated with a trace.
- Use the APM reference to see what data is collected by APM.
Updated 2 months ago