Use Observe to manage Snowflake
Explore Snowflake query and task activity in Observe
In Observe, the Observe for Snowflake app/integration accepts the incoming stream of data sent by Observe for Snowflake native app and curates it into a substantial list of heavily-interconnected datasets and a number of useful dashboards.
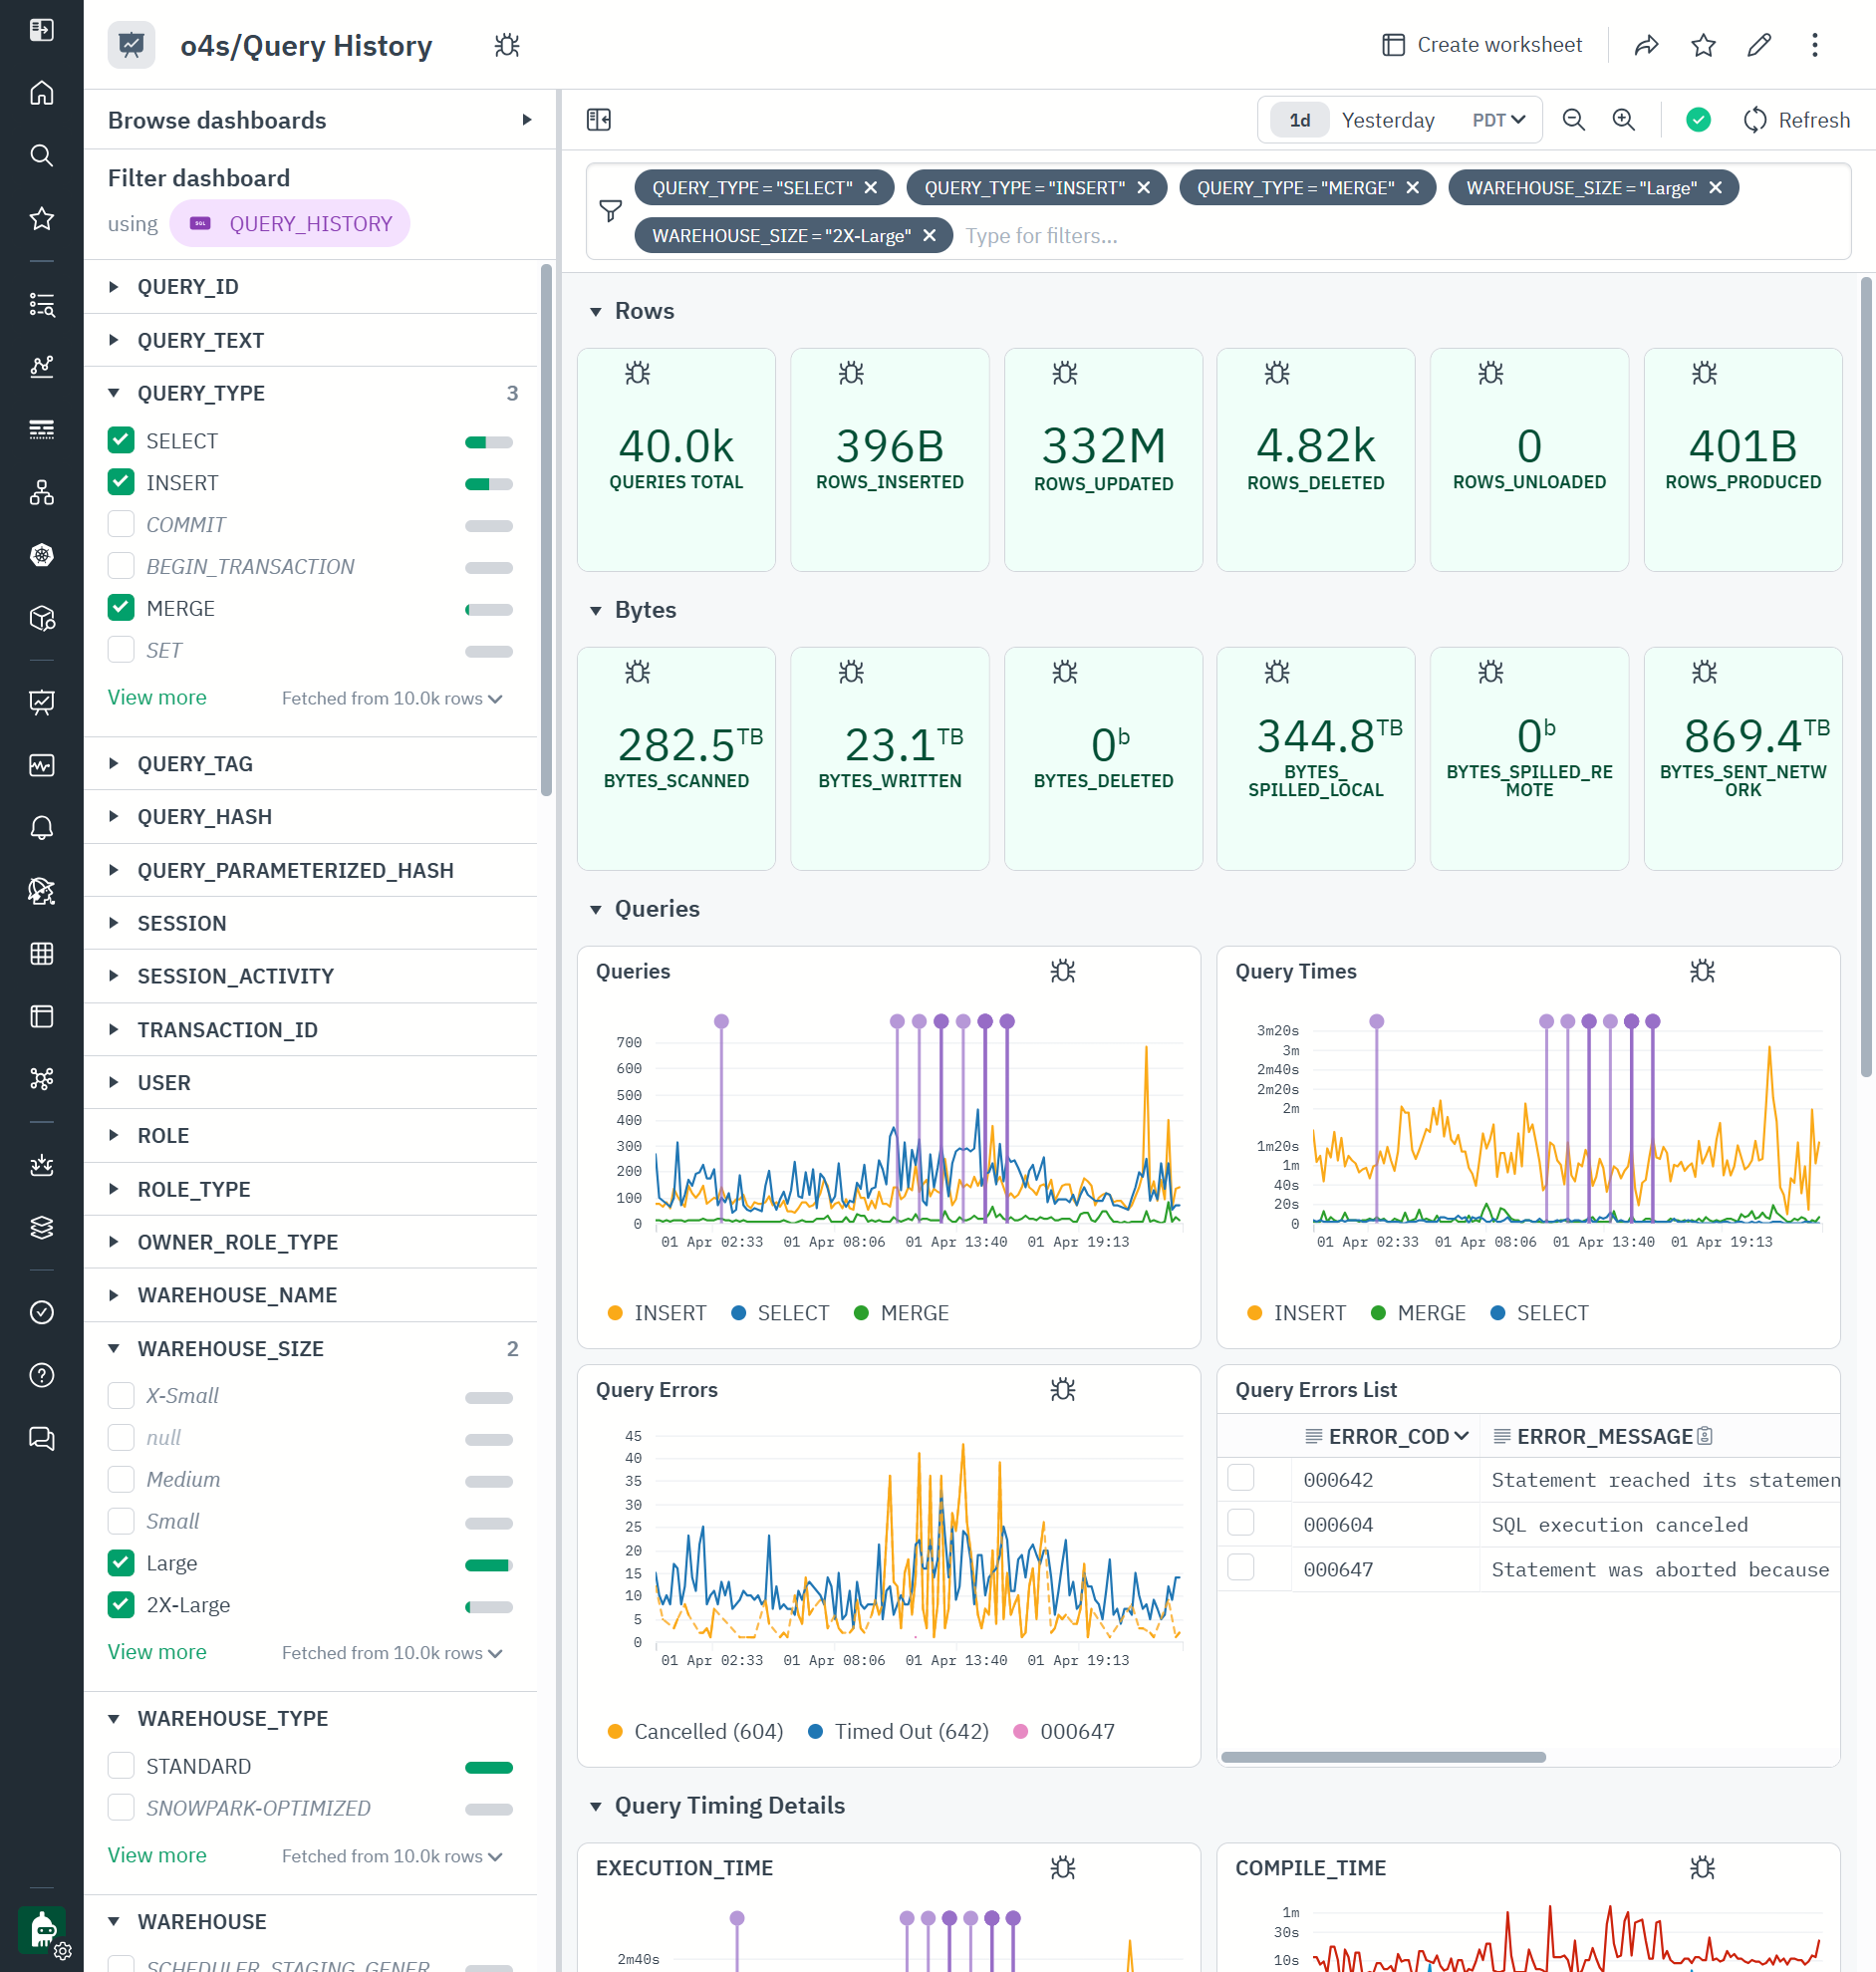
The Observe for Snowflake Query History dashboard provides view into activity of computational workloads in Snowflake. Here is example query activity with 1 day worth of SELECT, INSERT and MERGE queries executed by L and 2XL warehouses across multiple Snowflake instances.
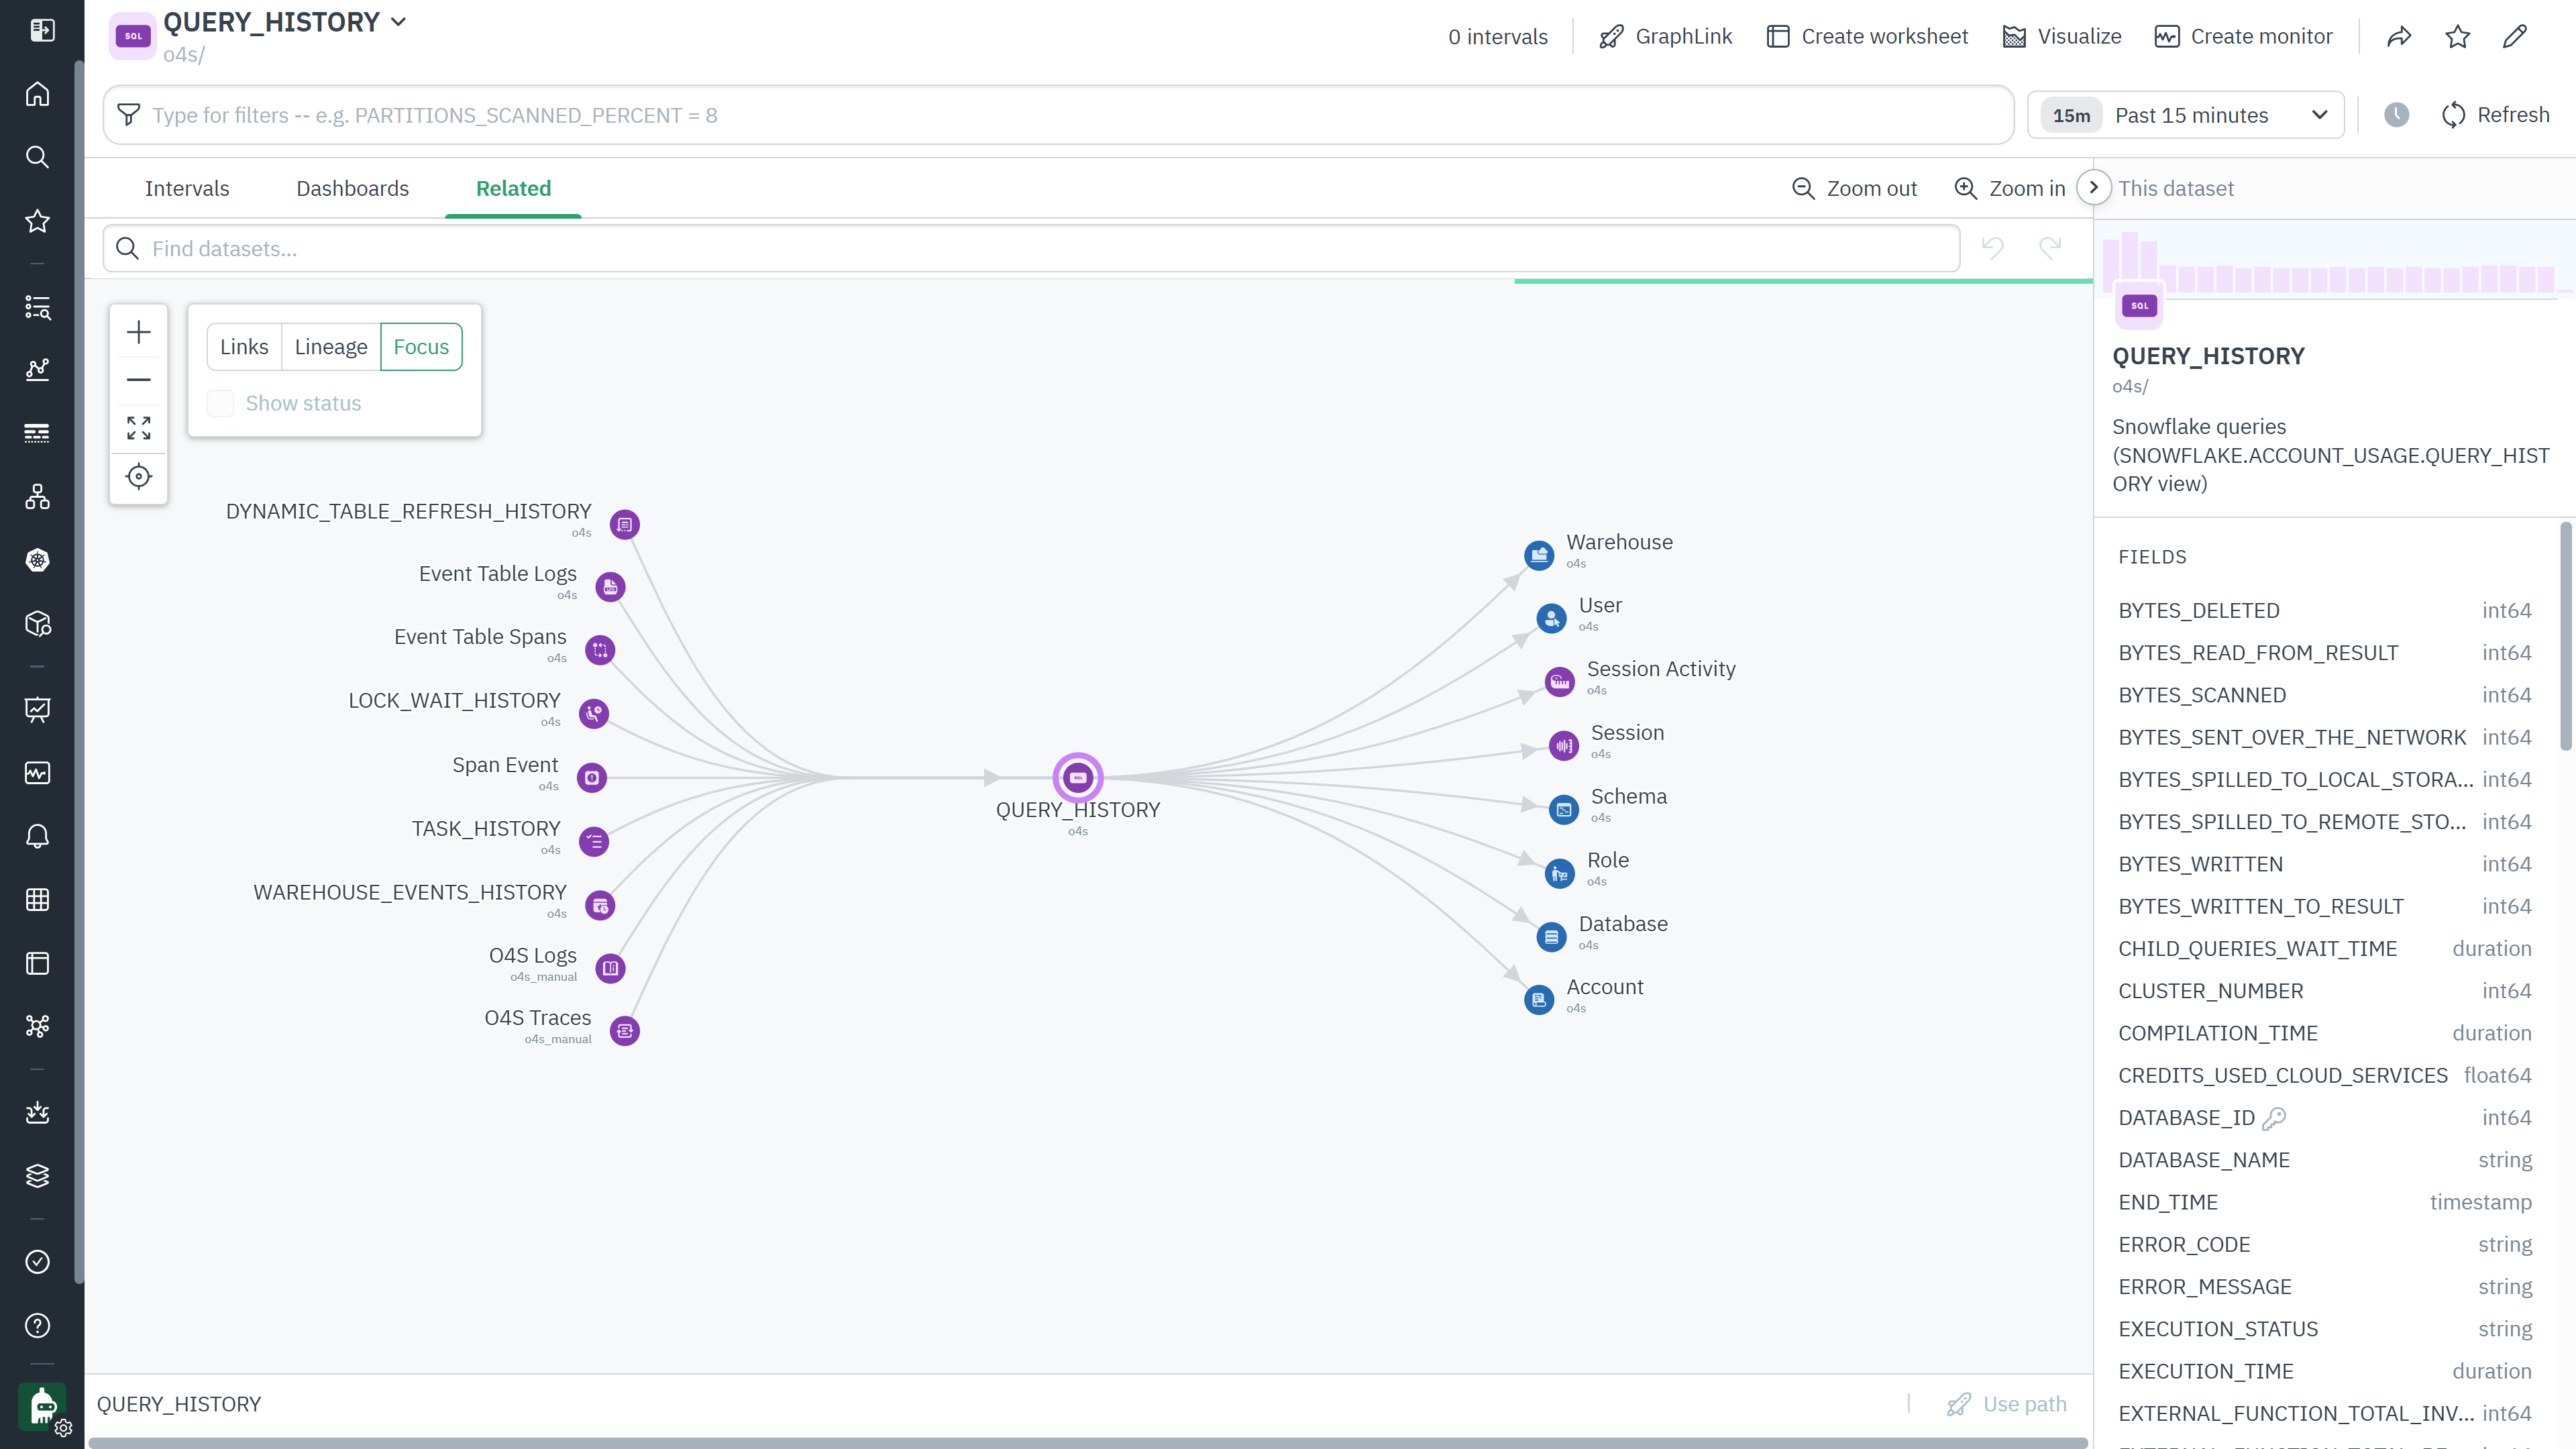
QUERY_HISTORY dataset is based on essential ❄️QUERY_HISTORY view that all Snowflake administrators use heavily to understand and manage their queries. This dataset contains a record for every query ran in Snowflake. As you can see, it is heavily connected to all the other history views such as TASK_HISTORY and WAREHOUSE_EVENTS_HISTORY (modeled as Observe event and interval streams) and is linked to the objects such as Warehouse, Schema, User, Role and Account (modeled as Observe Resource Datasets). Those allow us to navigate the graph of the objects and their events:
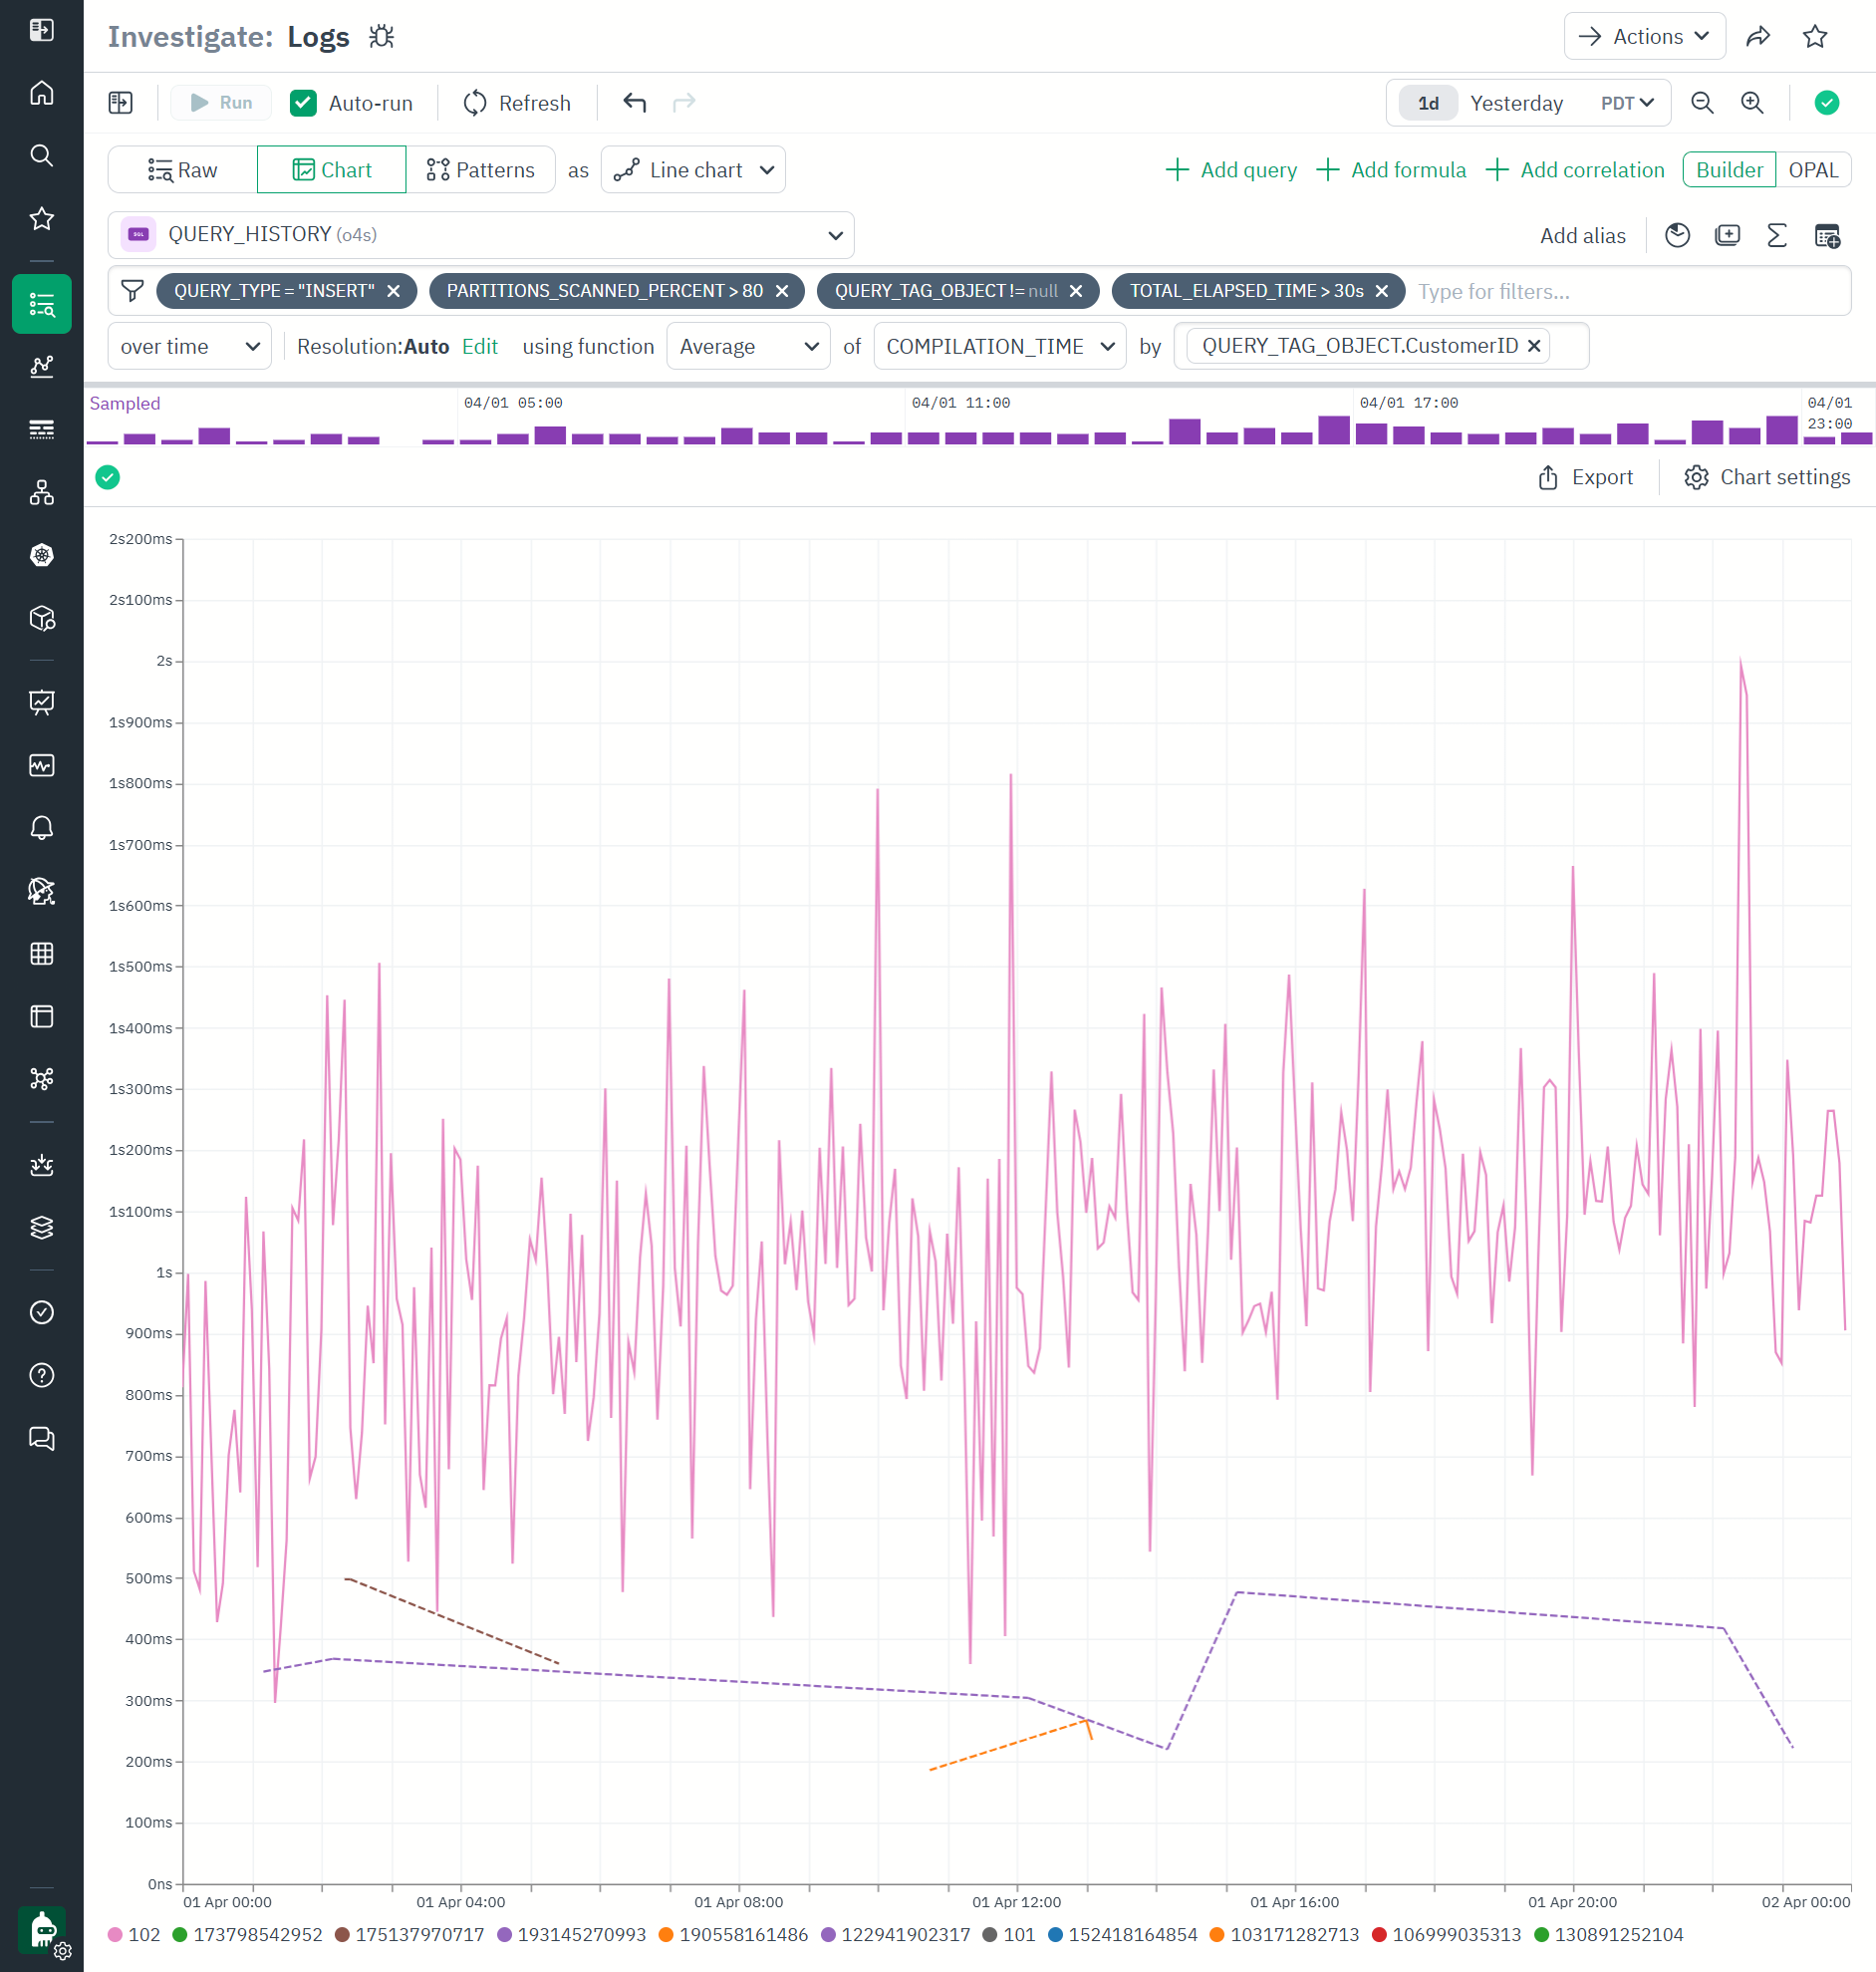
QUERY_HISTORY can be explored, queried and graphed with Observe Log Explorer. Here is an example of looking at 1 day of INSERT queries that scanned more than 90% of the partitions in the underlying source table, ran for >30 seconds, were tagged with ❄️QUERY_TAG parameter, and graphed by the CustomerID value from the QUERY_TAG.
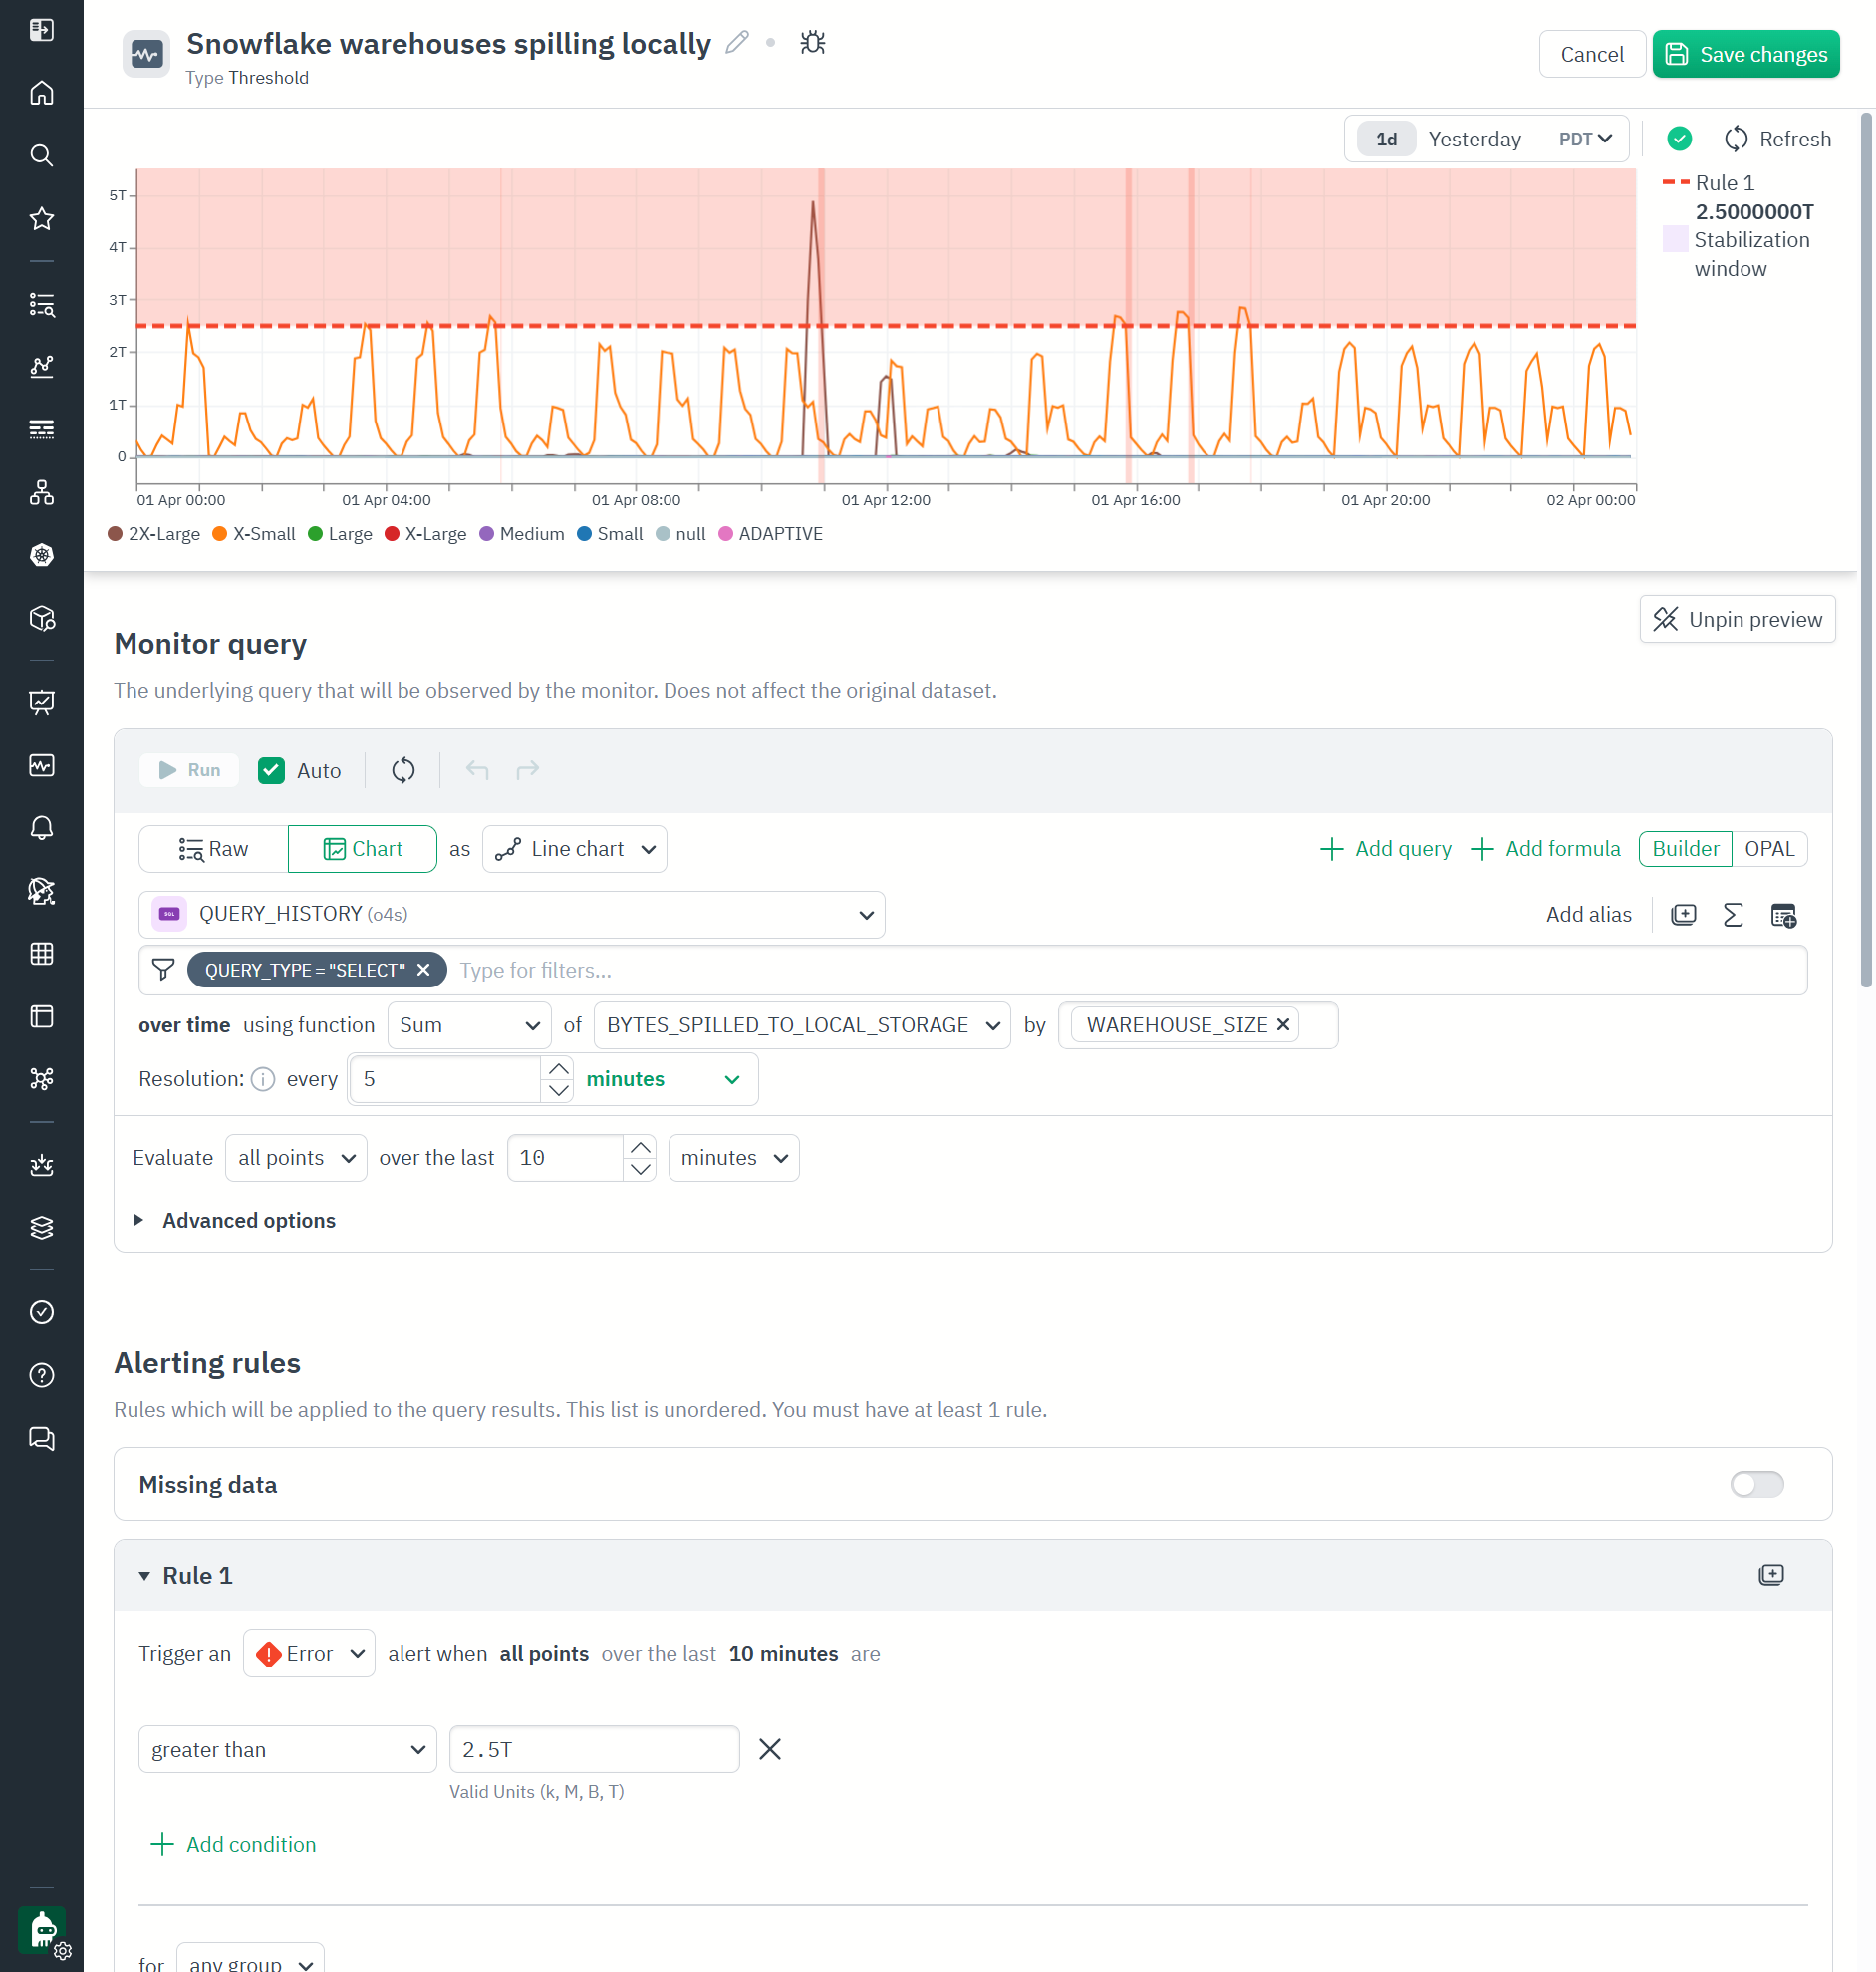
Here is another example of QUERY_HISTORY where we graphed all SELECT queries BYTES_SPILLED_TO_LOCAL_STORAGE by warehouse size:
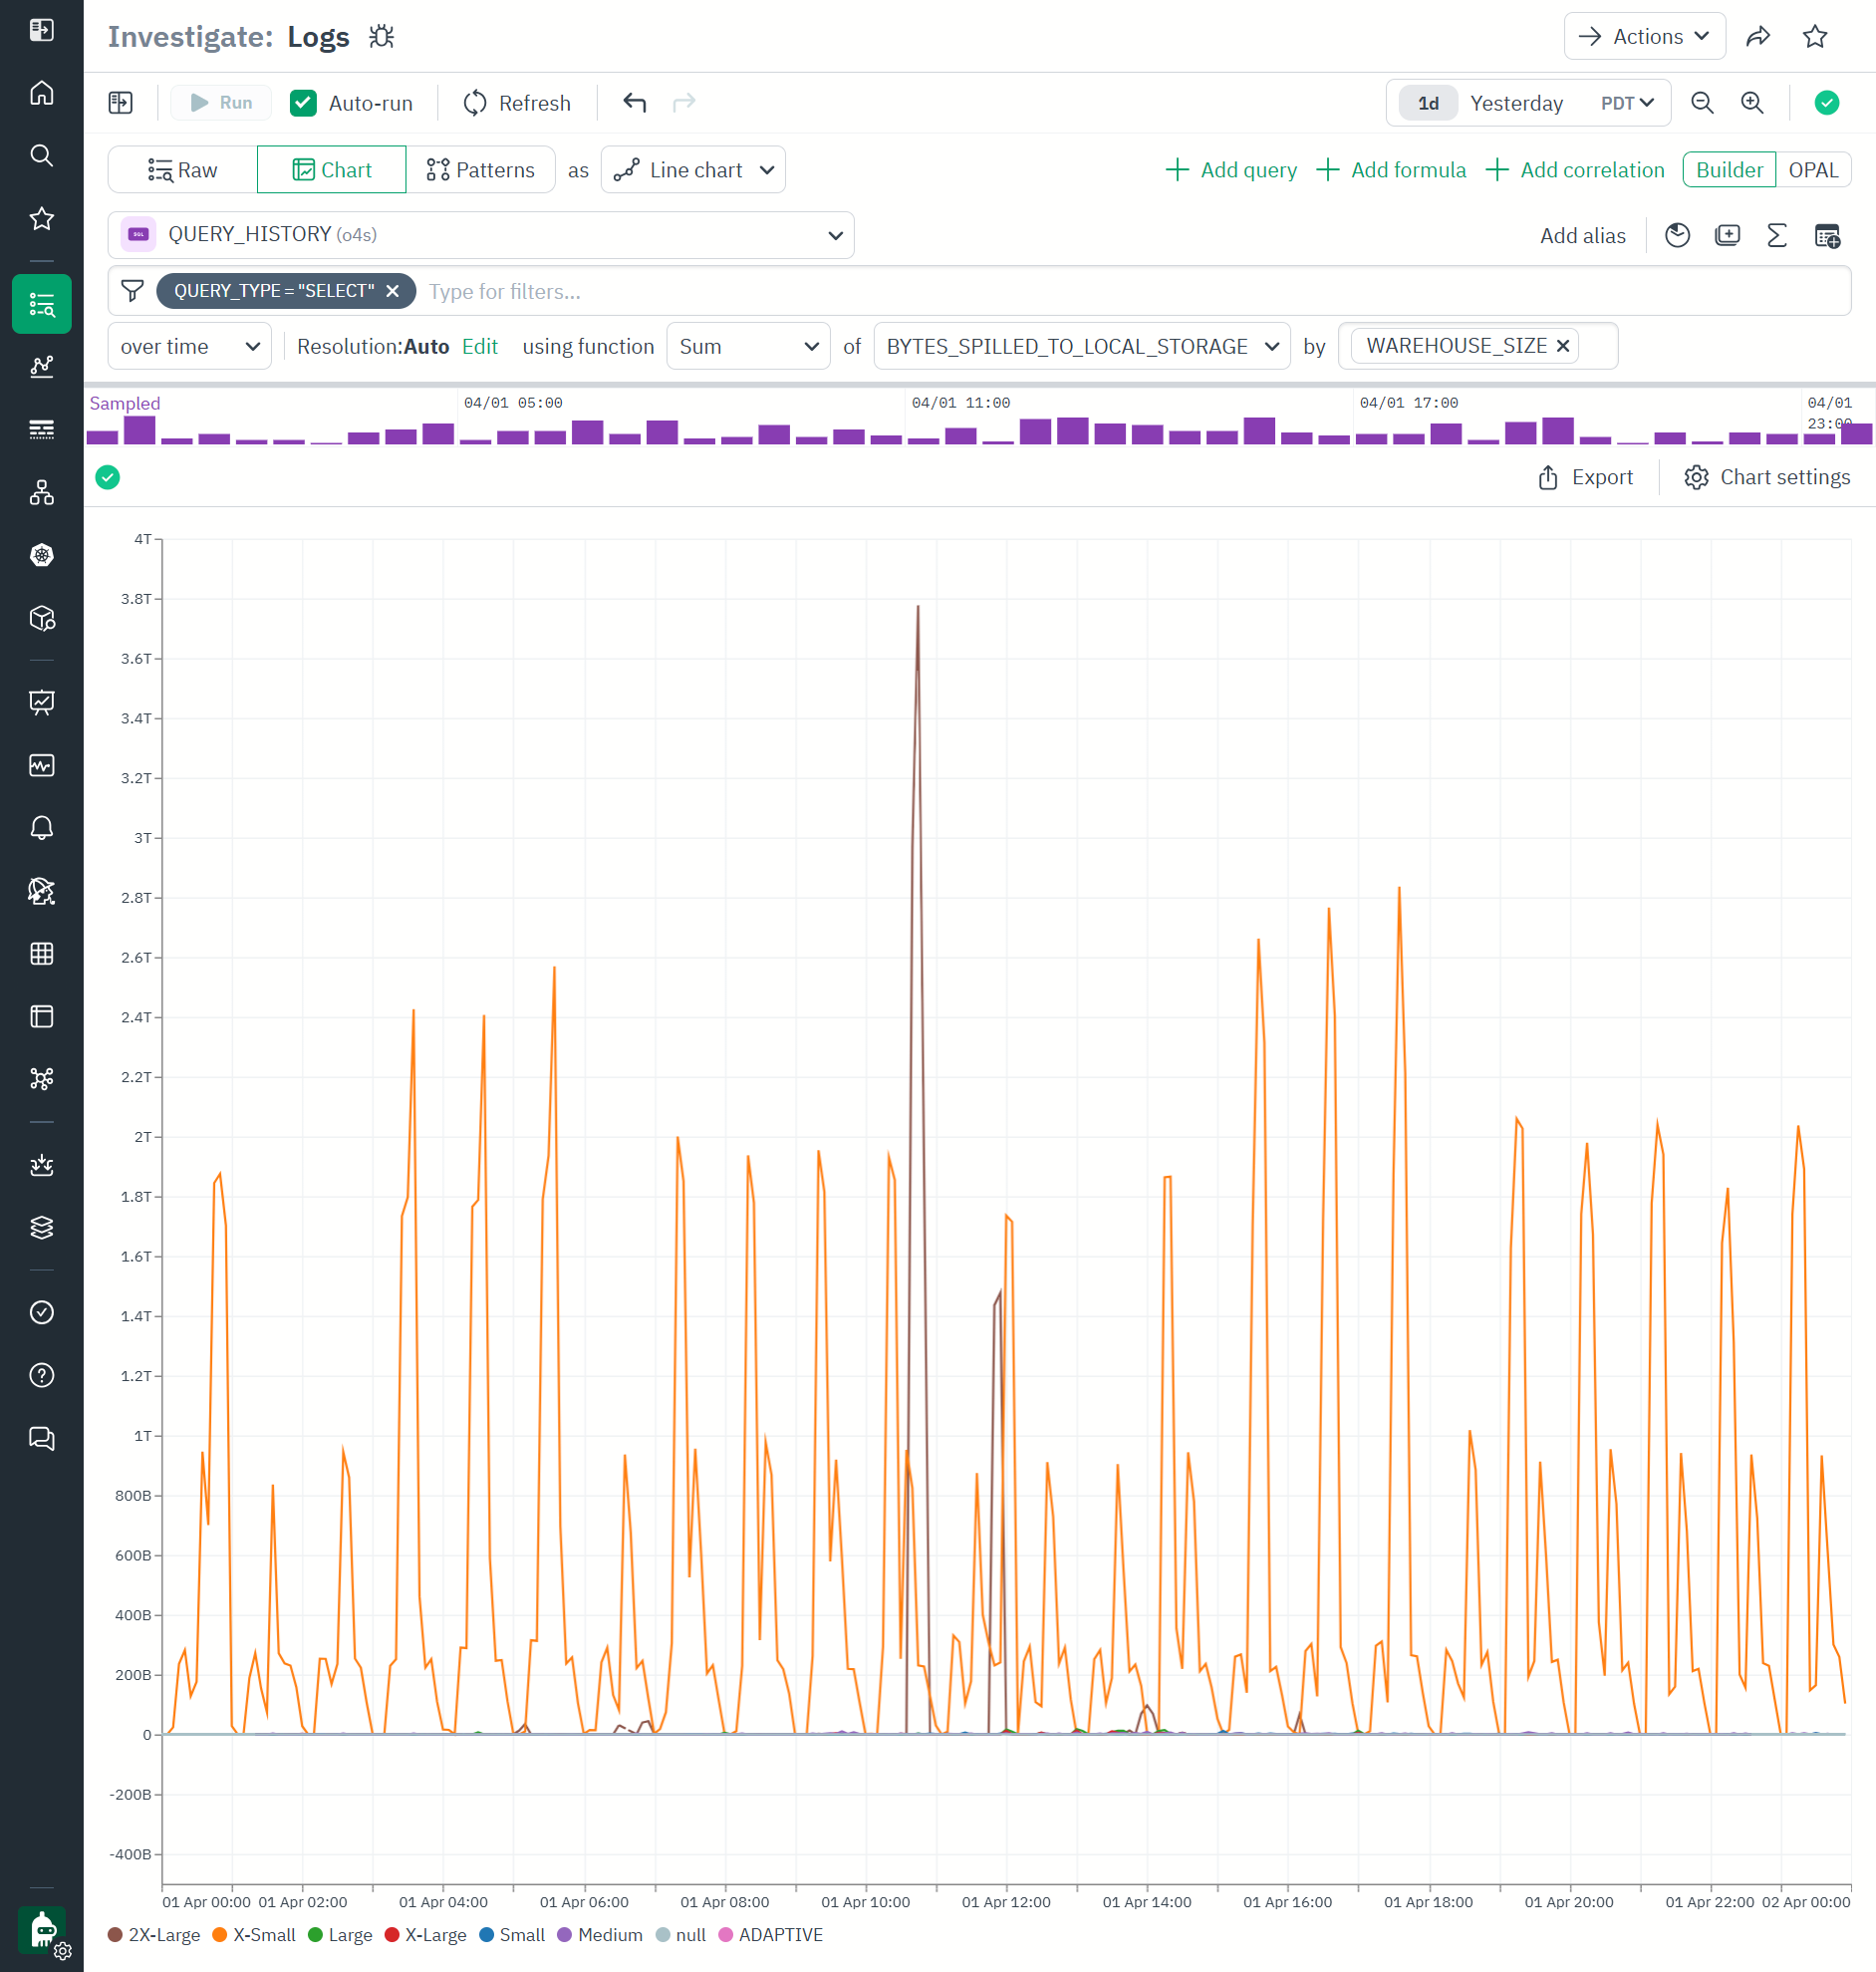
We can easily turn this into a monitor by clicking Actions\Create Monitor . In this example, we identified that alert would trigger when cumulative sum of spilling by warehouse size is higher than 2.5TB for longer than 10 minutes, and it would have triggered 3 times in the given one day as indicated by the graph above.
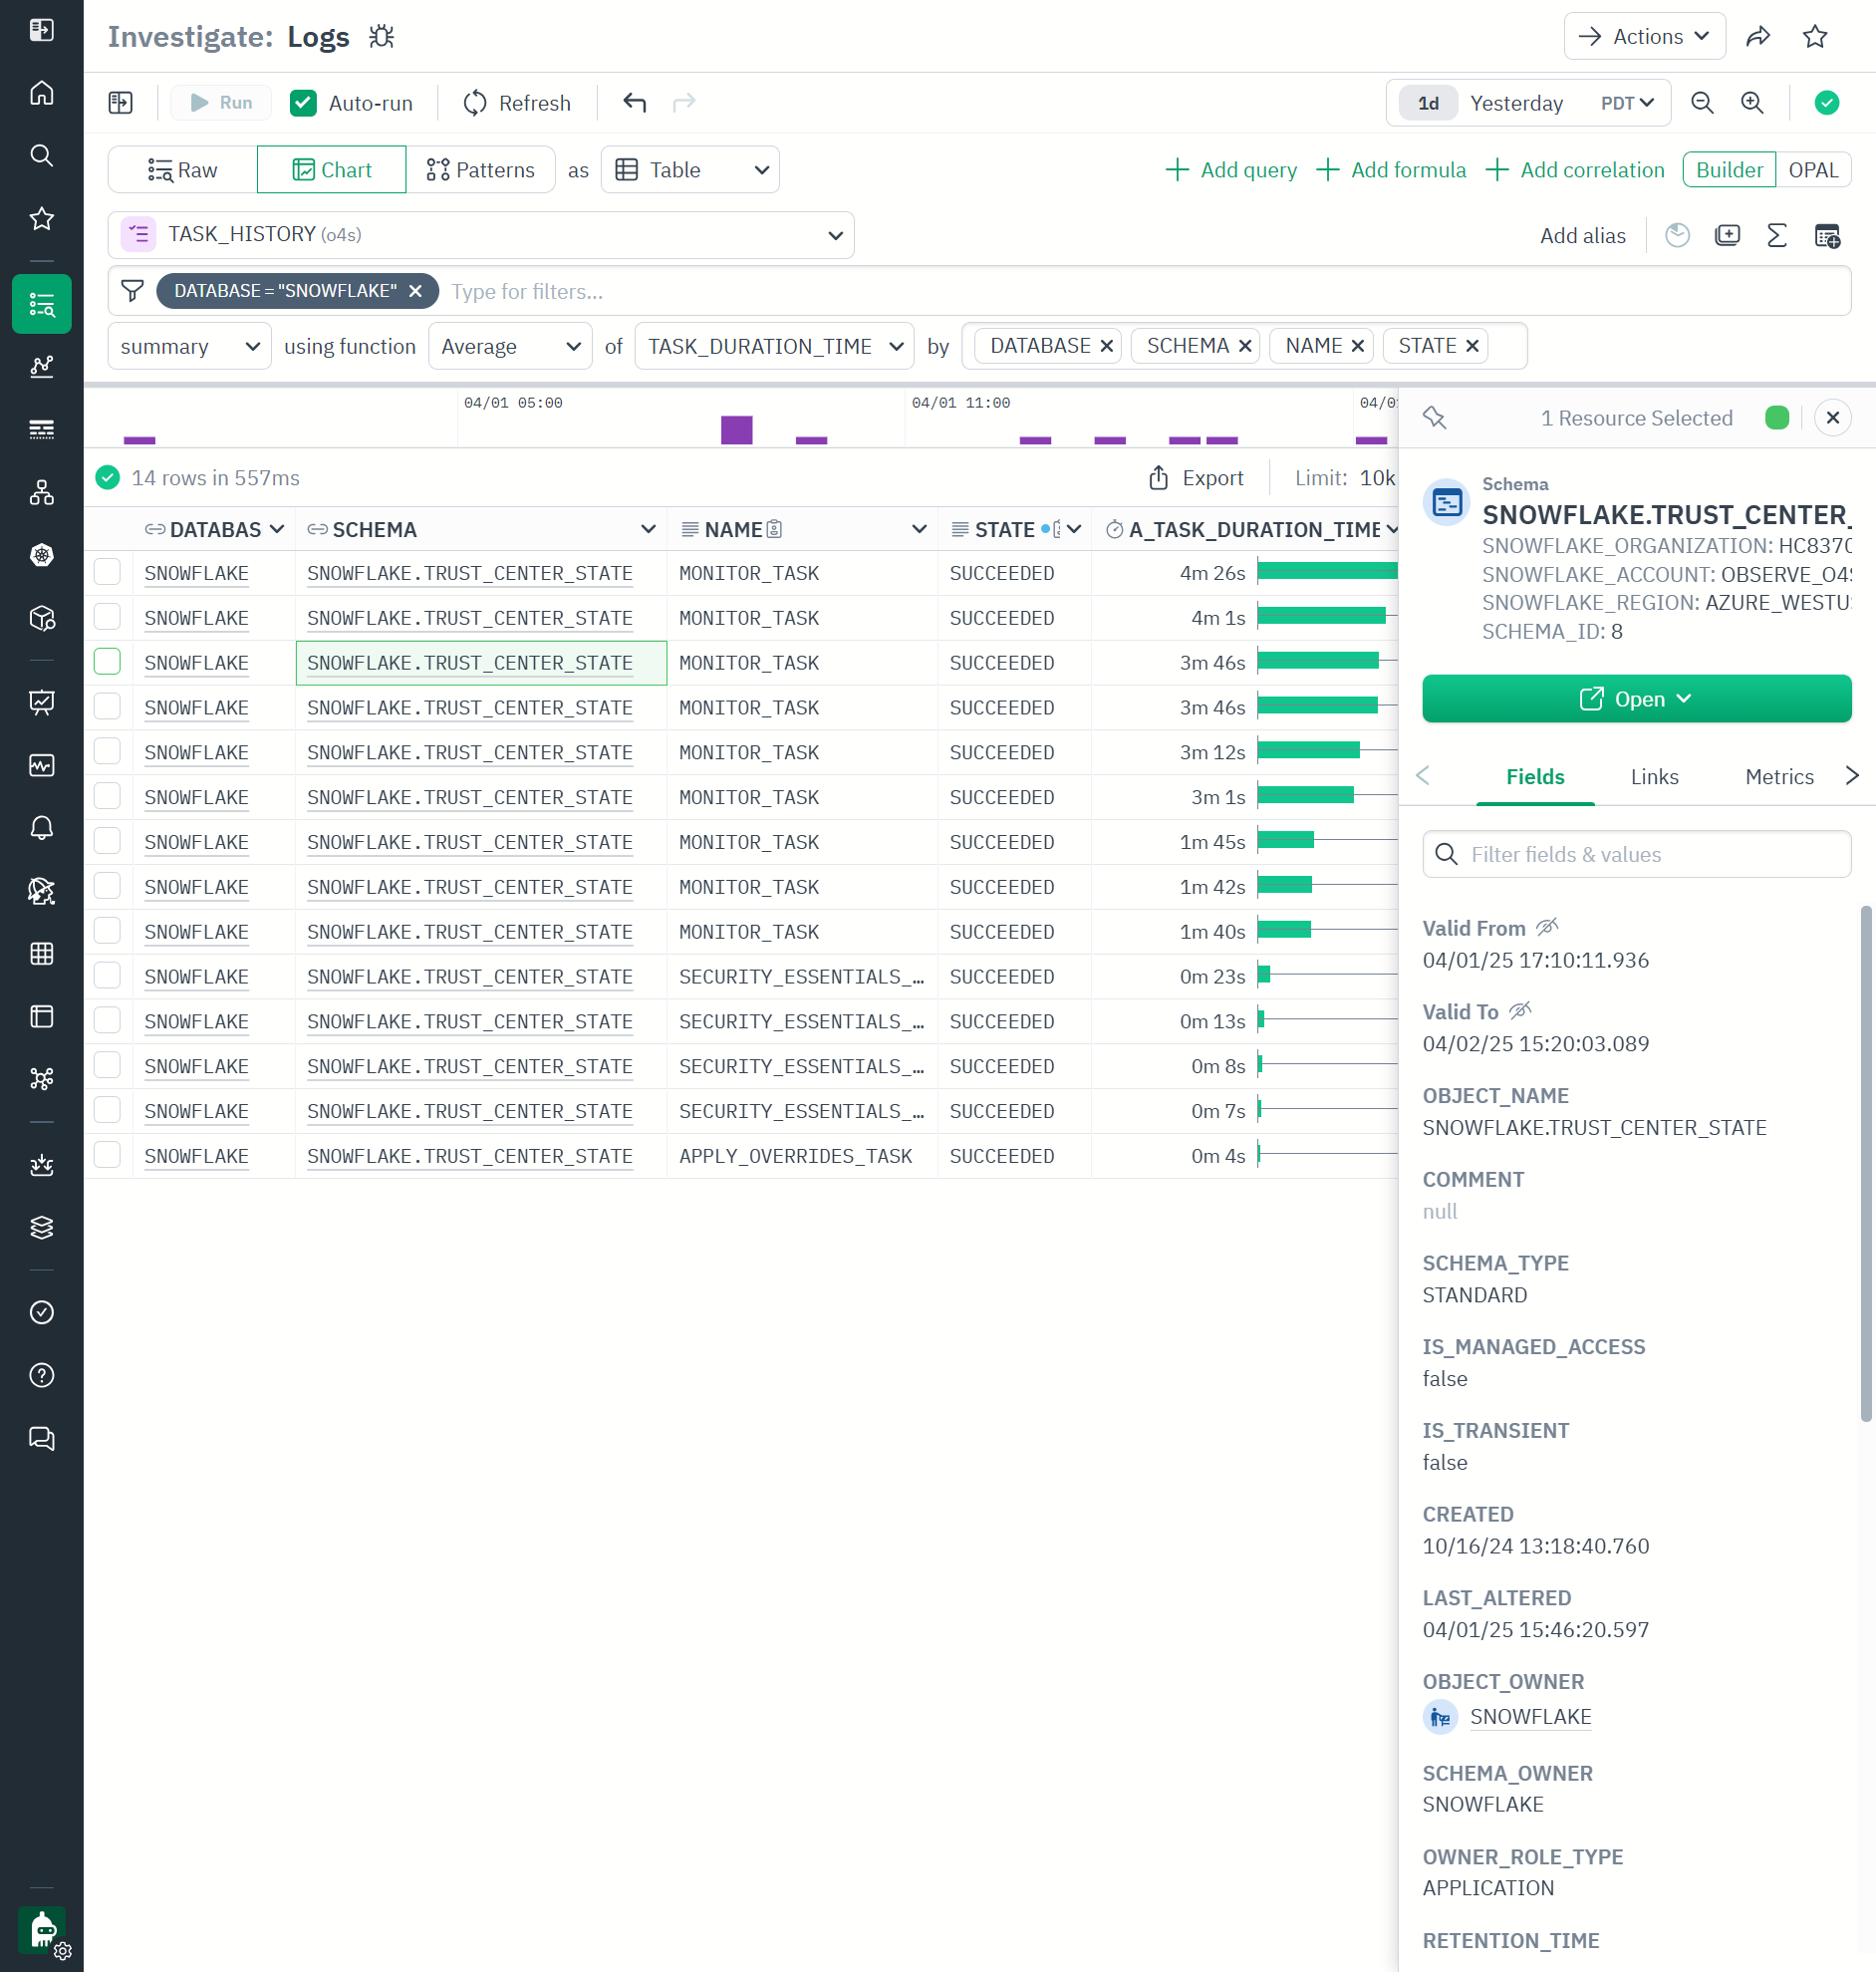
TASK_HISTORY dataset is based on ❄️TASK_HISTORY view and can also be explored with Log Explorer. Here is an example of looking at tasks in ❄️SNOWFLAKE database) (looks like they are mostly ❄️Trust Center) and their execution states for 1 day.
Understand Snowflake costs with Observe
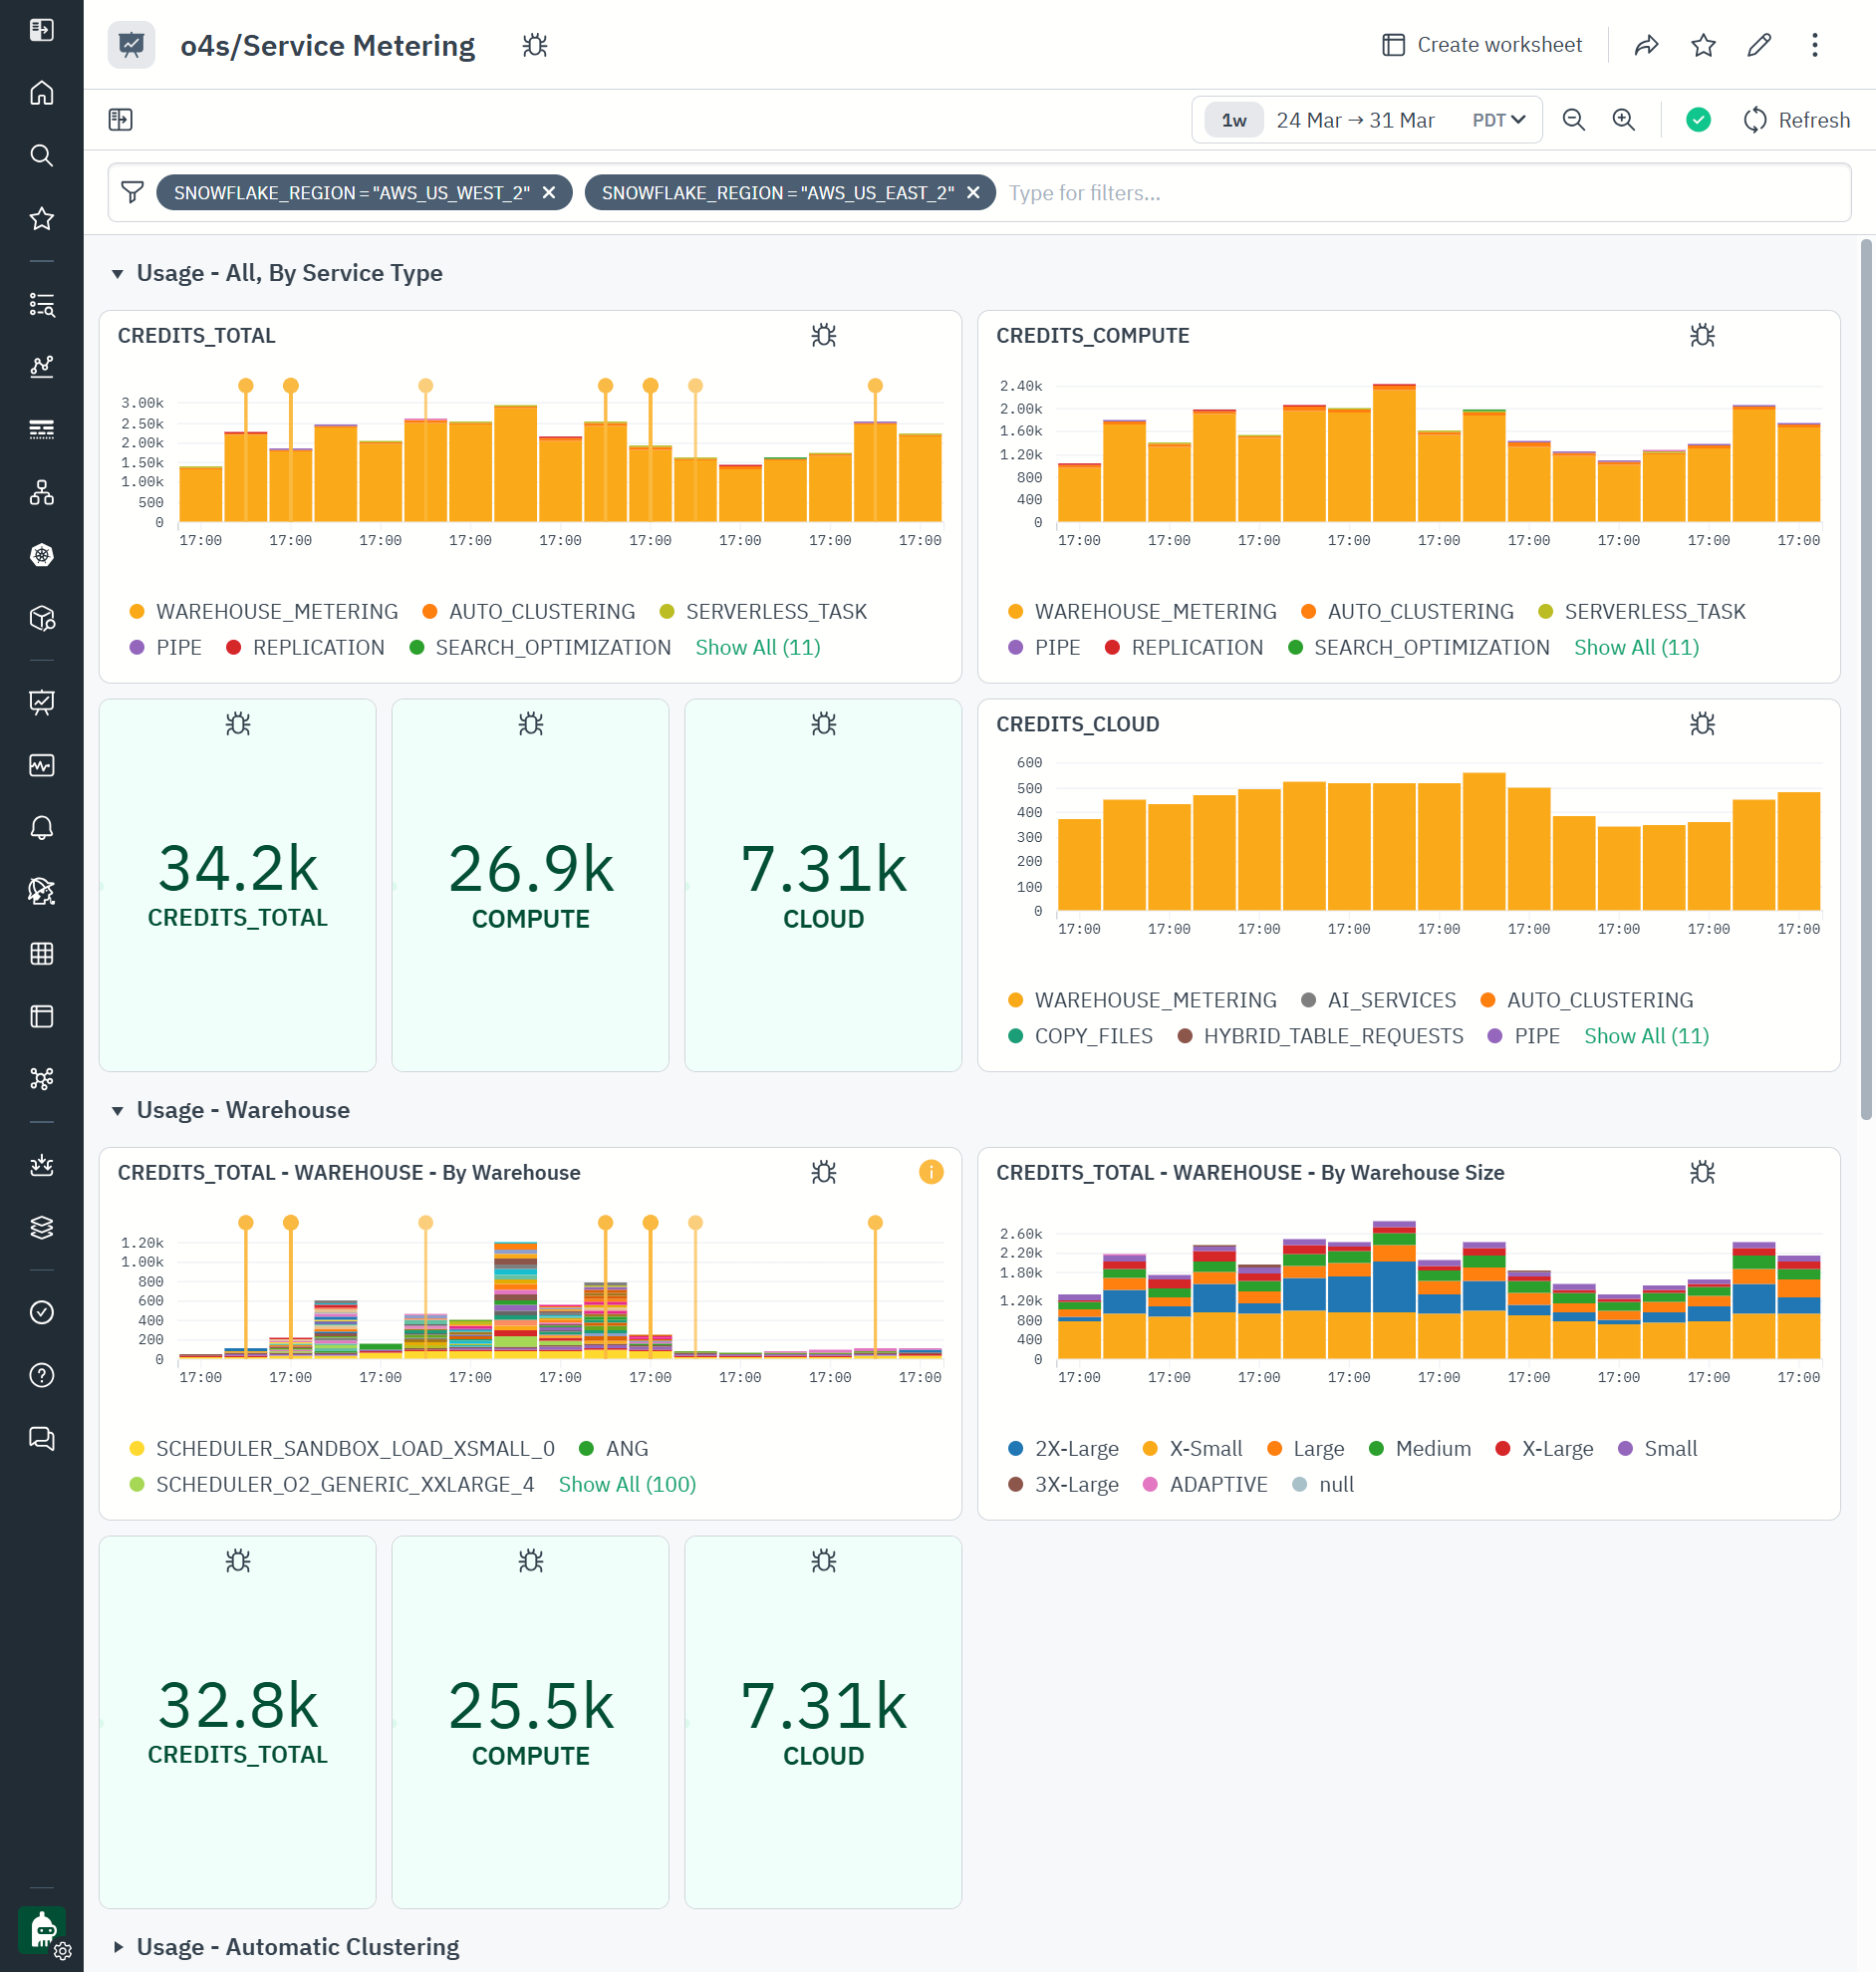
Snowflake Service Metering dashboard takes data from ❄️METERING_HISTORY view and enriches it with metadata about the objects that report spend.
In this example, we are looking at 1 week of spend in all the accounts in the AWS_US_WEST_2 and AWS_US_EAST_2 regions. The graphs above show that - unsurprisingly - WAREHOUSE_METERING dominates. The CREDITS_TOTAL - WAREHOUSE - By Warehouse Size Shows that 50% of WAREHOUSE_METERING is spent by XS warehouses, with next driver being 2XL. This data can be used to understand the patterns of consumption.
Observe Metrics Explorer provides for additional advanced exploration of these and all other metrics.
Snowflake entities as Observe Resources
All main Snowflake entities, such as databases, schemata, tables, views, functions, stored procedures, secrets, and sequences, are provided in Observe as Resource Datasets.
Resource datasets store objects the full history, state, and relationships of objects in a temporal-aware state. As the properties of an object change, Observe keeps track of them.
For example, a Table in Snowflake can change number of rows, number of bytes, or have a new property like Automated Clustering turned on.
Observe Resource Explorer provides a very useful interface to explore resources.
In this example, we are looking at snowflake Table resource (powered by ❄️TABLES and ❄️TABLE_STORAGE_METRICS views), filtering to tables that have Automated Clustering feature on, and have more than 10TB in storage. Selecting a single row offers detail pane on the right with links to other detailed dashboards and metrics.
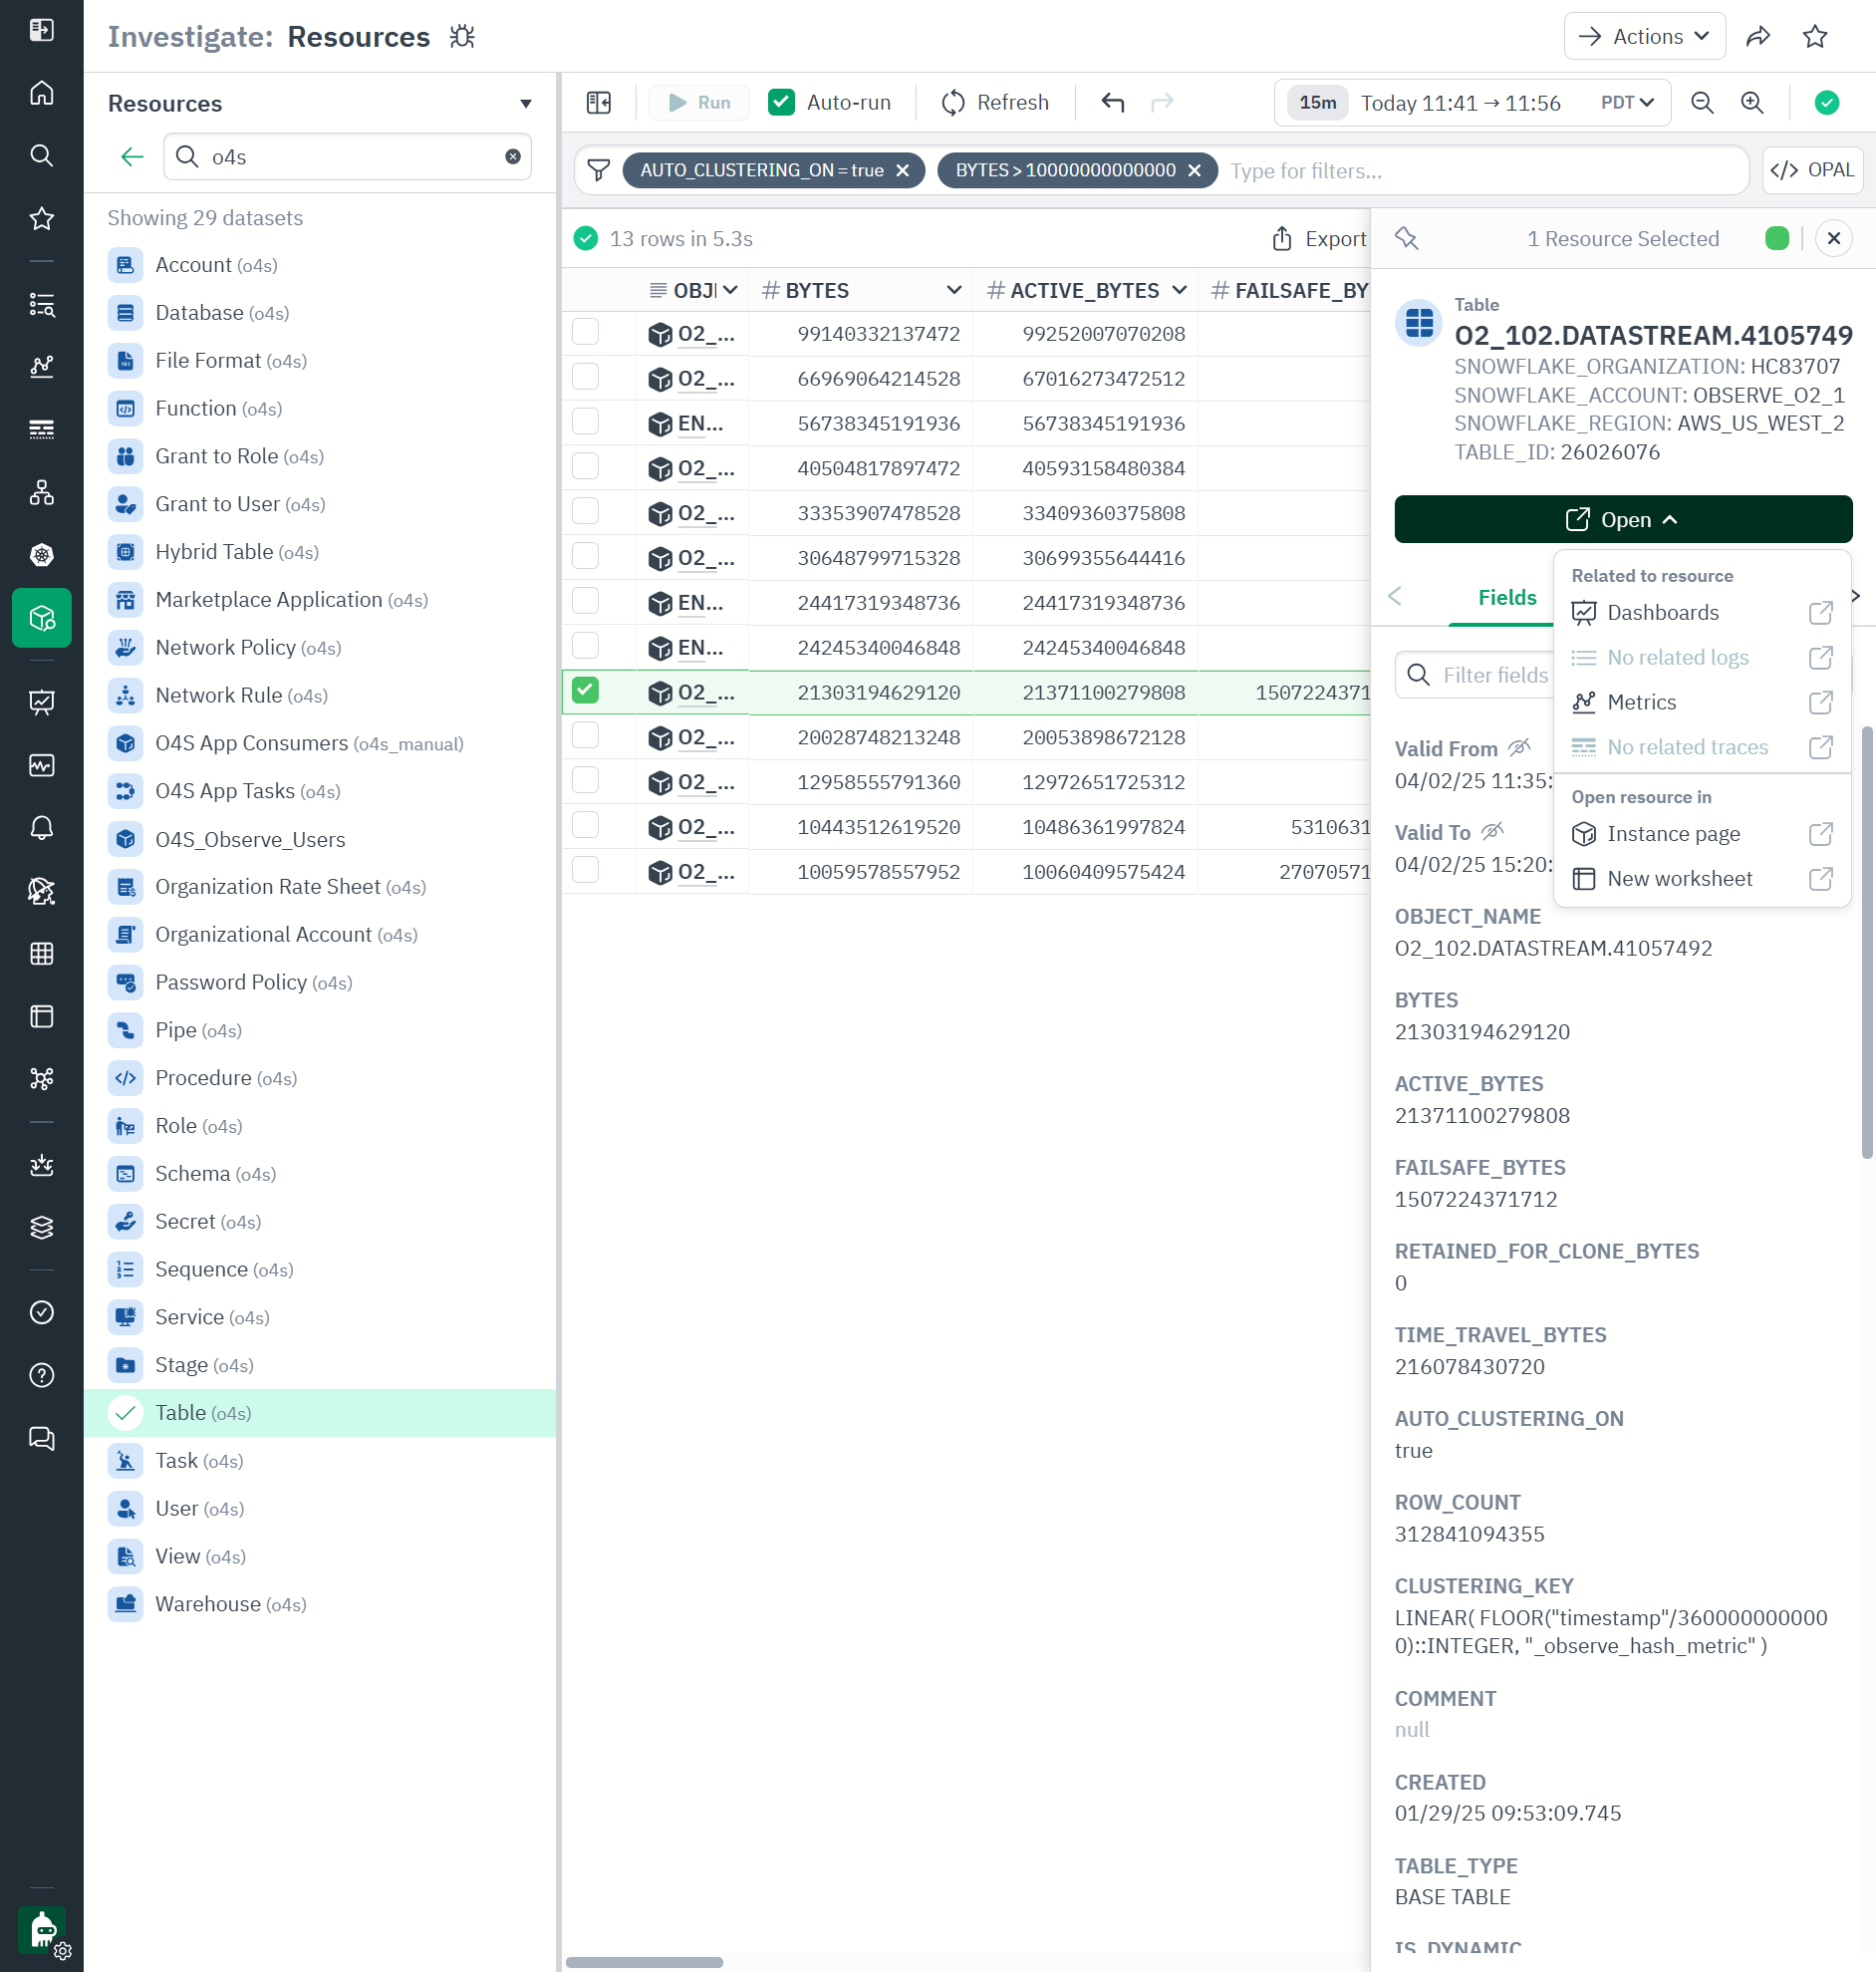
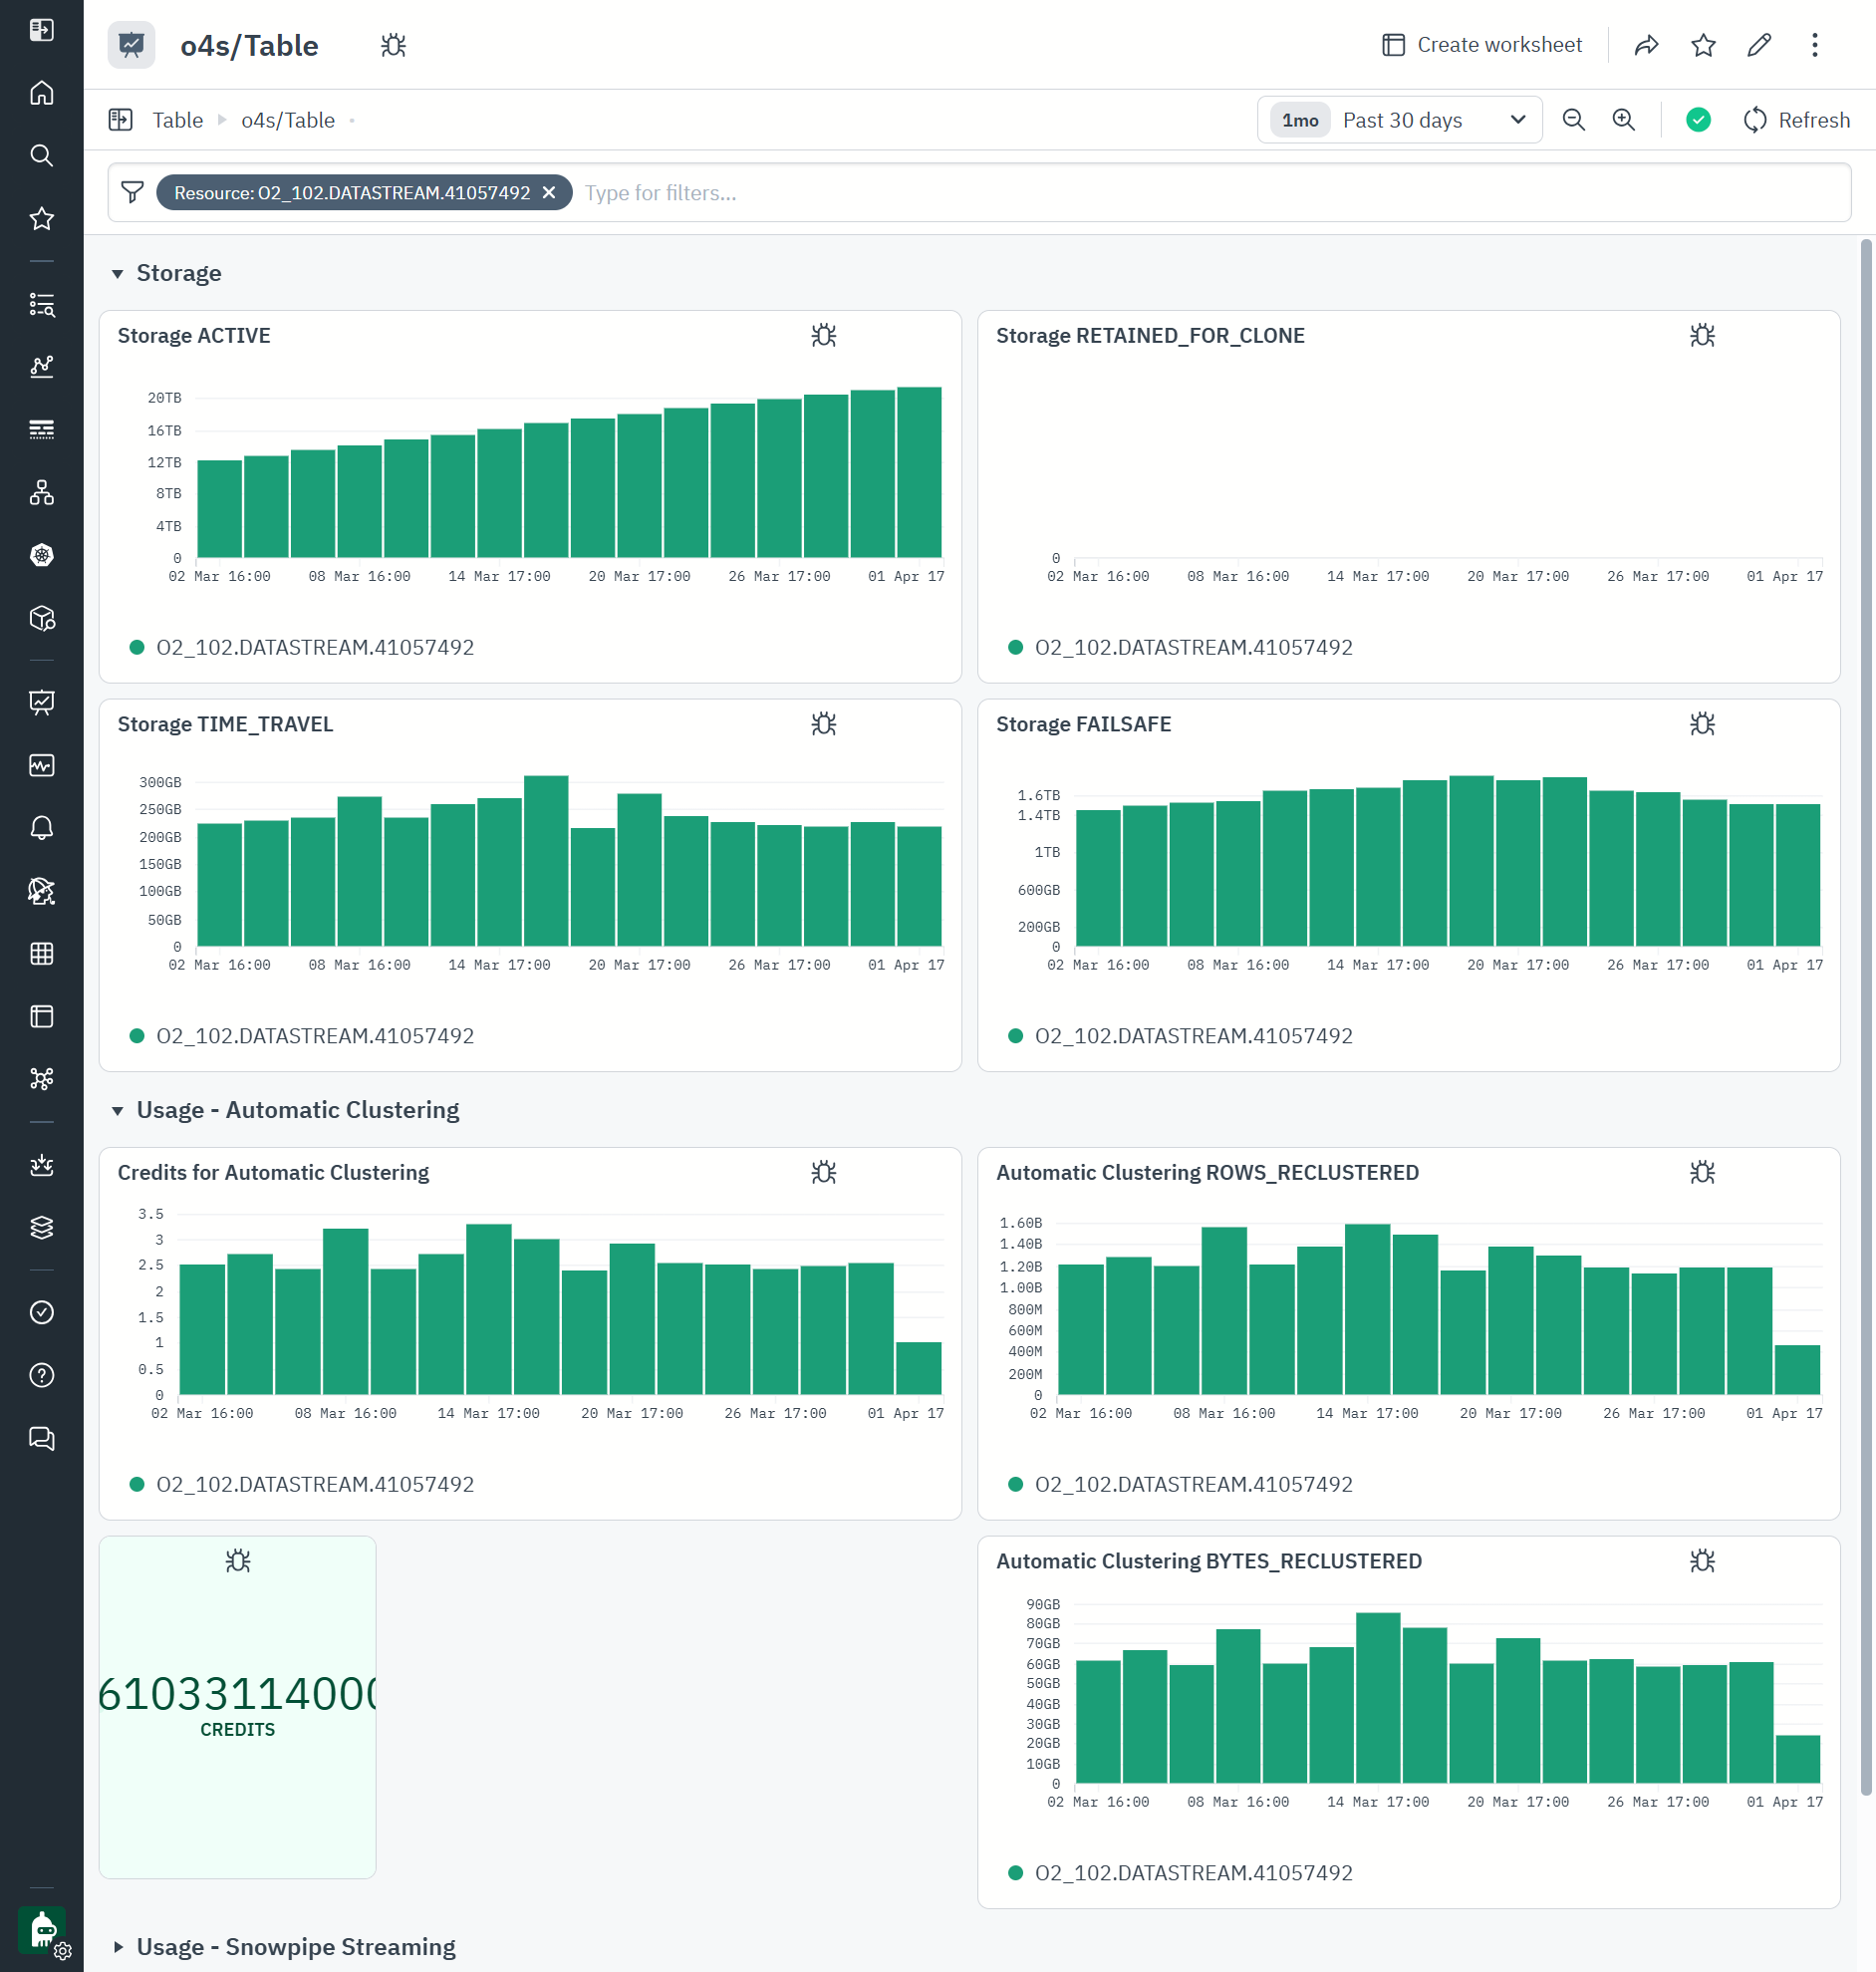
We can click Open\Dashboards to open the Table Dashboard which shows the statistics of the table storage and the consumption of Automated Clustering.
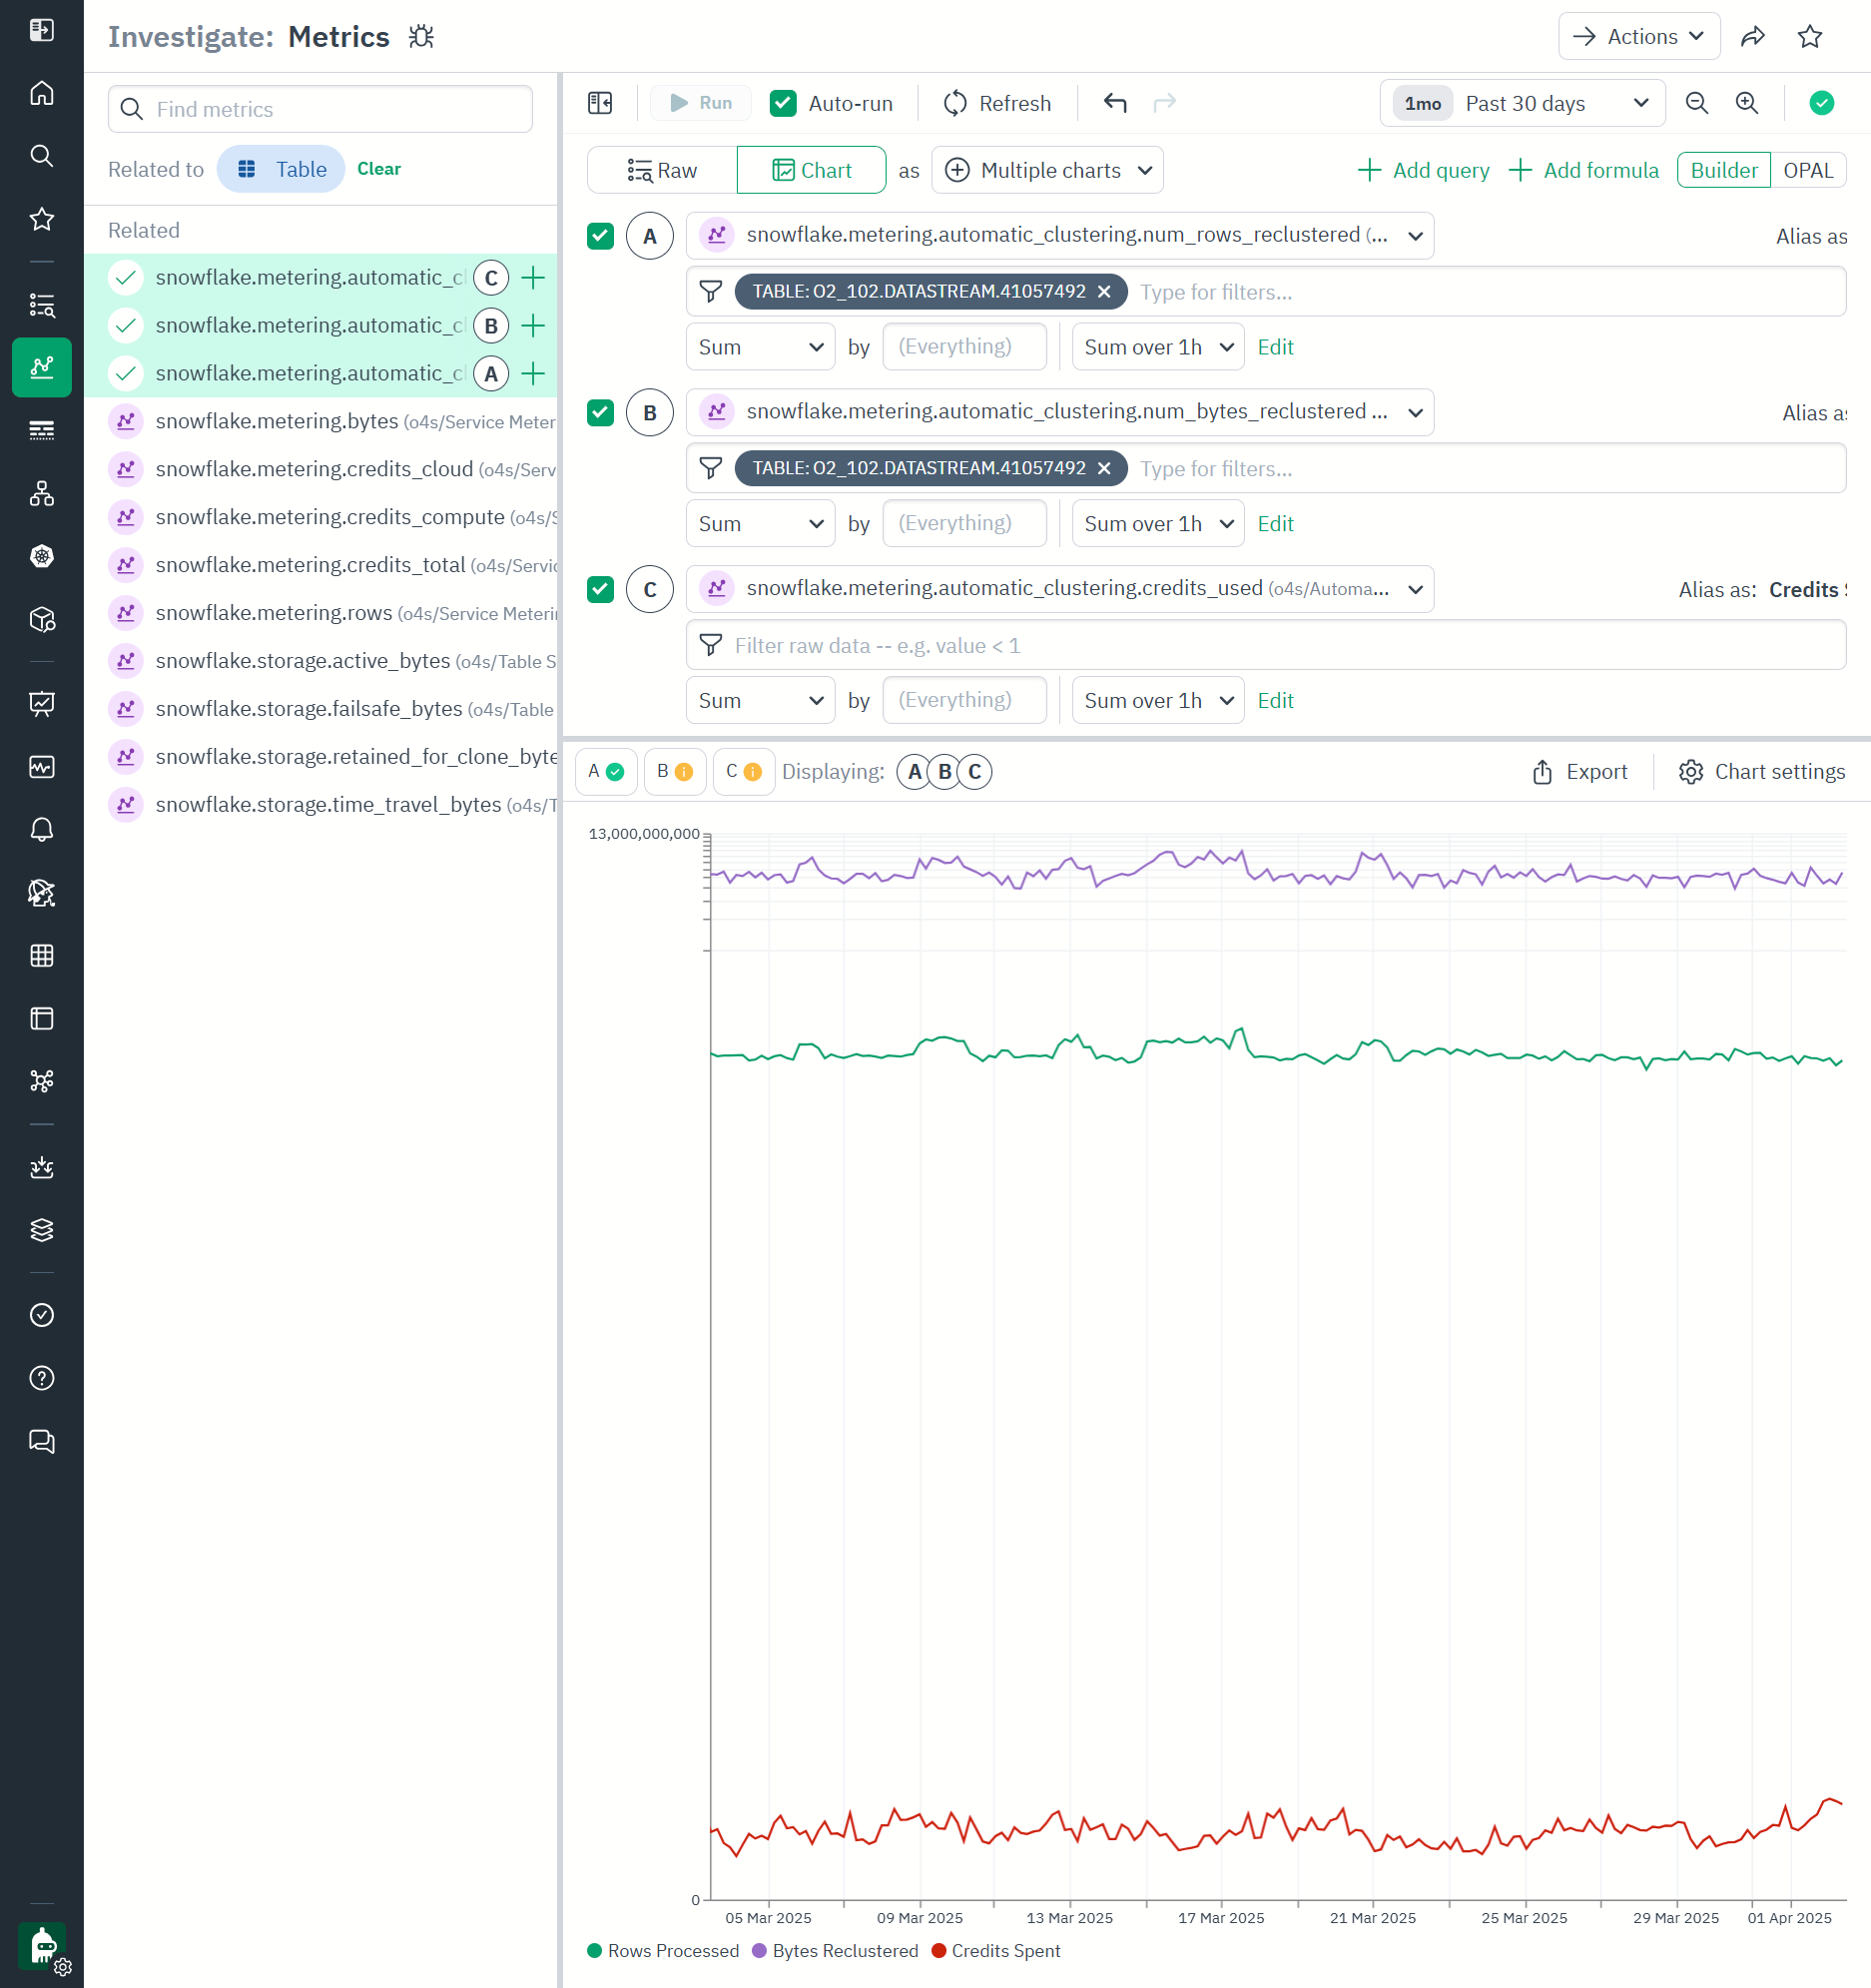
Clicking Open\Metrics takes us to Observe Metrics Explorer where in this example we visualized snowflake.metering.automatic_clustering.num_rows_reclustered, snowflake.metering.automatic_clustering.num_bytes_reclustered and snowflake.metering.automatic_clustering.credits_used for a single table, showing how many credits were spent to move rows around the micropartitions, and how many bytes were processed. We are using logarithmic view to compare wildly different units, which shows that this table’s level of consumption of automatic clustering feature is staying steady without any unexpected spikes as the new data is coming in.
Updated 15 days ago