Explore data
Explorers and Worksheets help you navigate, analyze, and gain insights from you data in Observe.
Share a Worksheet or Dashboard with other users
To share a Worksheet or Dashboard with someone else, use the Share Page URL icon in the top right to copy a link to the clipboard. A URL copied from the browser address bar includes your current context and may not show the intended content. See URL query parameters for more detail on the Observe URL.
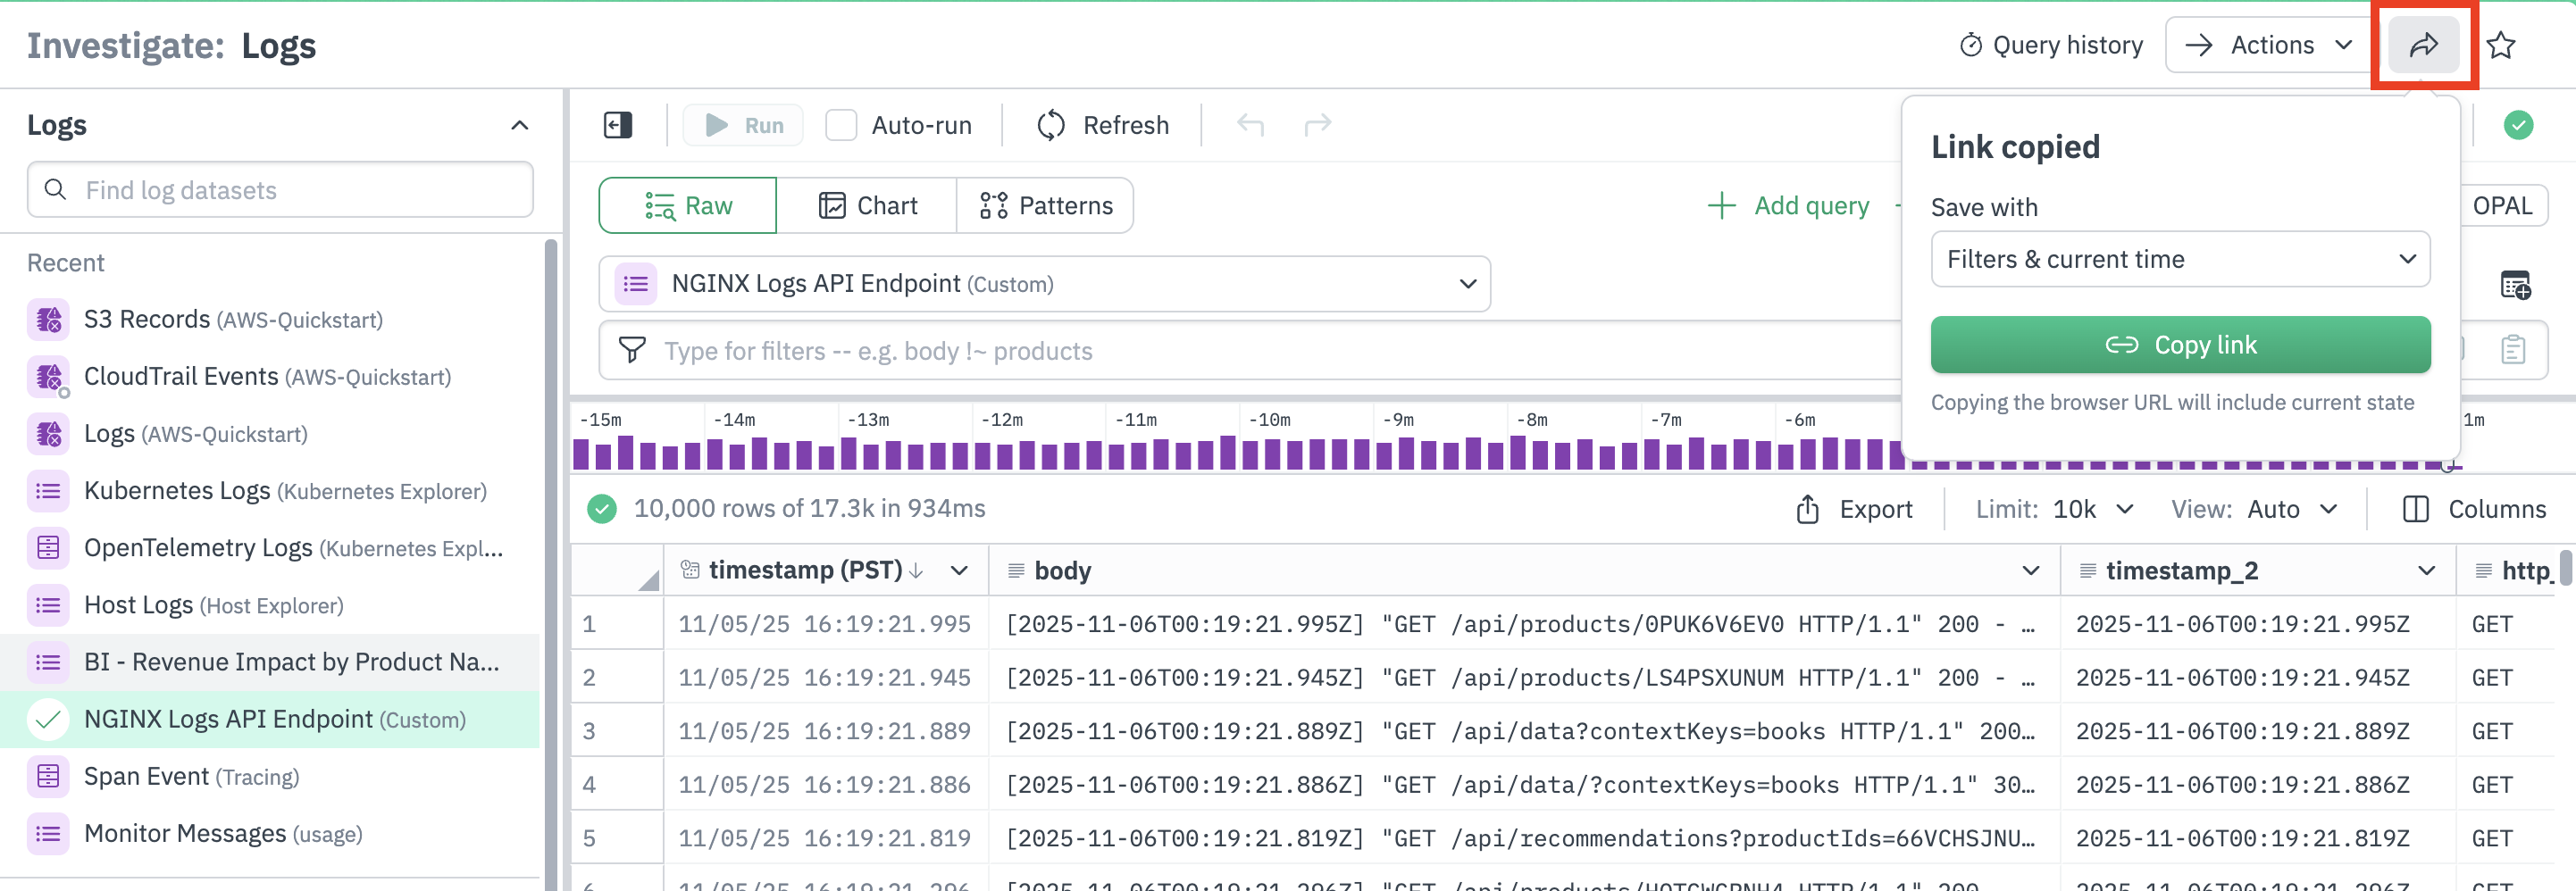
Select one of the options for handling time and data filtration when making a Share link:
- Filters & Current Time – The default behavior attempts to show the recipient exactly what is on the sender’s screen. Filters are set to be the same, and the time window is fixed to the start and end that are currently used. This share link will point at a specific window of time that is receding into the past.
- Filters & Relative Time – Using filters and relative time is designed for dashboard use. It shares the sender’s filters and sets the time window relative to the present. This share link will point at a different time window each time it is opened.
- No Filters & Time – This option removes all filtering and time decisions from the shared link; the recipient sets filters and selects their desired time window if the dynamic Observe default for that dataset is not ideal.
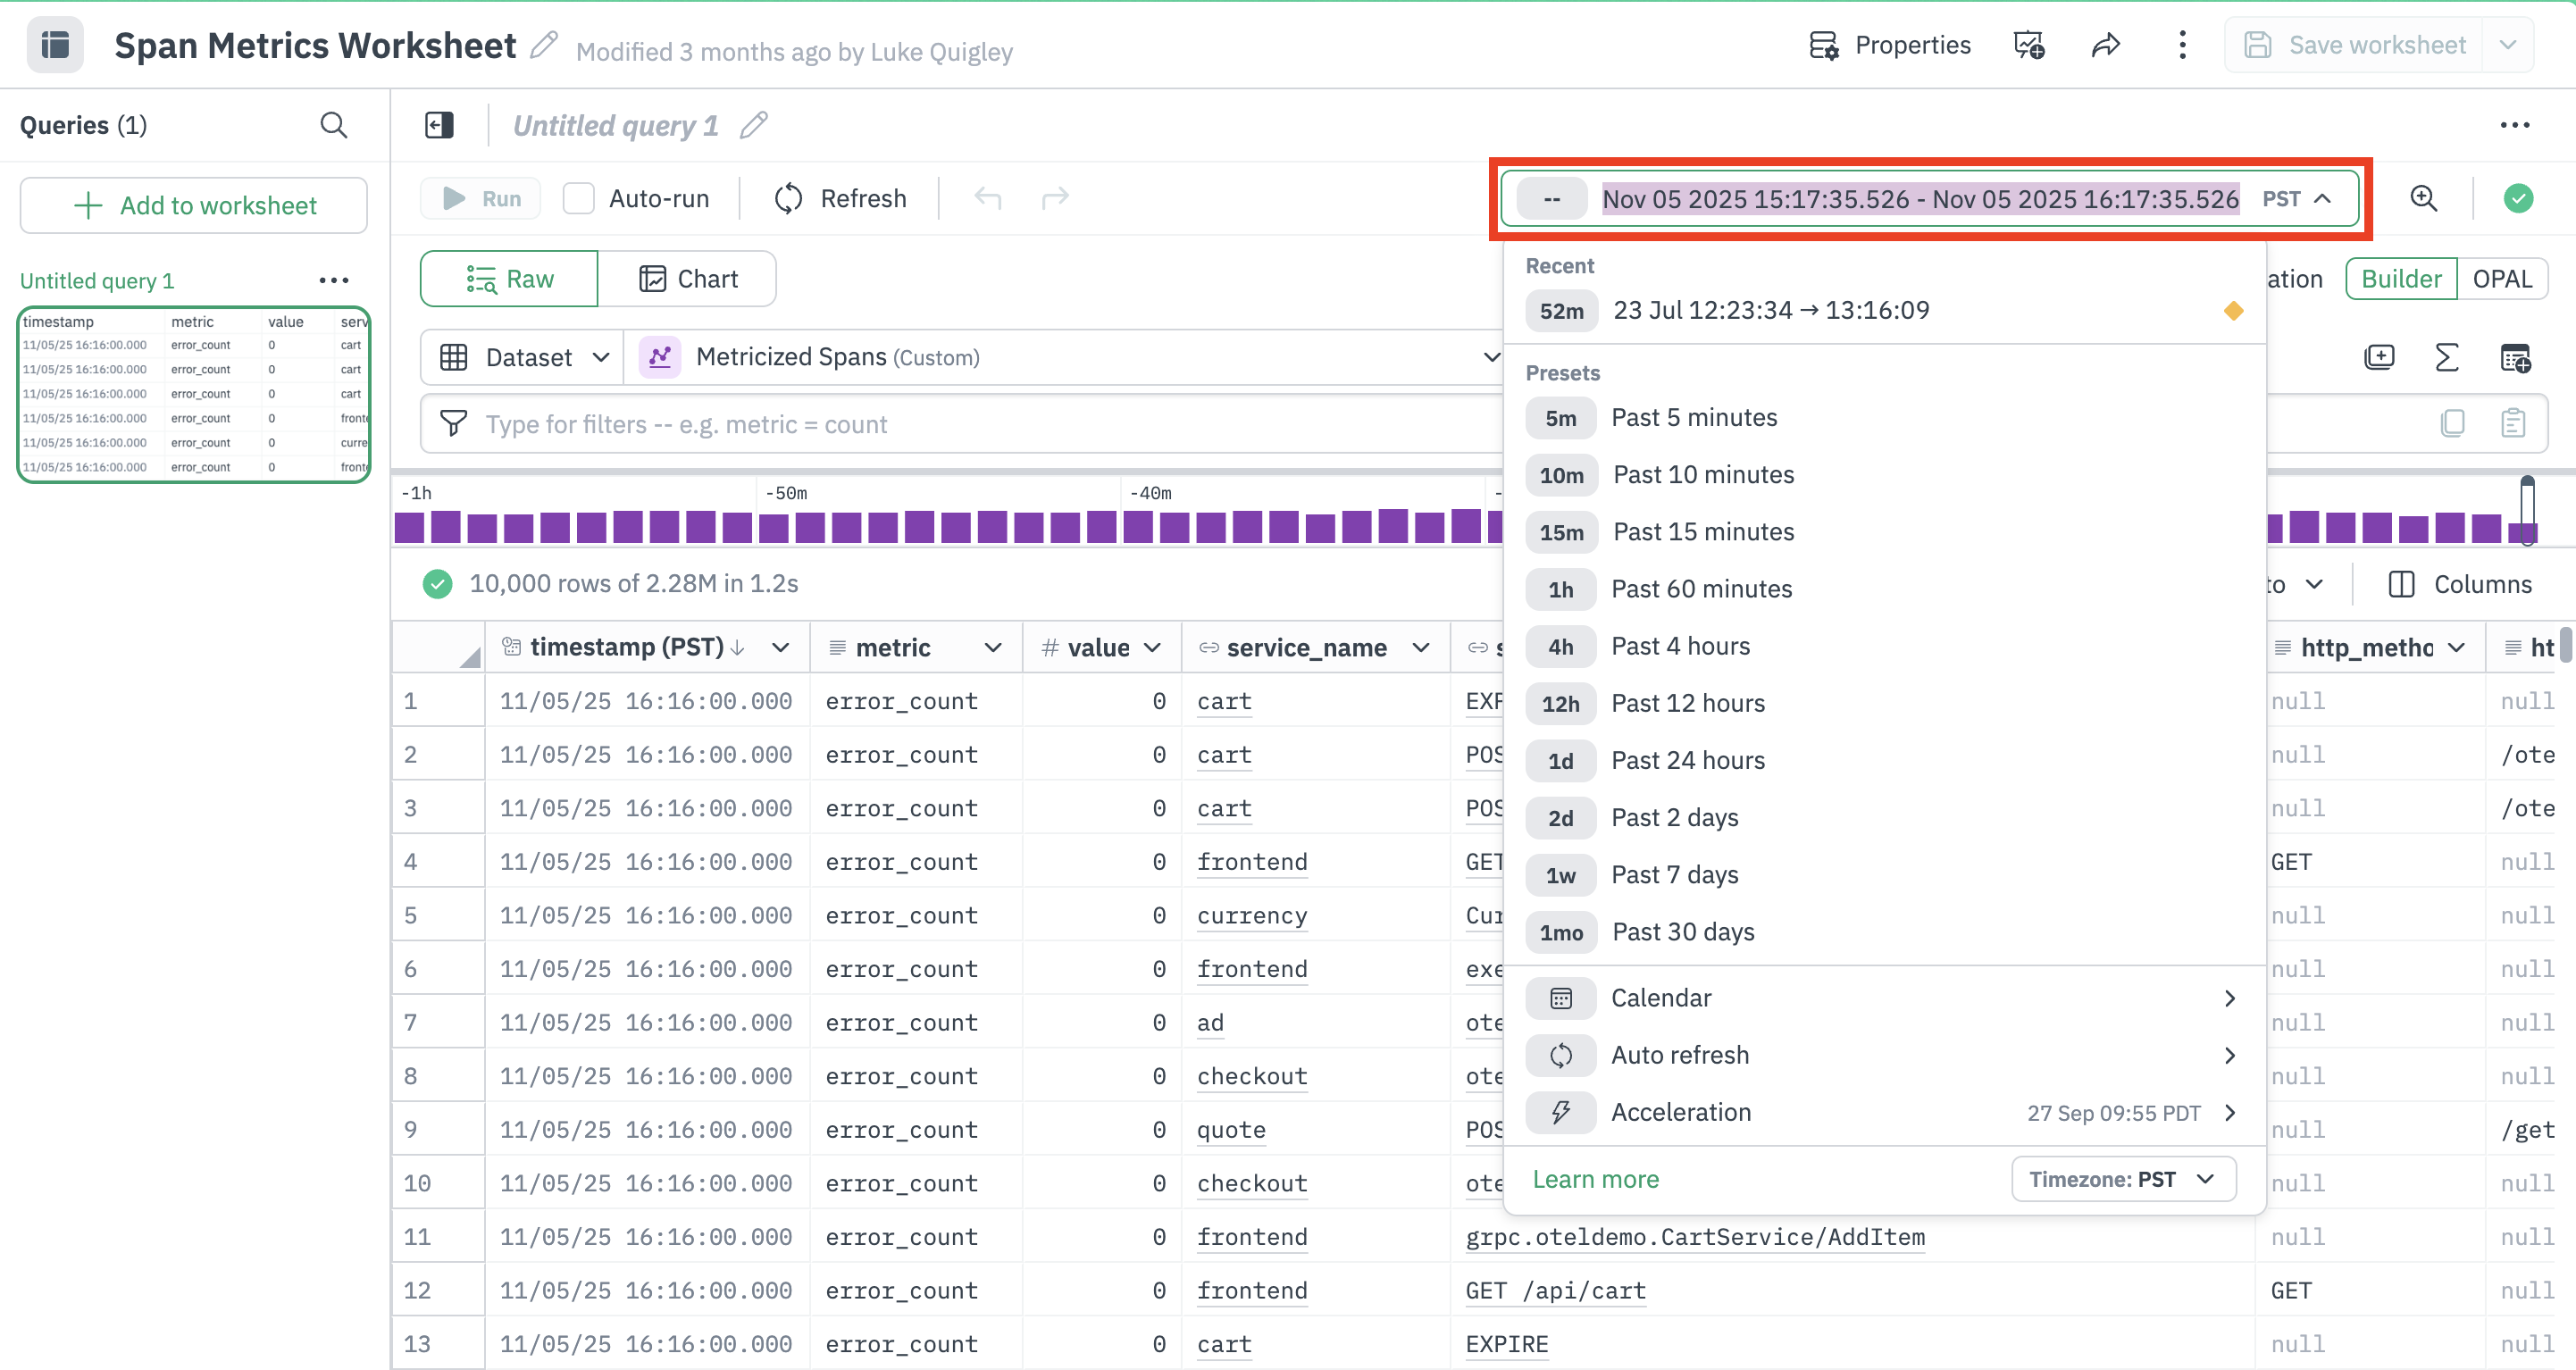
Understand the time window selection
Dashboards, Worksheets, and Explorers operate on a time window set by the time picker in the top right. Many of the options in that picker are relative to the present, such as “Past 15 minutes”, “Last week”, or “Since $DATE”. After your initial selection, the start and end times will transition to static points so that the data in the window does not change. For example, a dashboard with a time filter of “Past 15 minutes” on load will set start and end times, and after a few minutes will adjust the time display to show that the observed time is a fifteen minute window in the past.
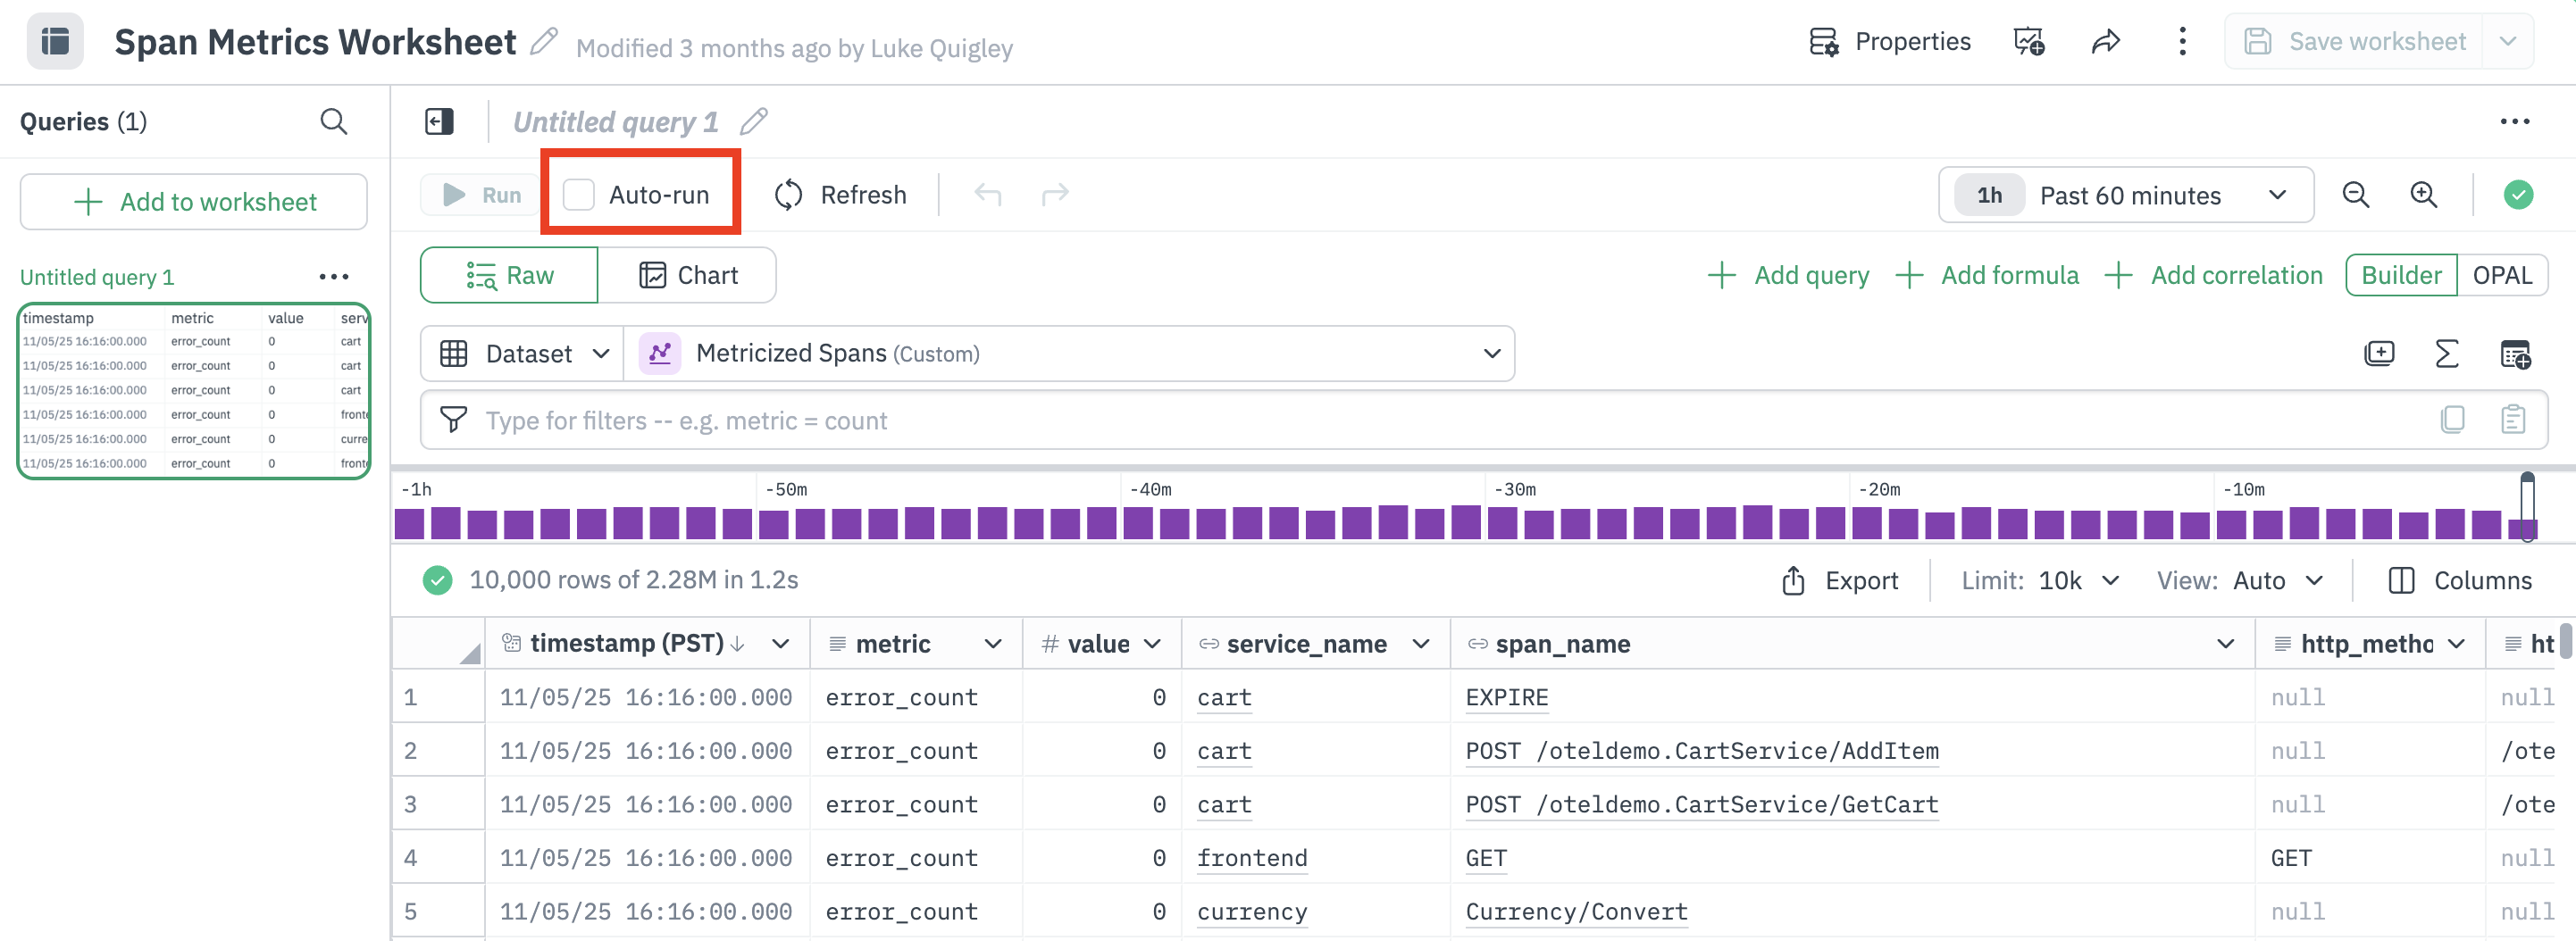
Auto-run queries in Worksheets and Explorers
In Worksheets and Explorers, normal usage involves changing the query. The newly produced query can be run automatically by checking the Auto-run button. When Auto-run is on, changes made with filtering tools cause the query to be reloaded immediately. When Auto-run is off, filter changes do not take effect until the user clicks Run.
Observe Administrators can control the default behavior of Auto-run.
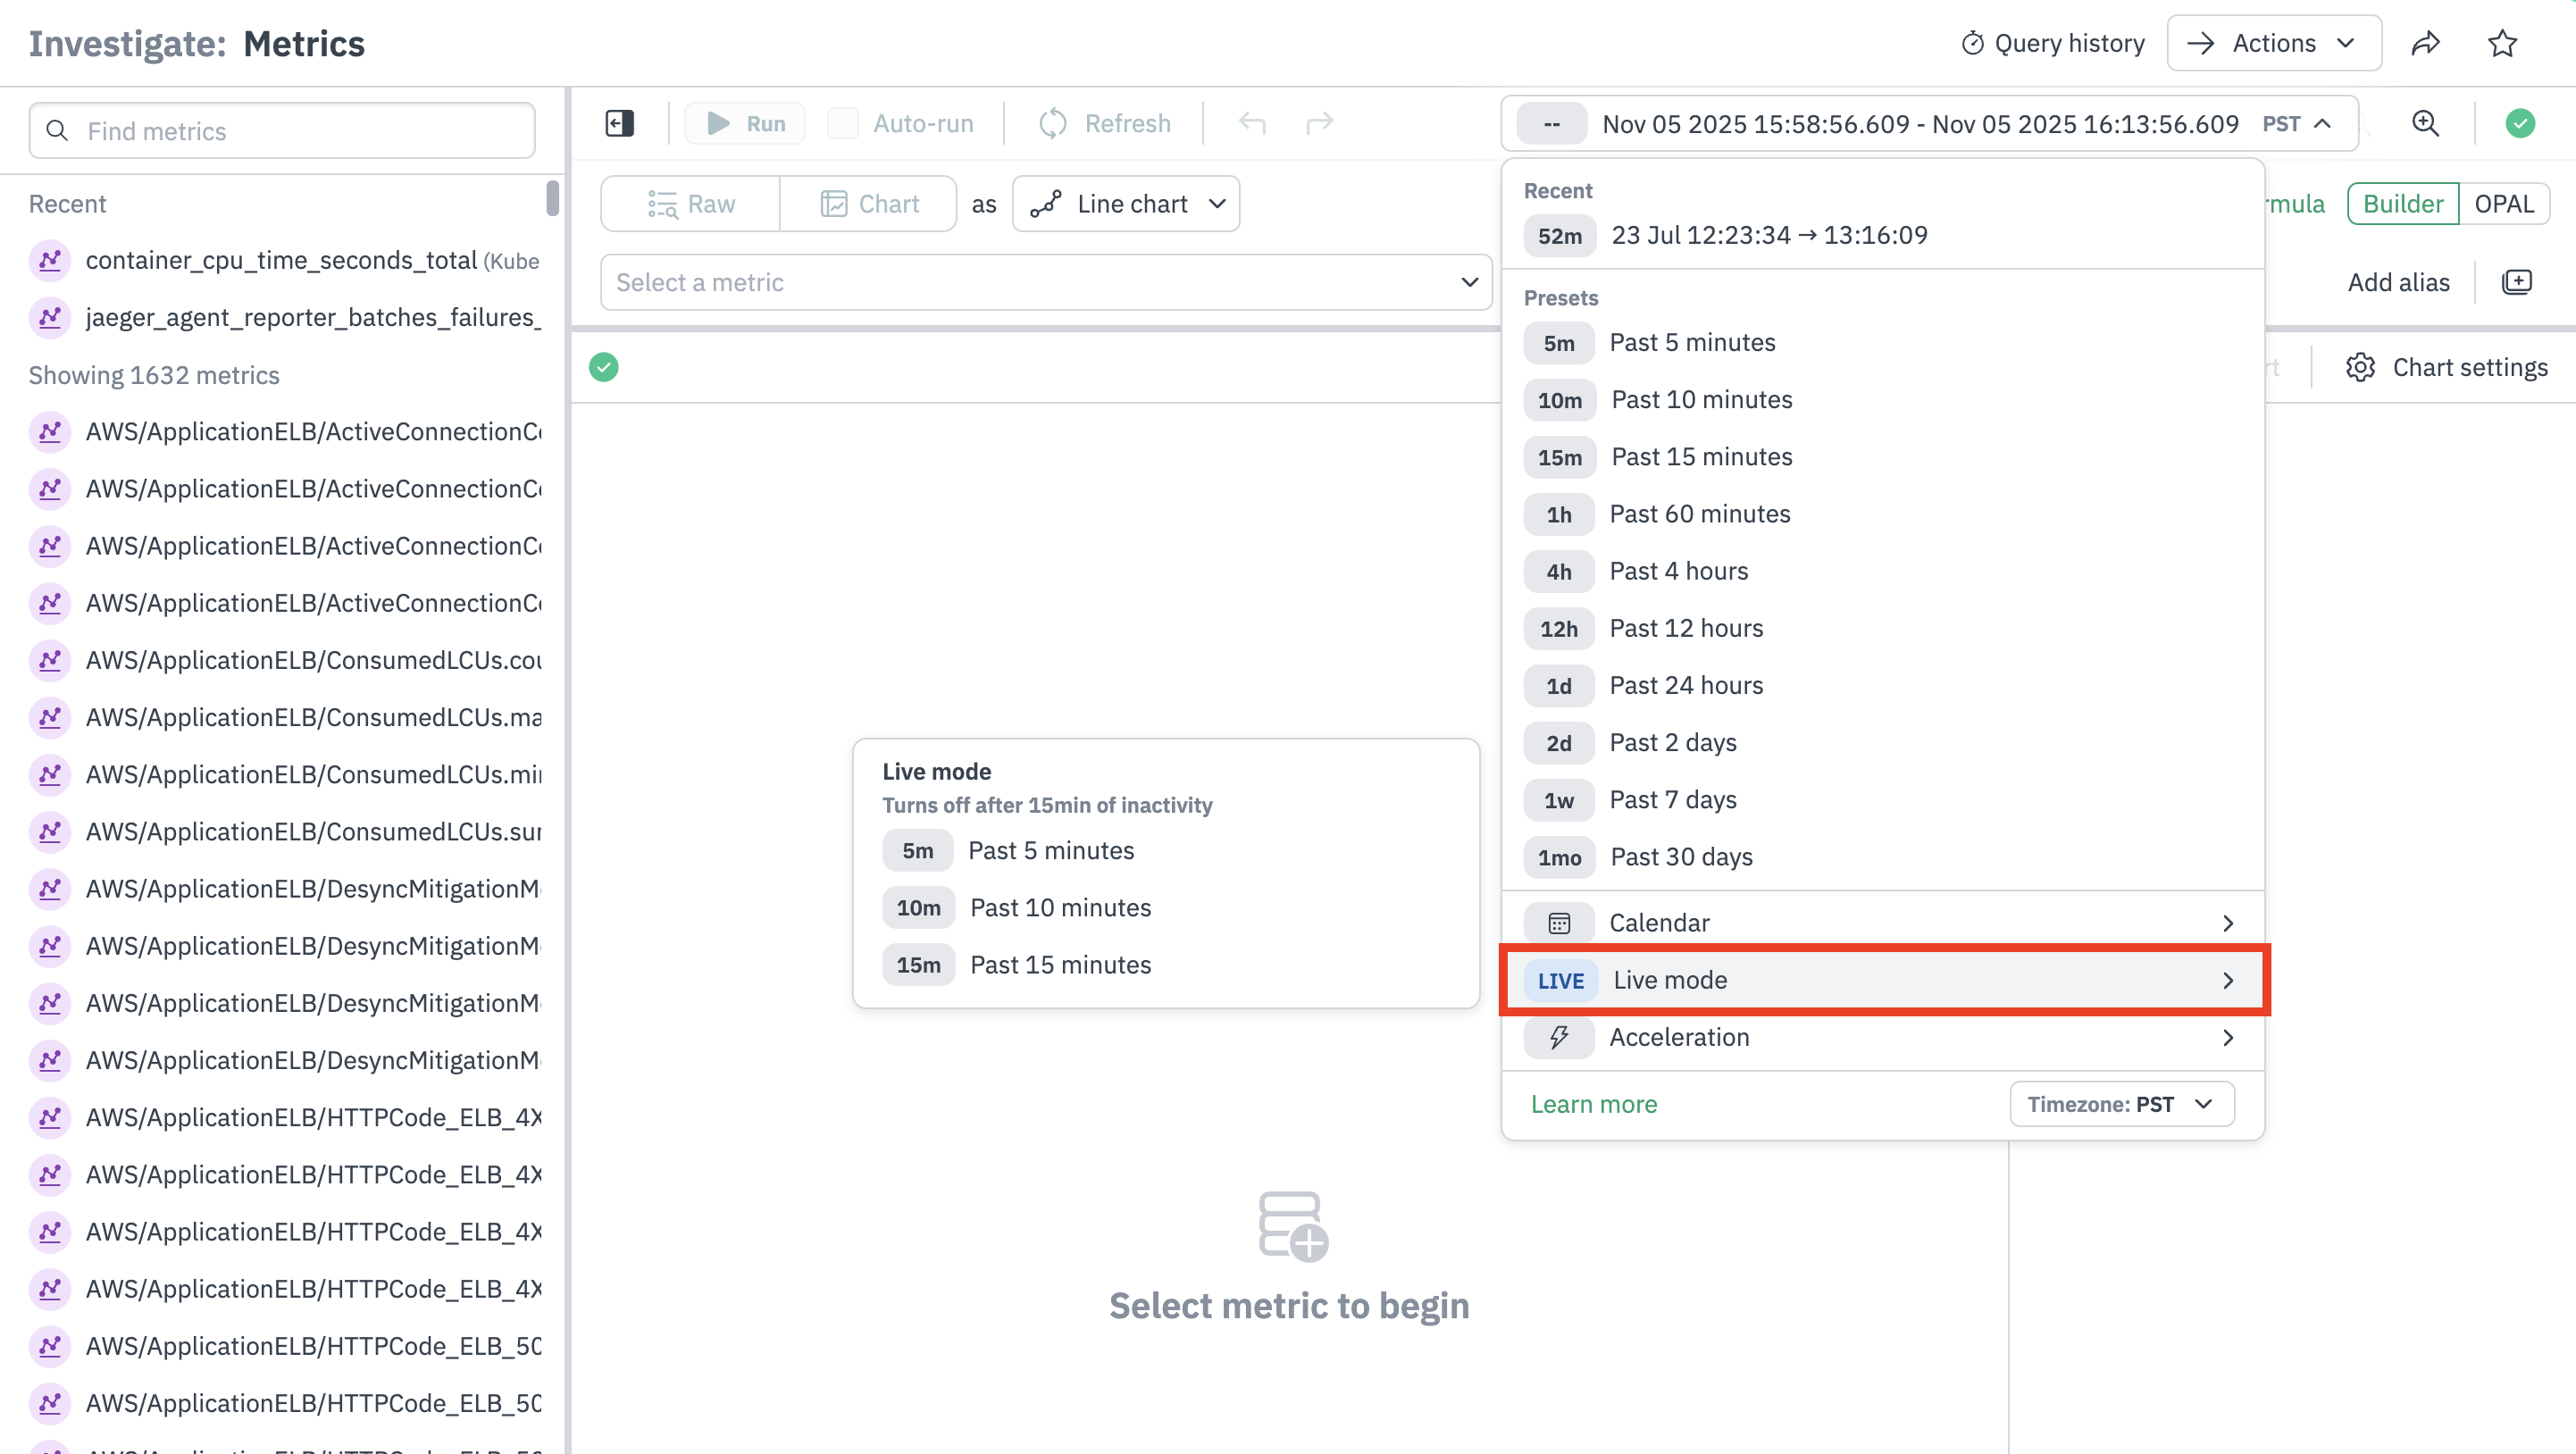
Use live mode for low latency access to data
Log Explorer and Metrics Explorer offer Live Mode. When incident debugging requires the fastest possible access to data, Live Mode users can typically expect between 30 and 90 seconds of latency from source to screen, depending on data rate and agent configuration.
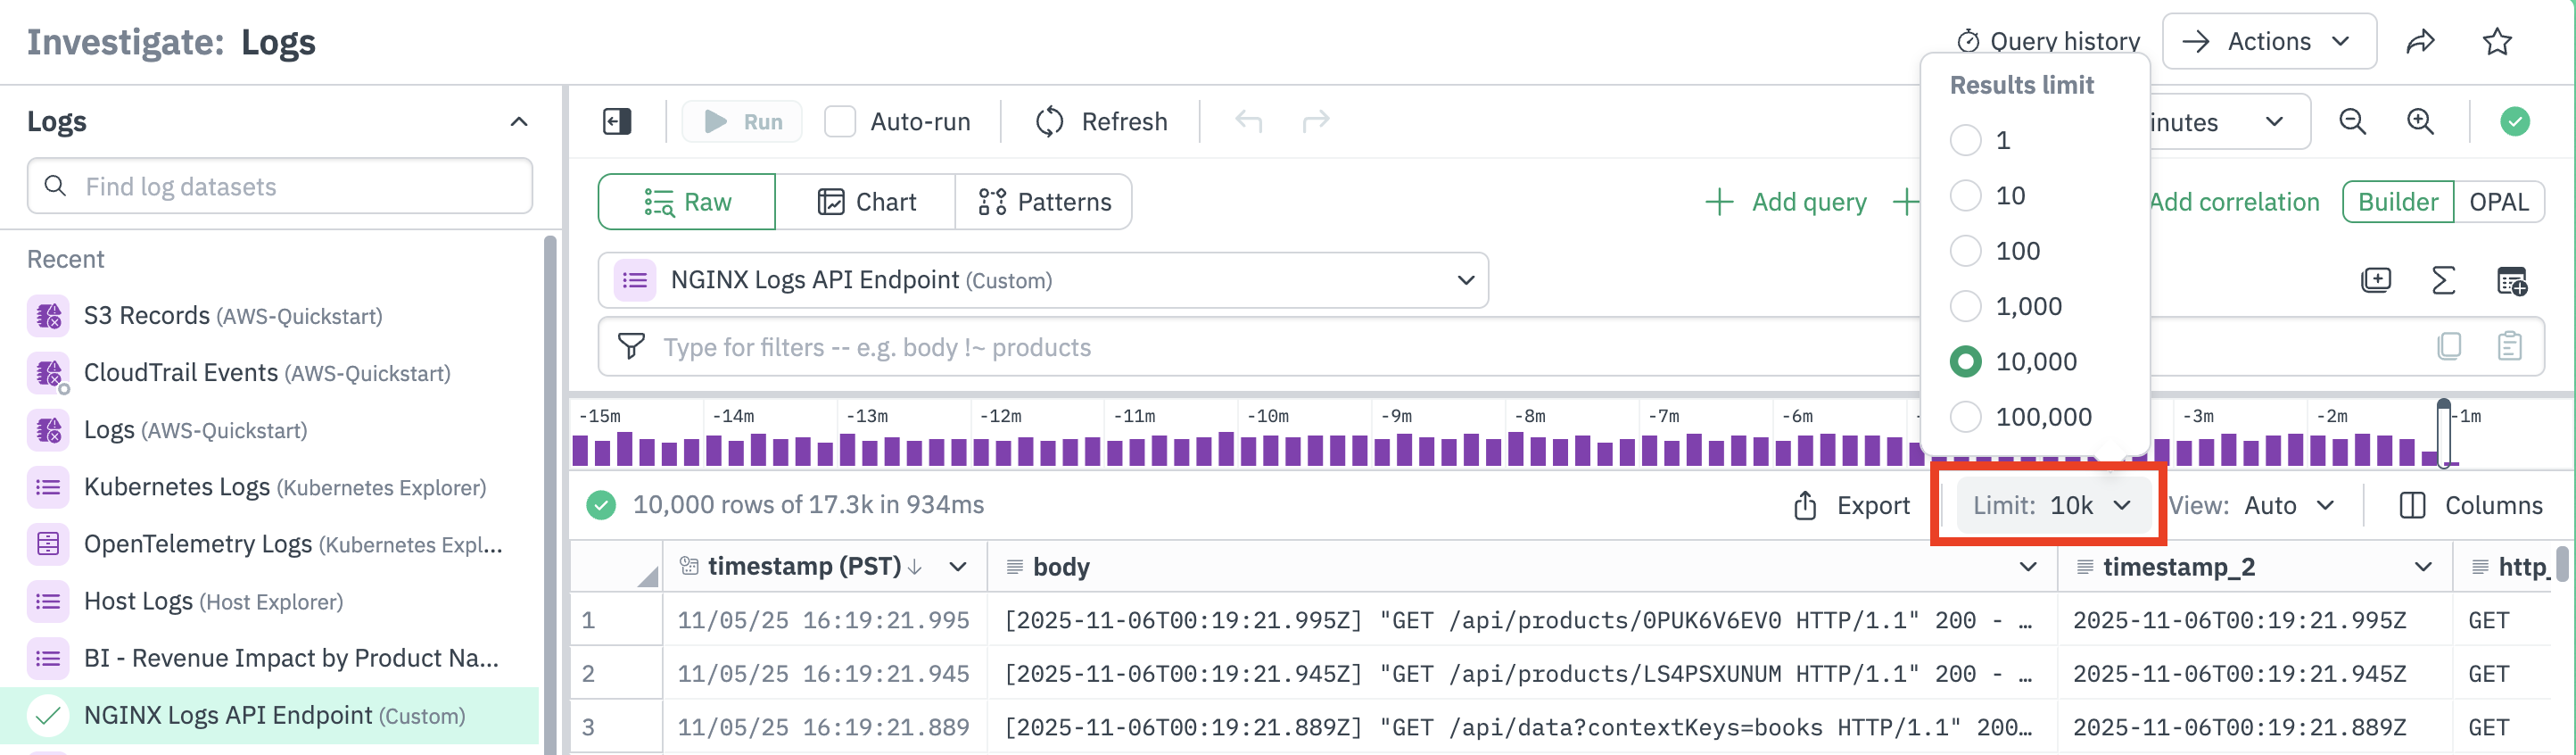
Change the number of results displayed
By default, an events table shows the first 1000 rows of results. You can change the number displayed in the Limit tab of the Table Controls menu.
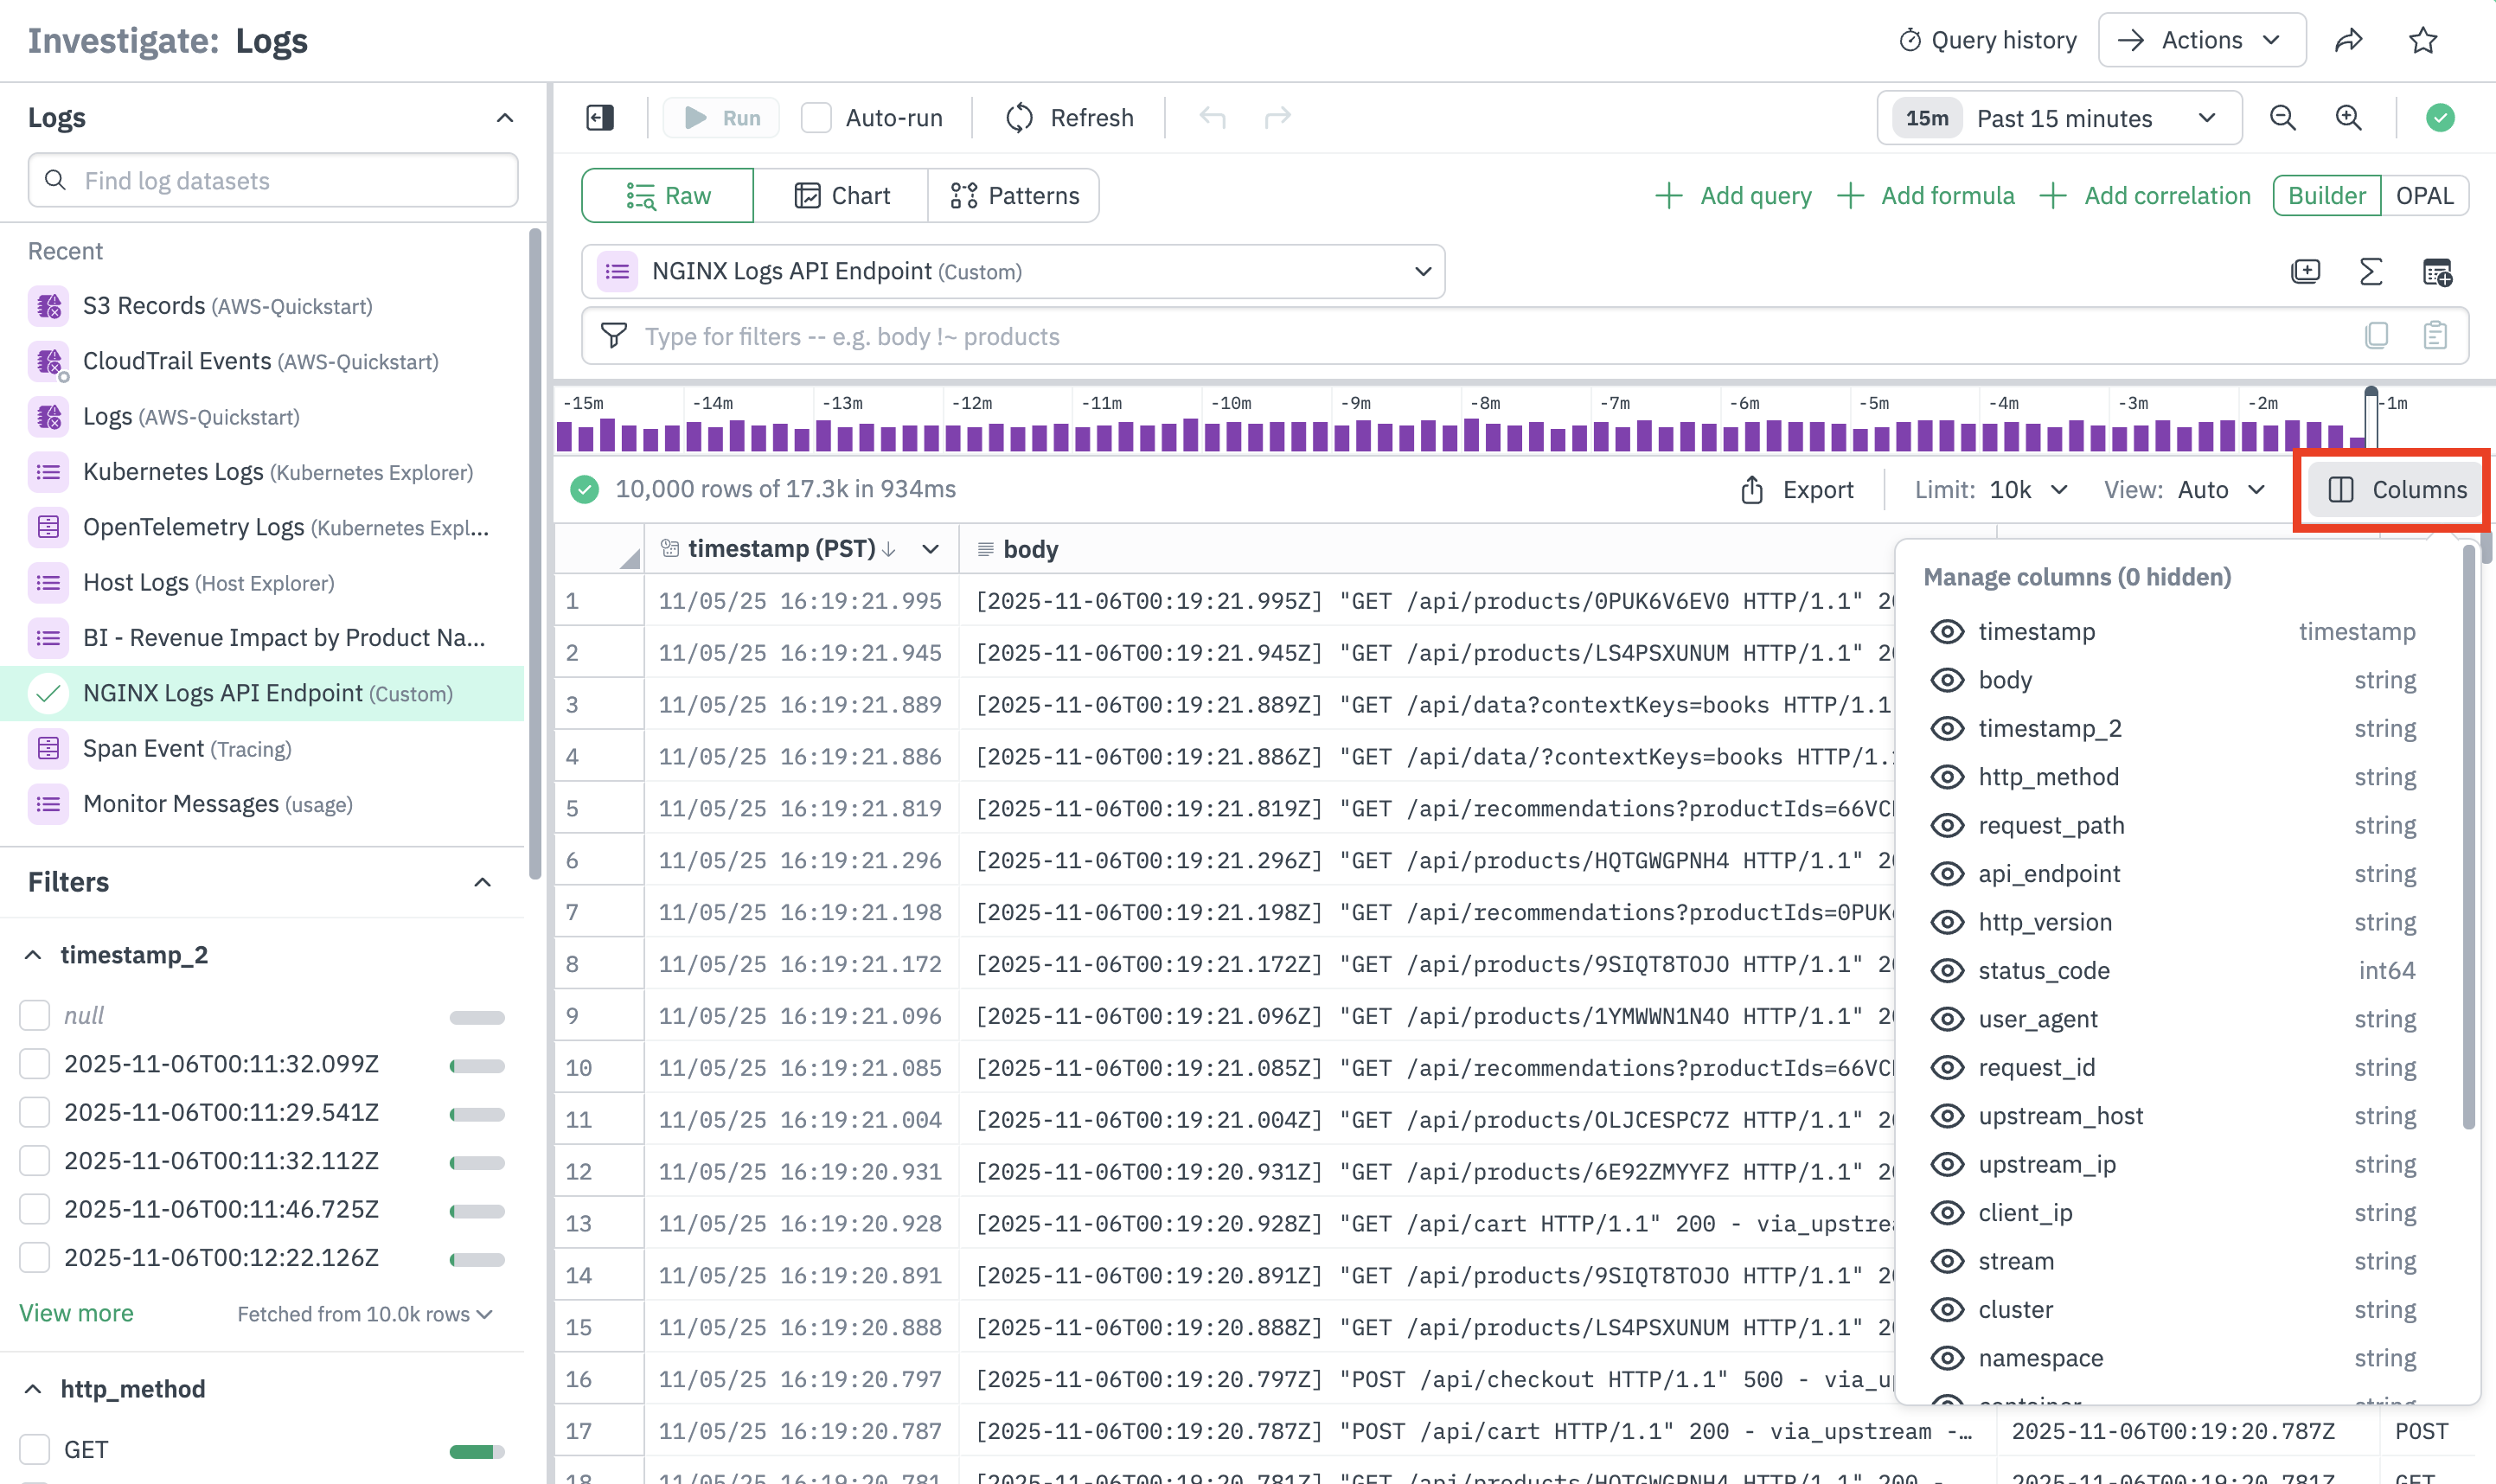
Hide, show, or reorder columns
Use the Columns tab to show or hide columns, and drag to reorder.
Updated 6 months ago