Queries and on-demand acceleration
What is a query?
Queries send requests for data stored in Observe and allow you to view that data. Essentially any time you view a Dataset in Observe, you perform a query. Under the hood, a query consists of multiple stages, with each stage using a separate OPAL script. An OPAL script consists of a sequence of statements where the output of one statement is the input for the next. This could be a single line with one statement or many lines of complex shaping and filtering.
A script contains the following types of elements:
- Query - your query contains a single time window shared across all stages, and each stage consists of a set of input elements, such as a block of OPAL script.
- Inputs - can be Datasets or other stages in the same query. Each stage contains a single output with an OPAL script consisting of OPAL verbs and functions.
- Verbs - define the processing to perform with the data in the stage.
A complete OPAL script consists of inputs, verbs, functions, and outputs defining the desired result. When you create a query in a worksheet using the console and click Run, Observe executes all stages in a query on the Datasets. In a Dashboard, Observe runs the query in the background.
Understanding on-demand acceleration
Datasets in Observe have an acceleration window. An acceleration window contains the time range for the queries on each Dataset to be fast and efficient.
Observe automatically accelerates the Dataset for the prior seven(7) days when you edit or create a Dataset. Therefore, Observe performs queries in recent time ranges quickly and efficiently.
Observe also automatically extends this acceleration window forward as new data arrives, so queries on any time range after creating a Dataset also perform quickly and efficiently.
Observe does not automatically accelerate access to historical data from before Dataset creation. As a result, queries on newly created or edited Datasets, such as those created a few days ago, using a time range from far in the past, such as this day last year, cannot be satisfied with accelerated data.
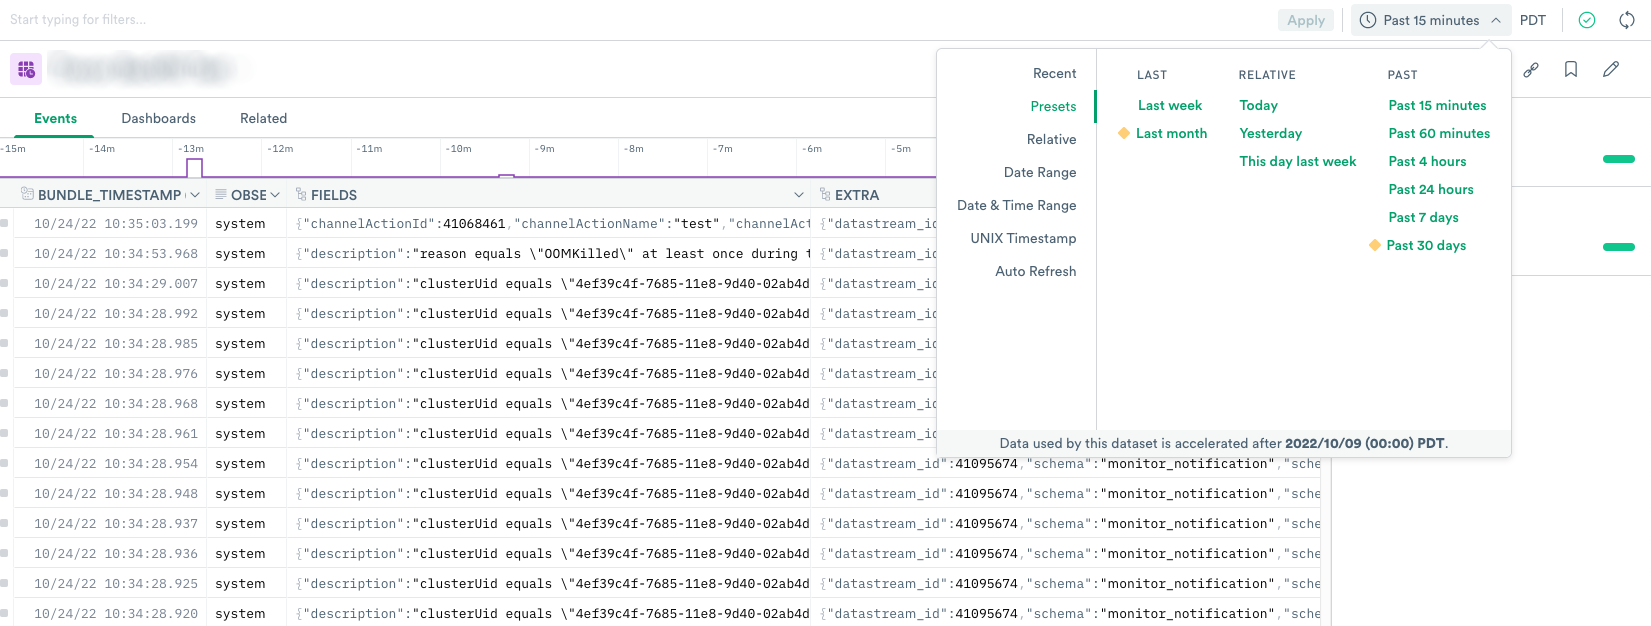
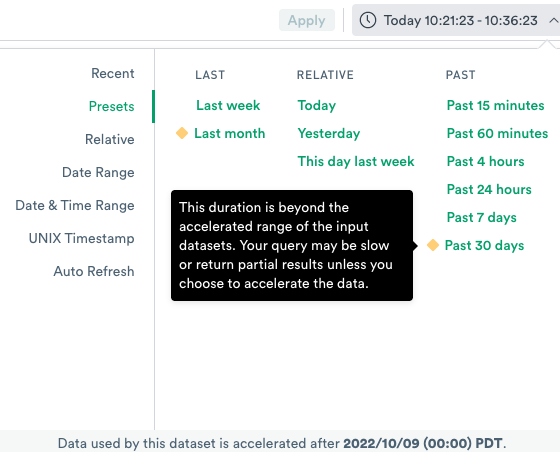
When you select a time range with the Select Time Range option, some options may have a yellow diamond icon data acceleration next to them. These are time ranges extending past the Datasets’ acceleration window in your query. These Datasets may be partially or completely unaccelerated.
If you select an unaccelerated (yellow diamond) time range, the following things can occur in Observe:
- Because you selected a time range beyond the acceleration window of the Datasets you want to query, older data from before the beginning of the acceleration window may be missing from the result. For example, if a queried Dataset was only accelerated 14 days ago, and you select Past 30 days in the Select Time Range, your query results only reflects the past 14 days, even though you requested the past 30 days.
- You see a message indicating that your results may only reflect a partial range of the requested time range.
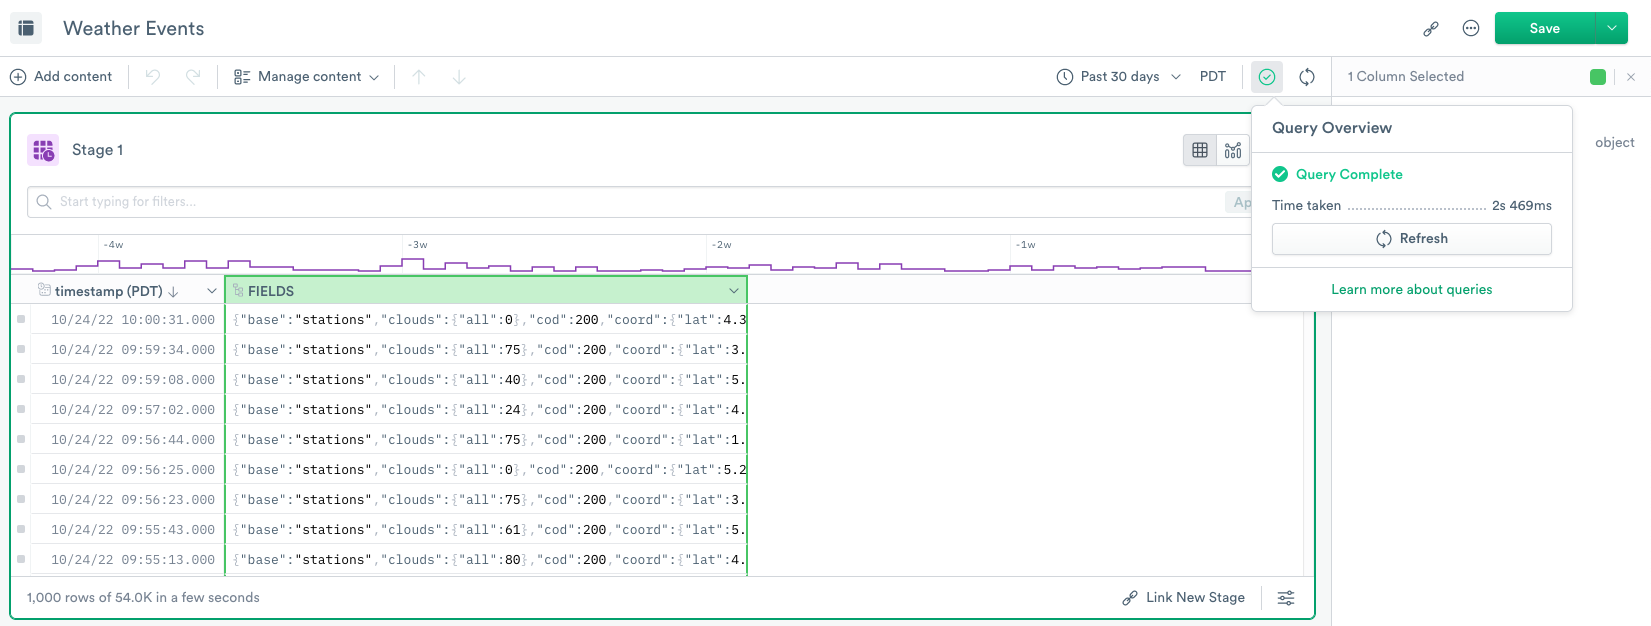
If you can use partial results, you can dismiss the message. Otherwise, you can accelerate the Dataset by selecting Accelerate full range. This initiates a background process to accelerate the Datasets in your query for the entire time range you selected from the Select Time Range menu. You can monitor the acceleration progress on your Dataset from the Query Overview window. It can take a few minutes for the Dataset to update.
NoteAcceleration of historical time ranges for Datasets consumes Observe Compute Credits (OCC). You can monitor your credit usage by reviewing the Usage Dashboard for credits attributed to backfill activity.
After completing the background process, your next query returns results for the full time range that you requested. Because it used an accelerated Dataset, the query becomes much faster and more cost-efficient compared to querying your raw data. Also, because you accelerated the Dataset, all other users in your account enjoy the same performance and efficiency benefit when querying this Dataset.
Accelerating Datasets
When you open a worksheet, dashboard, or Dataset, Observe automatically updates the query, and you can see the Query in Progress icon. Click the Stop icon to end the query process.

After completing the background process, your following query returns results for the requested time range. Because it uses an accelerated Dataset, the query becomes much faster and more cost-efficient than querying your raw data. Also, because you accelerated the Dataset, all other users in your account enjoy the same performance and efficiency benefit when querying this Dataset.
If the query returns results successfully, the Query in Progress icon changes to the Query Overview icon Query successful icon. You can refresh the query using the Refresh icon.

You can change the time range for the query by using the Select Time Range icon. After you select it, you may see some time ranges with a yellow diamond next to them.
These time ranges include a window of time where the underlying Datasets for your query are not accelerated. If you query these ranges, your query will return partial results compared to a query on raw data ingested into Observe.
You may elect to accelerate the unaccelerated time range to obtain complete results.
Clicking on the yellow diamond icon allows you to choose to accelerate the range of data.
To accelerate the full range of data, click Accelerate full range.
Acceleration may be unavailable for a selected time range because the Dataset on demand materialization has reached the upper limit. Contact your Observe Data Engineer if you encounter this error and need assistance to accelerate a more extended time range.
Data acceleration and data freshness
A dataset's freshness goal affects the cost of maintaining that data, as follows:
| Freshness Goal | Data | Cost | Example |
|---|---|---|---|
| looser | staler | lower | 10 minutes |
| tighter | fresher | higher | 1 minute |
Automatic freshness management
As a cost-saving measure, Dataset freshness goals may be automatically decayed, or loosened due to a period of inactivity to help reduce credit usage.
Freshness decay, or slowing of acceleration, is based on historical usage patterns. If a dataset is typically not accessed at certain times of the day/week (e.g., evenings or weekends), then the dataset will be decayed and become less fresh during those periods. The idea is that data should be fresh when you need it. Freshness adjustment is capped at 1 hour, meaning a slowed Dataset can only be up to 1 hour behind.
If you visit a page that relies on a Dataset with decayed freshness, you may see a gray clock icon or a message reading “Stale data, no results in window”. In this case, the freshness of at least one dataset used by the page has automatically decayed to minimize system utilization. Visiting a page in this condition will automatically initiate re-acceleration. After a few minutes, the dataset or datasets should be accelerated and ready for use. Furthermore, dataset(s) should then remain fresh during continued use. Affected panels will have a green “Try again” button. You can also refresh the entire page by clicking the gray clock icon to get the Query Overview, then clicking Try Again under the Stale Data warning.
A monitor on a Dataset continually accesses that Dataset, preventing automatic freshness goal decay beyond the freshness goal of that monitor. This is by design, to prevent slowed monitoring results.
You may encounter instances where a Dataset’s freshness goal cannot be met, causing a Stale Dataset warning. Stale Datasets may also occur because the Acceleration Credit Manager configuration has overridden the Freshness Goal of a Dataset or its parent Datasets. A stale Dataset may also occur if the freshness goal is too tight to meet (for example, a one minute freshness goal on data that takes ten minutes to collect). These Datasets contain data that is less fresh than the goal. After a query of such a Dataset completes, Observe will display a yellow warning diamond and note “Excessively Stale Data.”
Data can also be stale due to a tight freshness goal or non-optimized OPAL. You may need to manually loosen the freshness goal or change OPAL in order to increase the data's freshness. Contact your Observe data engineer if you need assistance with OPAL optimization.
Manage Dataset acceleration
Observe administrators may review and adjust dataset acceleration behavior in Acceleration manager. All Datasets and Monitors are listed here, with their Accelerated Range, Freshness Goal, and Effective Freshness. Freshness Goals can be manually altered on this page. For more detail on Dataset acceleration and freshness, see Important concepts.
Updated 6 months ago