Visualization types
Observe offers a rich array of visualization types for visualizing your data. Visualizations are a way to view data within dashboards and Worksheets.
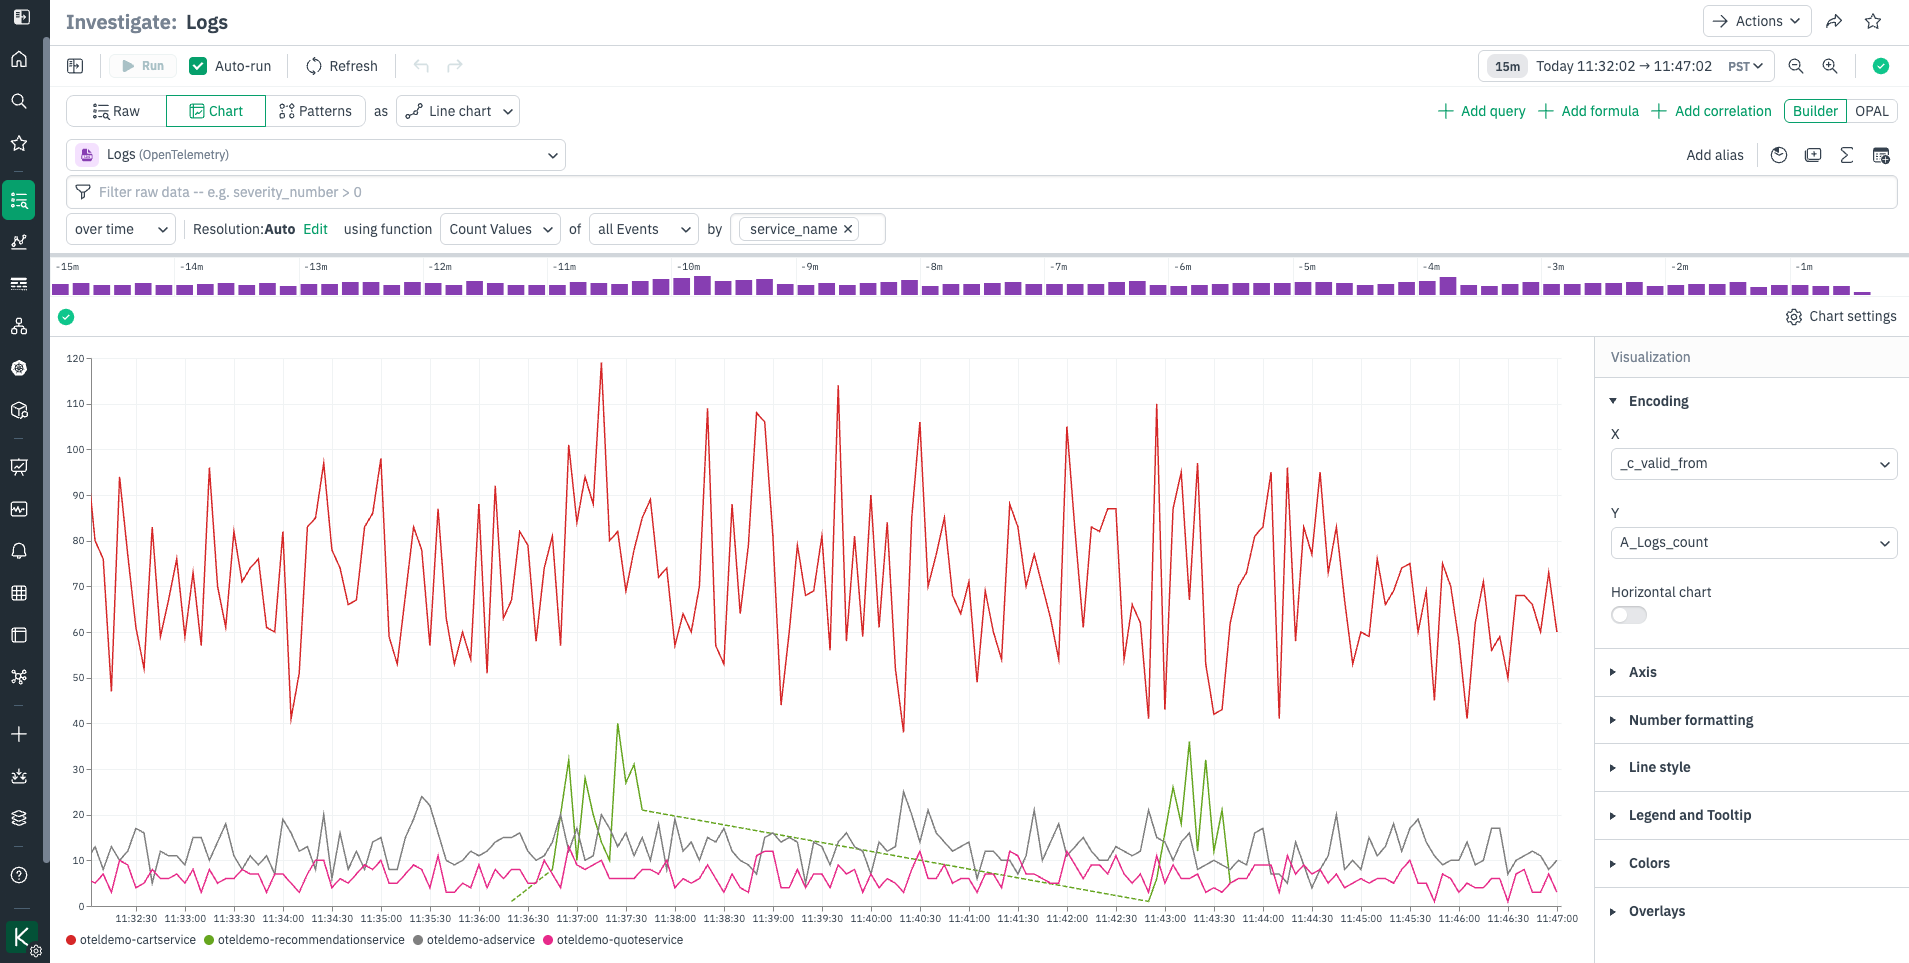
Line chart
The line chart, also known as time series in other systems, presents values on an X and Y axis. It is the most common and default type of visualization. Line charts are effective at showing how something changes over time.
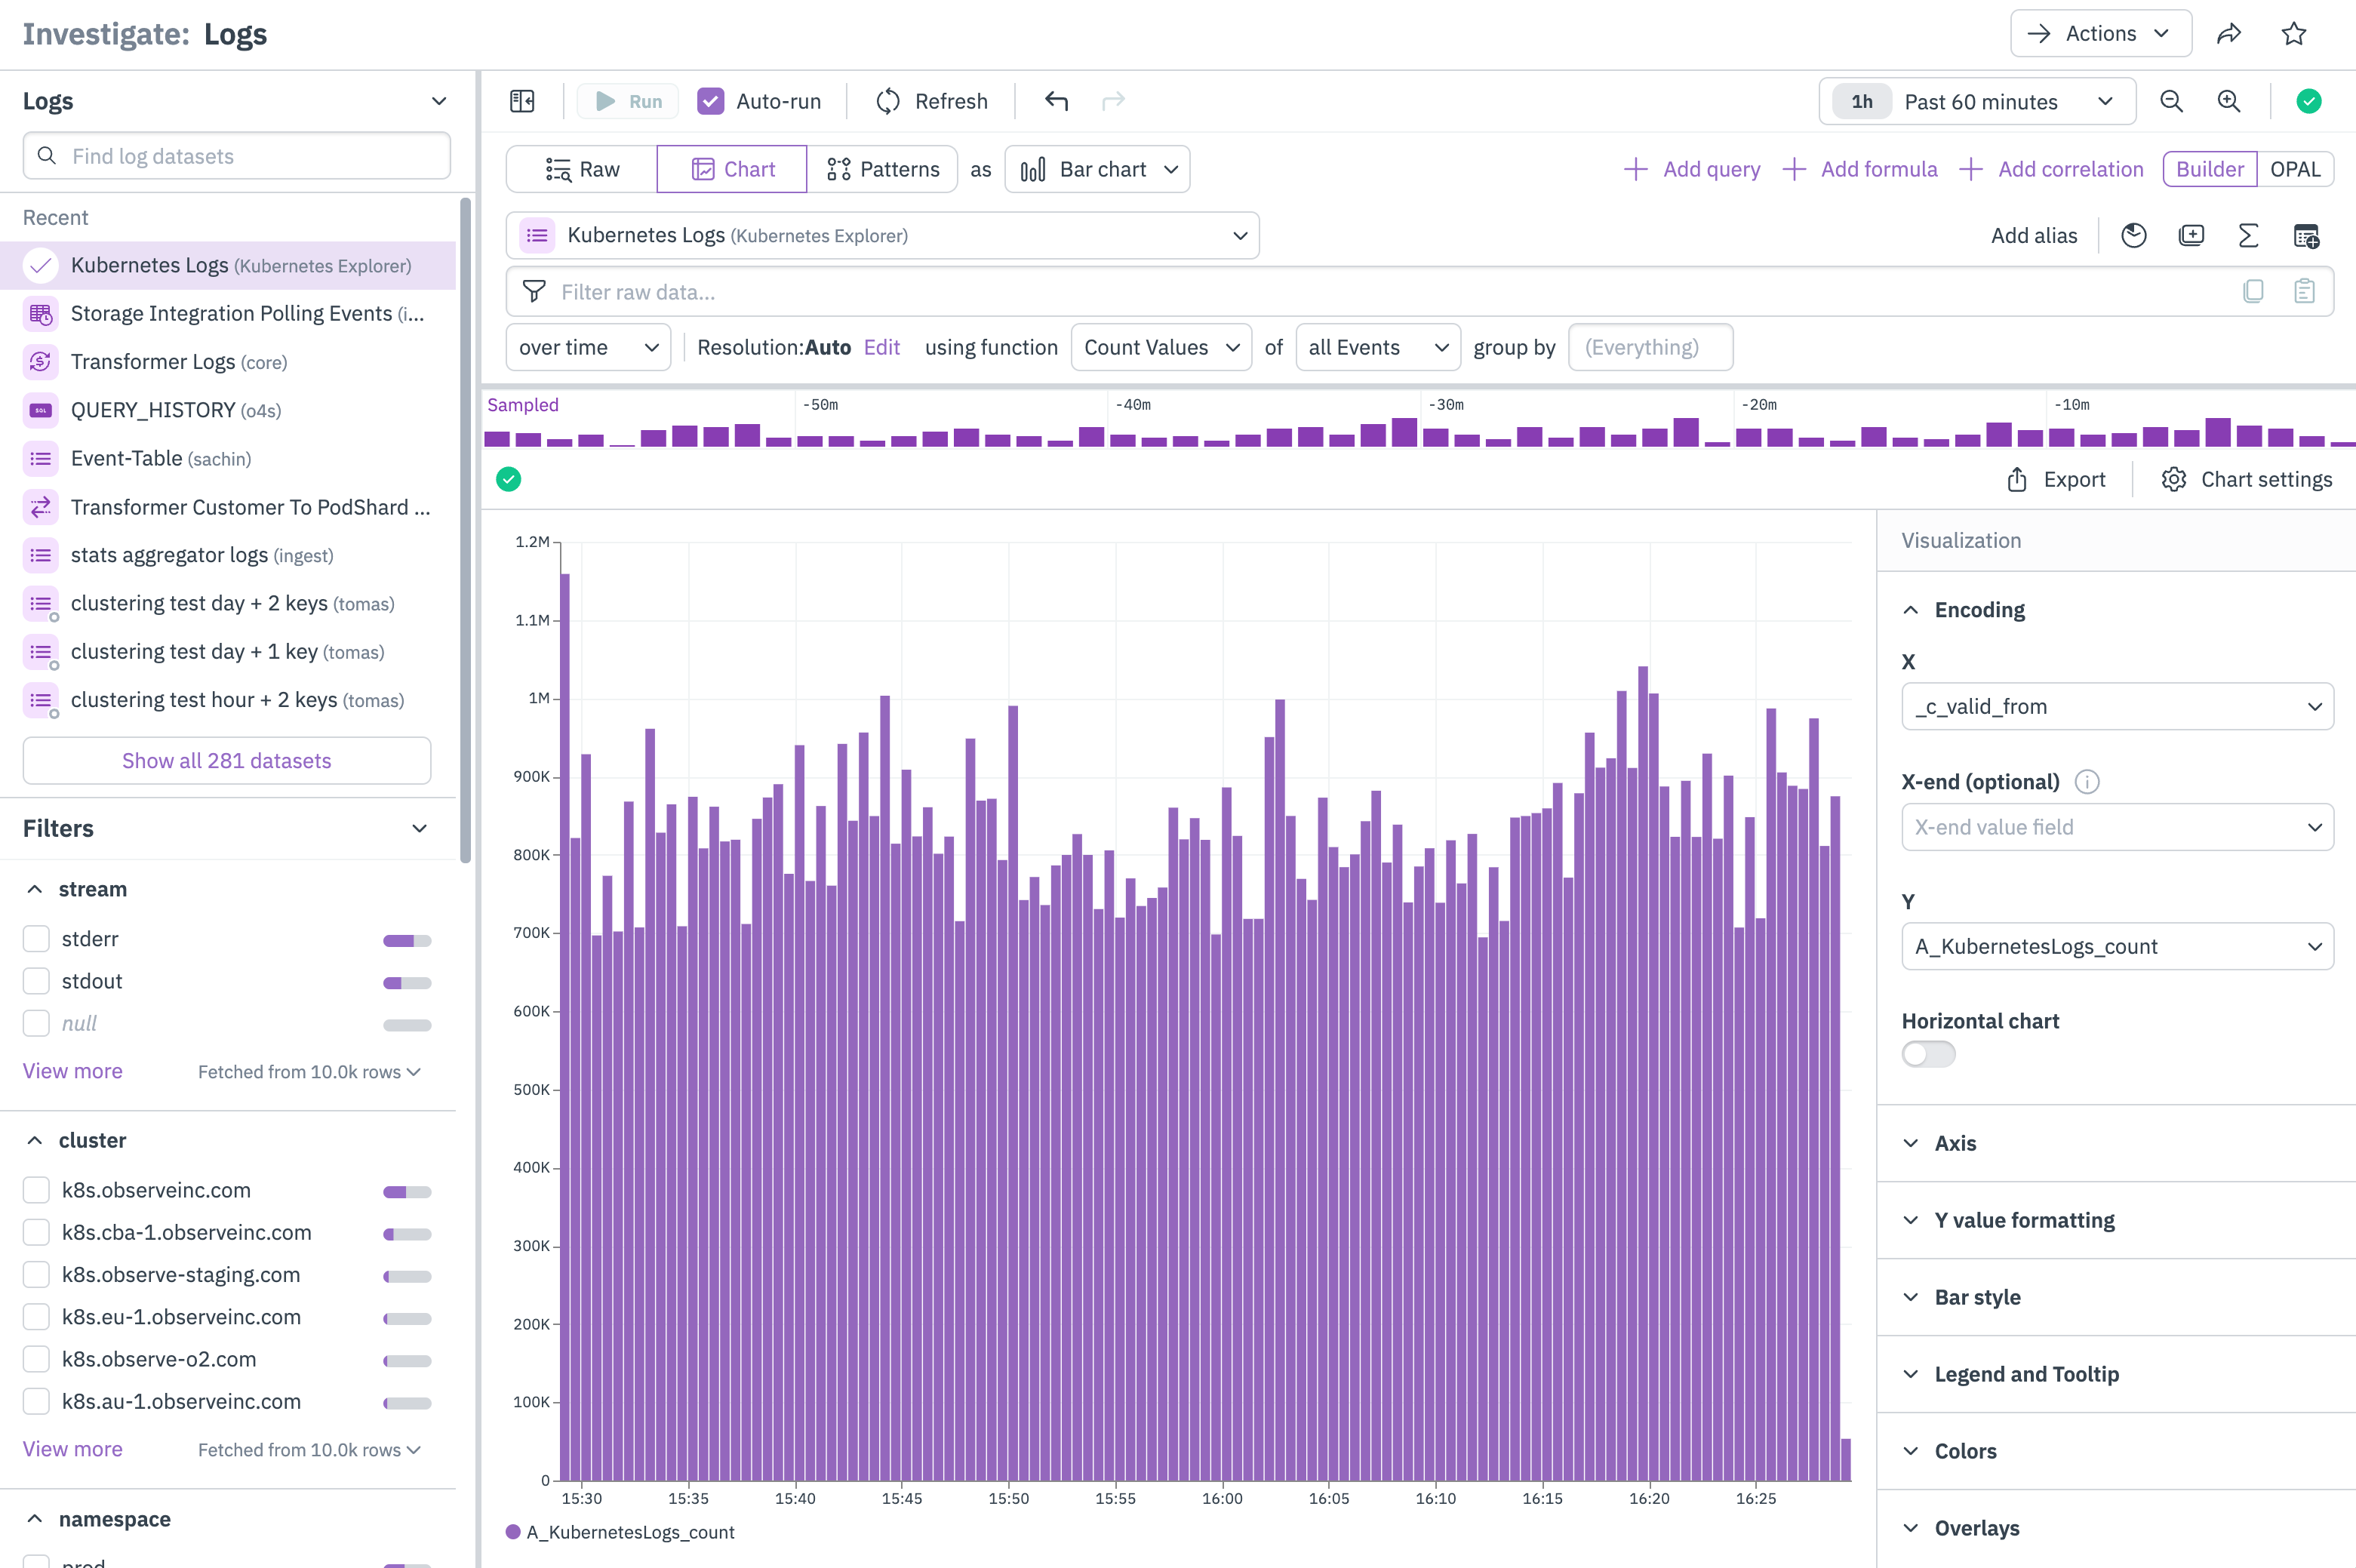
Bar chart
The bar chart is a familiar visualization that presents a value in either vertical or horizontal bars. Bar charts are useful for comparing quantities across different categories.
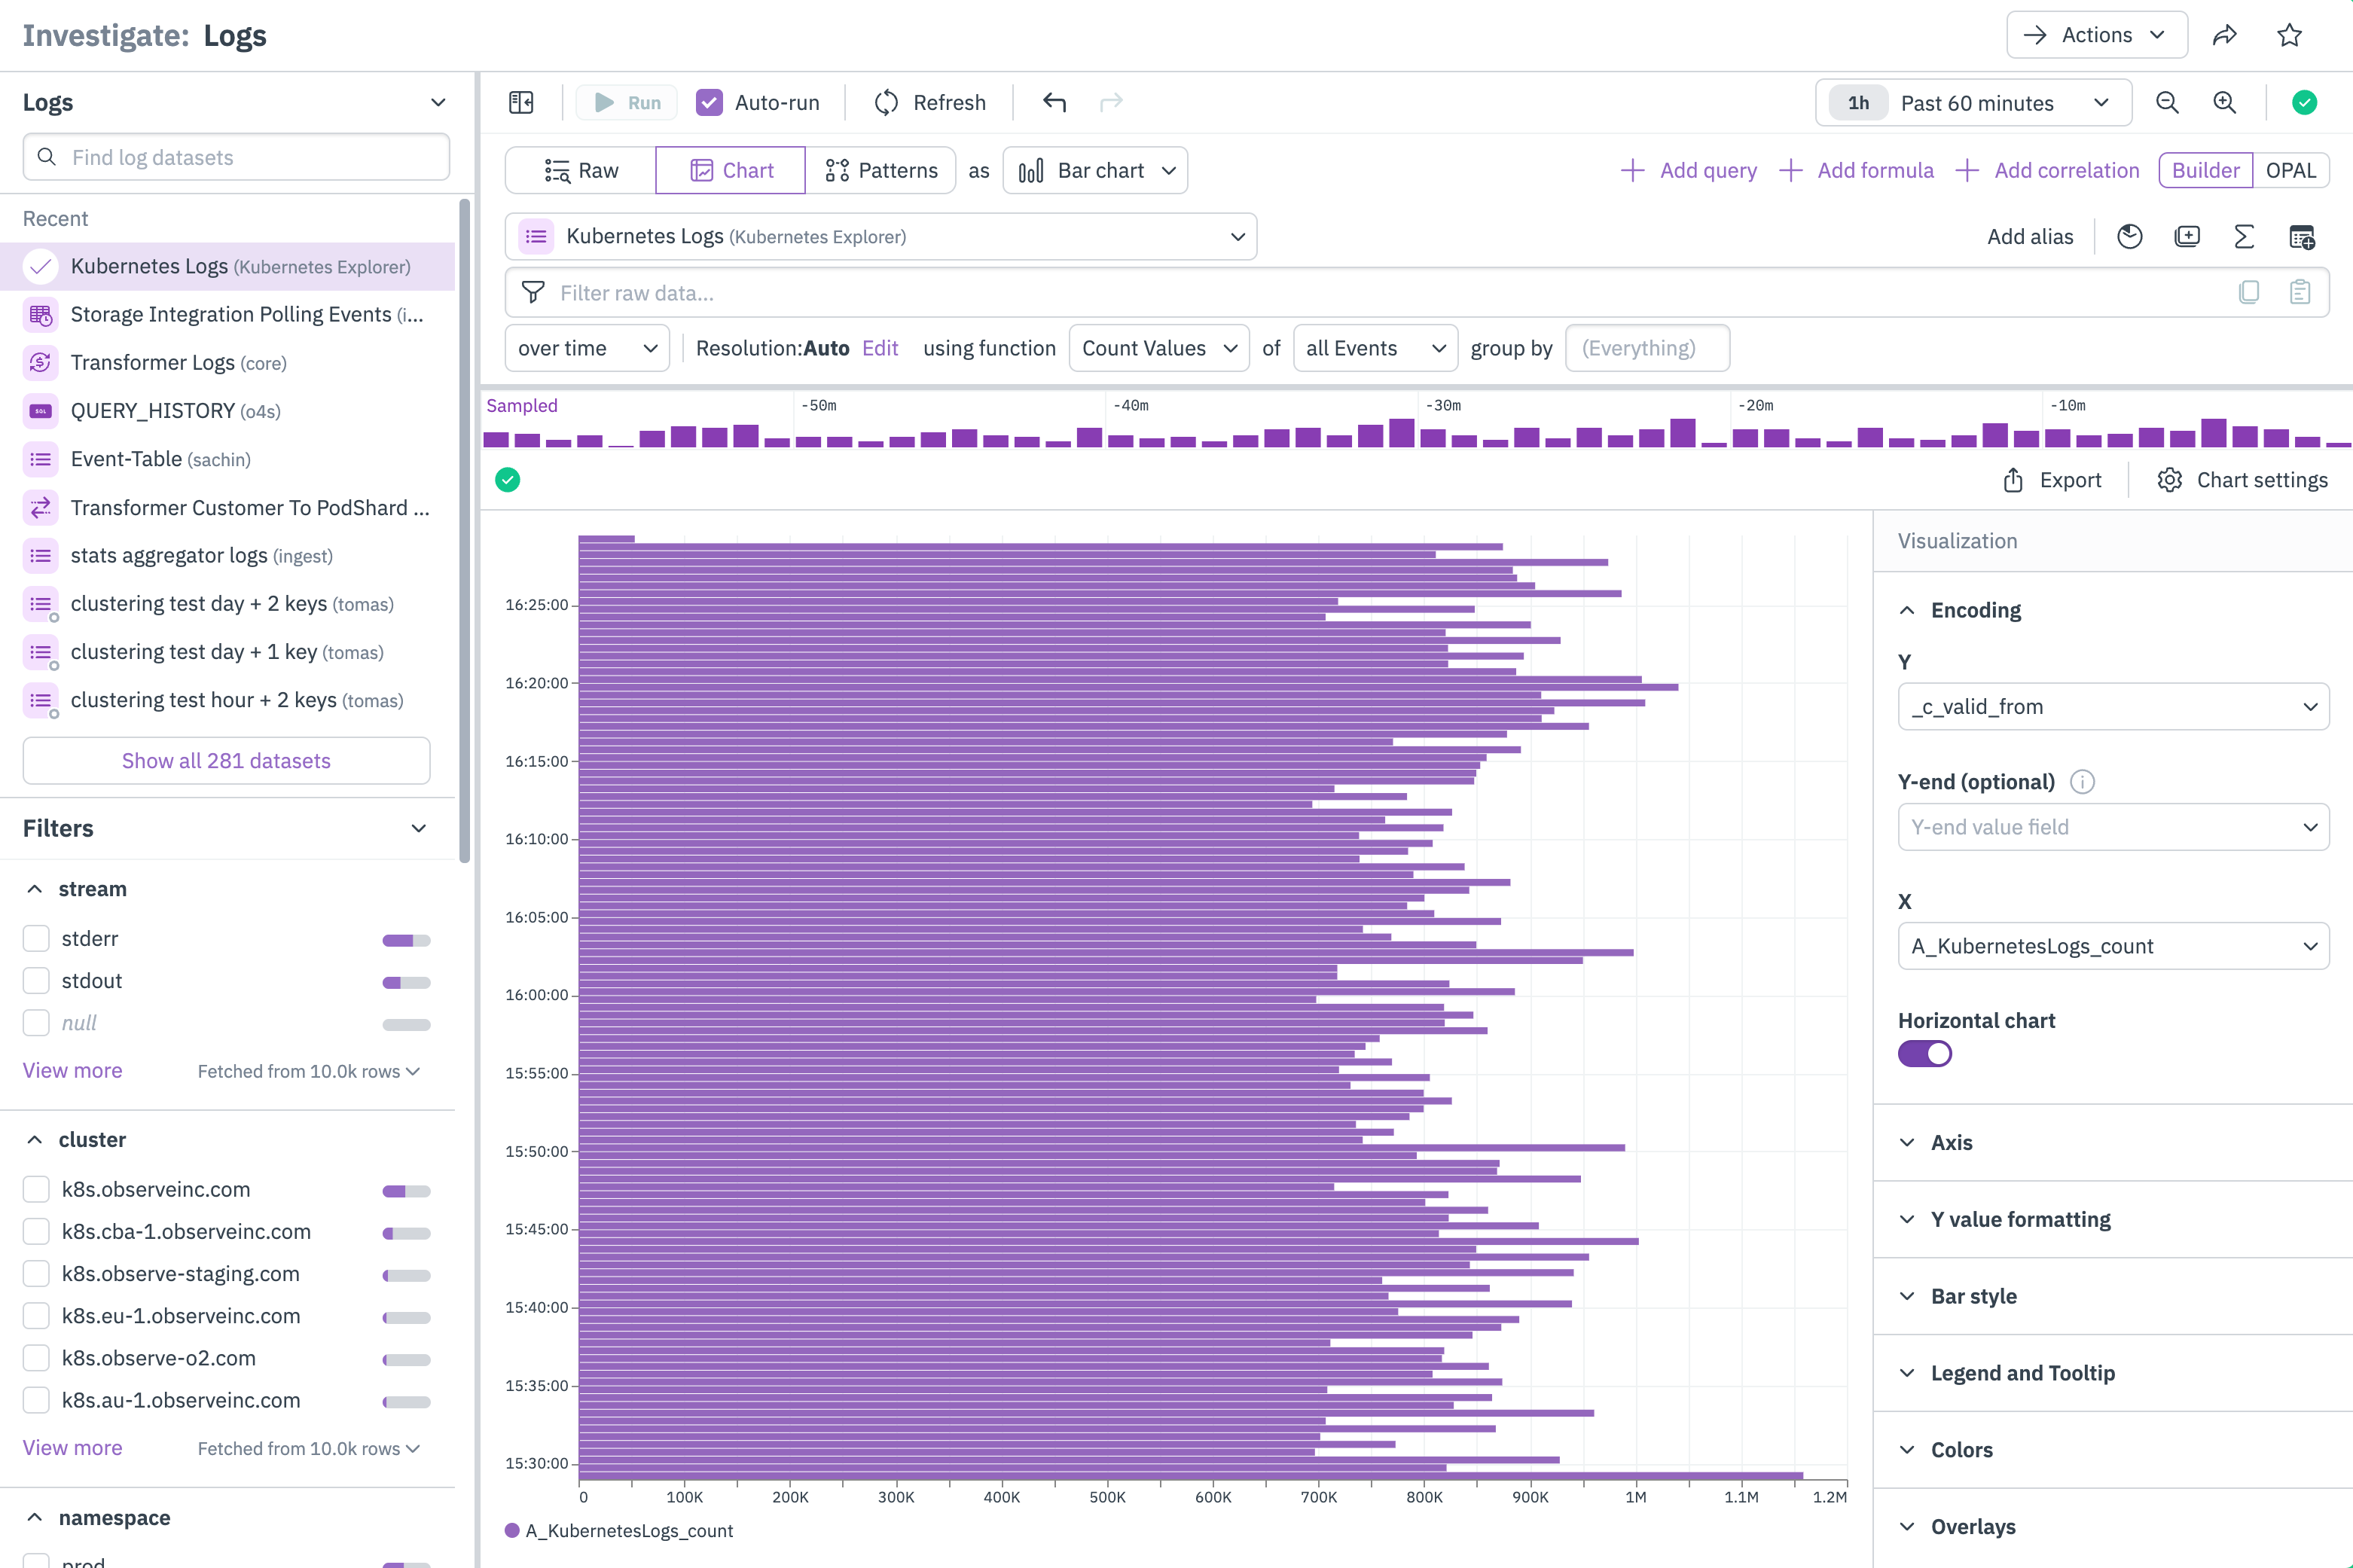
Bar charts can additionally be displayed as grouped bar charts, or horizontally, as shown below:
Histogram
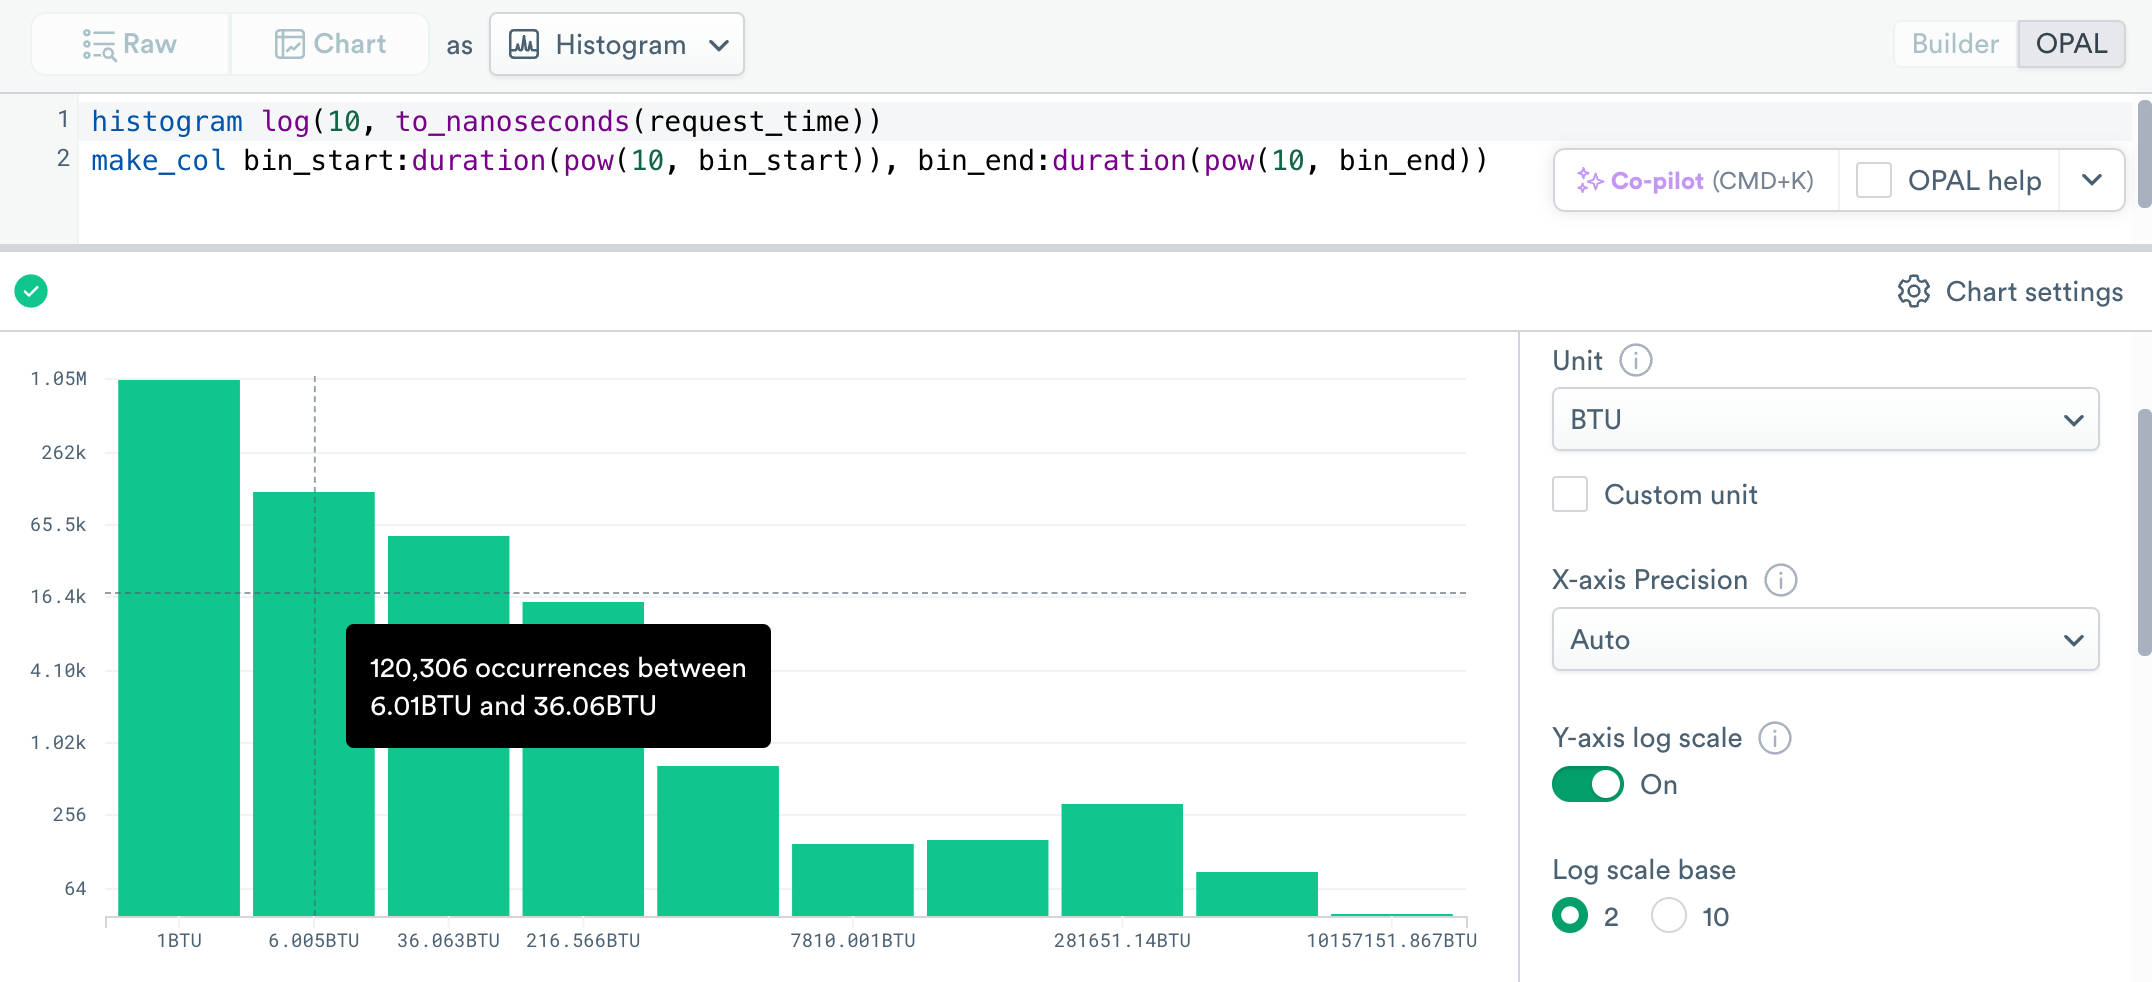
The histogram presents a bar chart of data that has been processed by the histogram verb. Instead of singular values, each value is a range. The histogram visualization type is only available if the histogram verb is used. Histogram chart settings are identical to those of the bar chart.
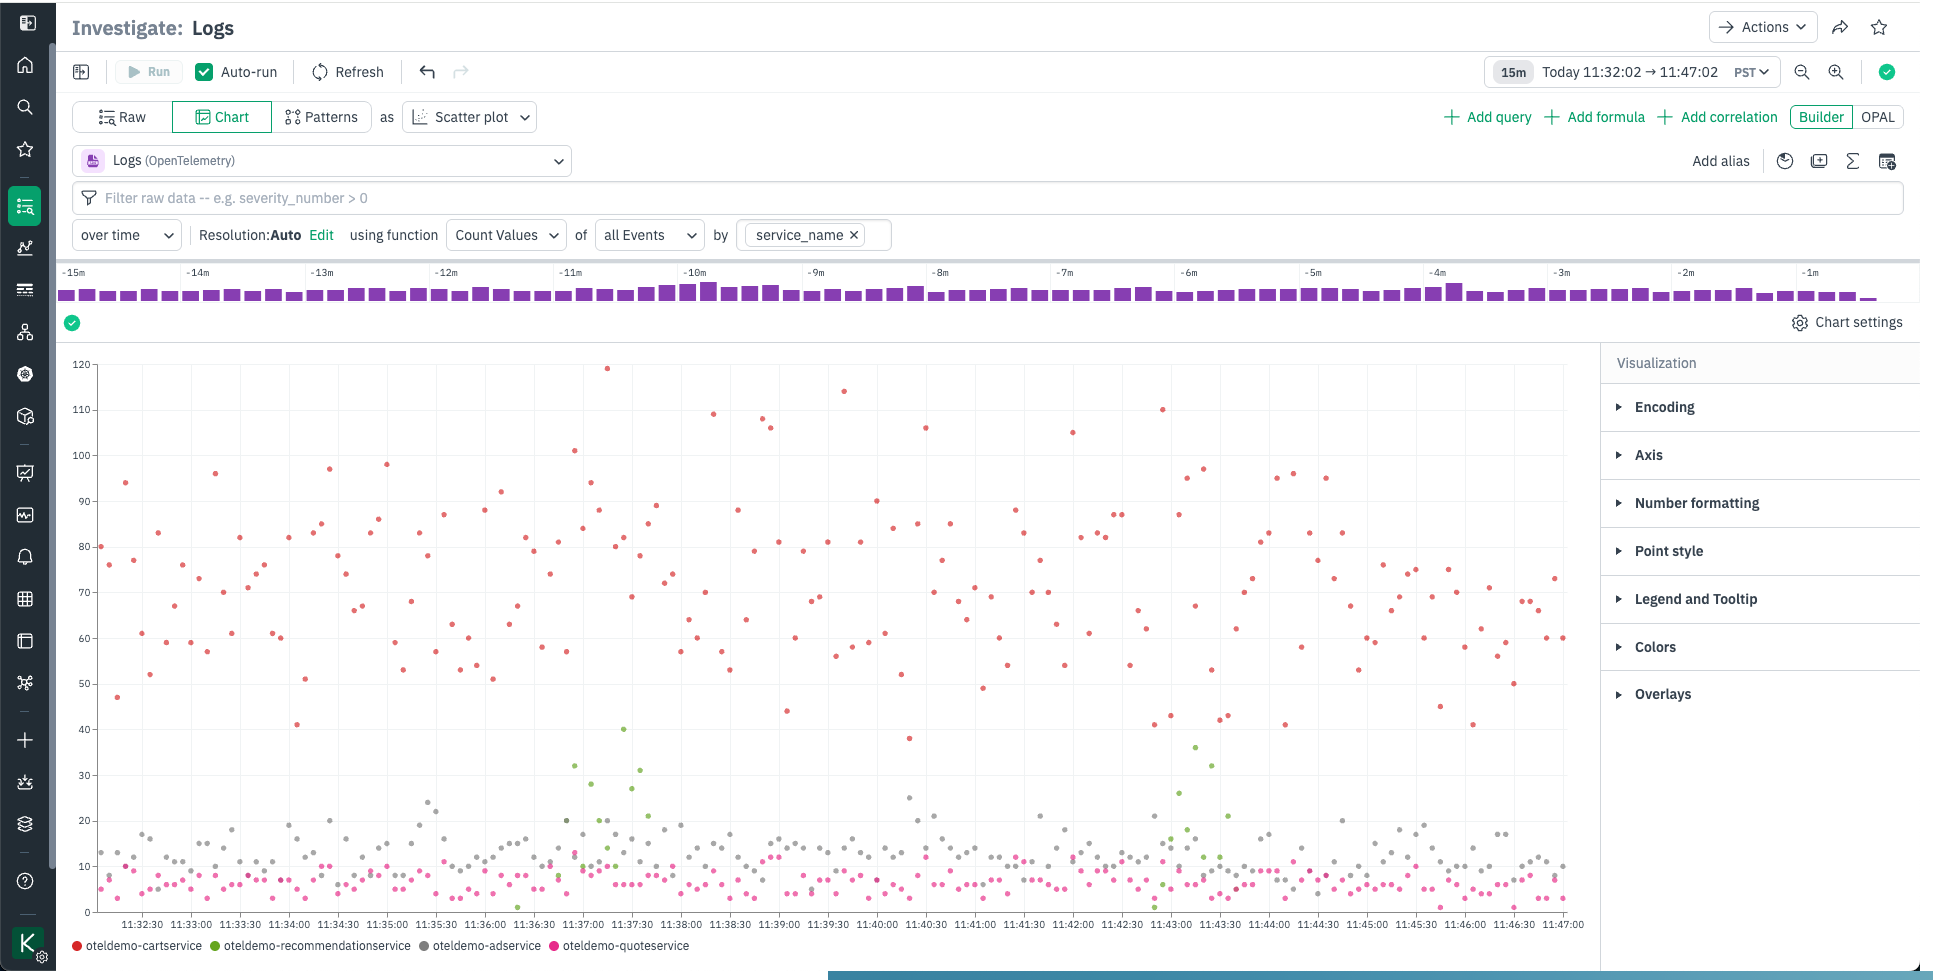
Scatter plot
The scatter plot is a visualization type that plots values on a X-Y coordinates. It is helpful for visualizing the relationship between two variables, or to view outlier data.
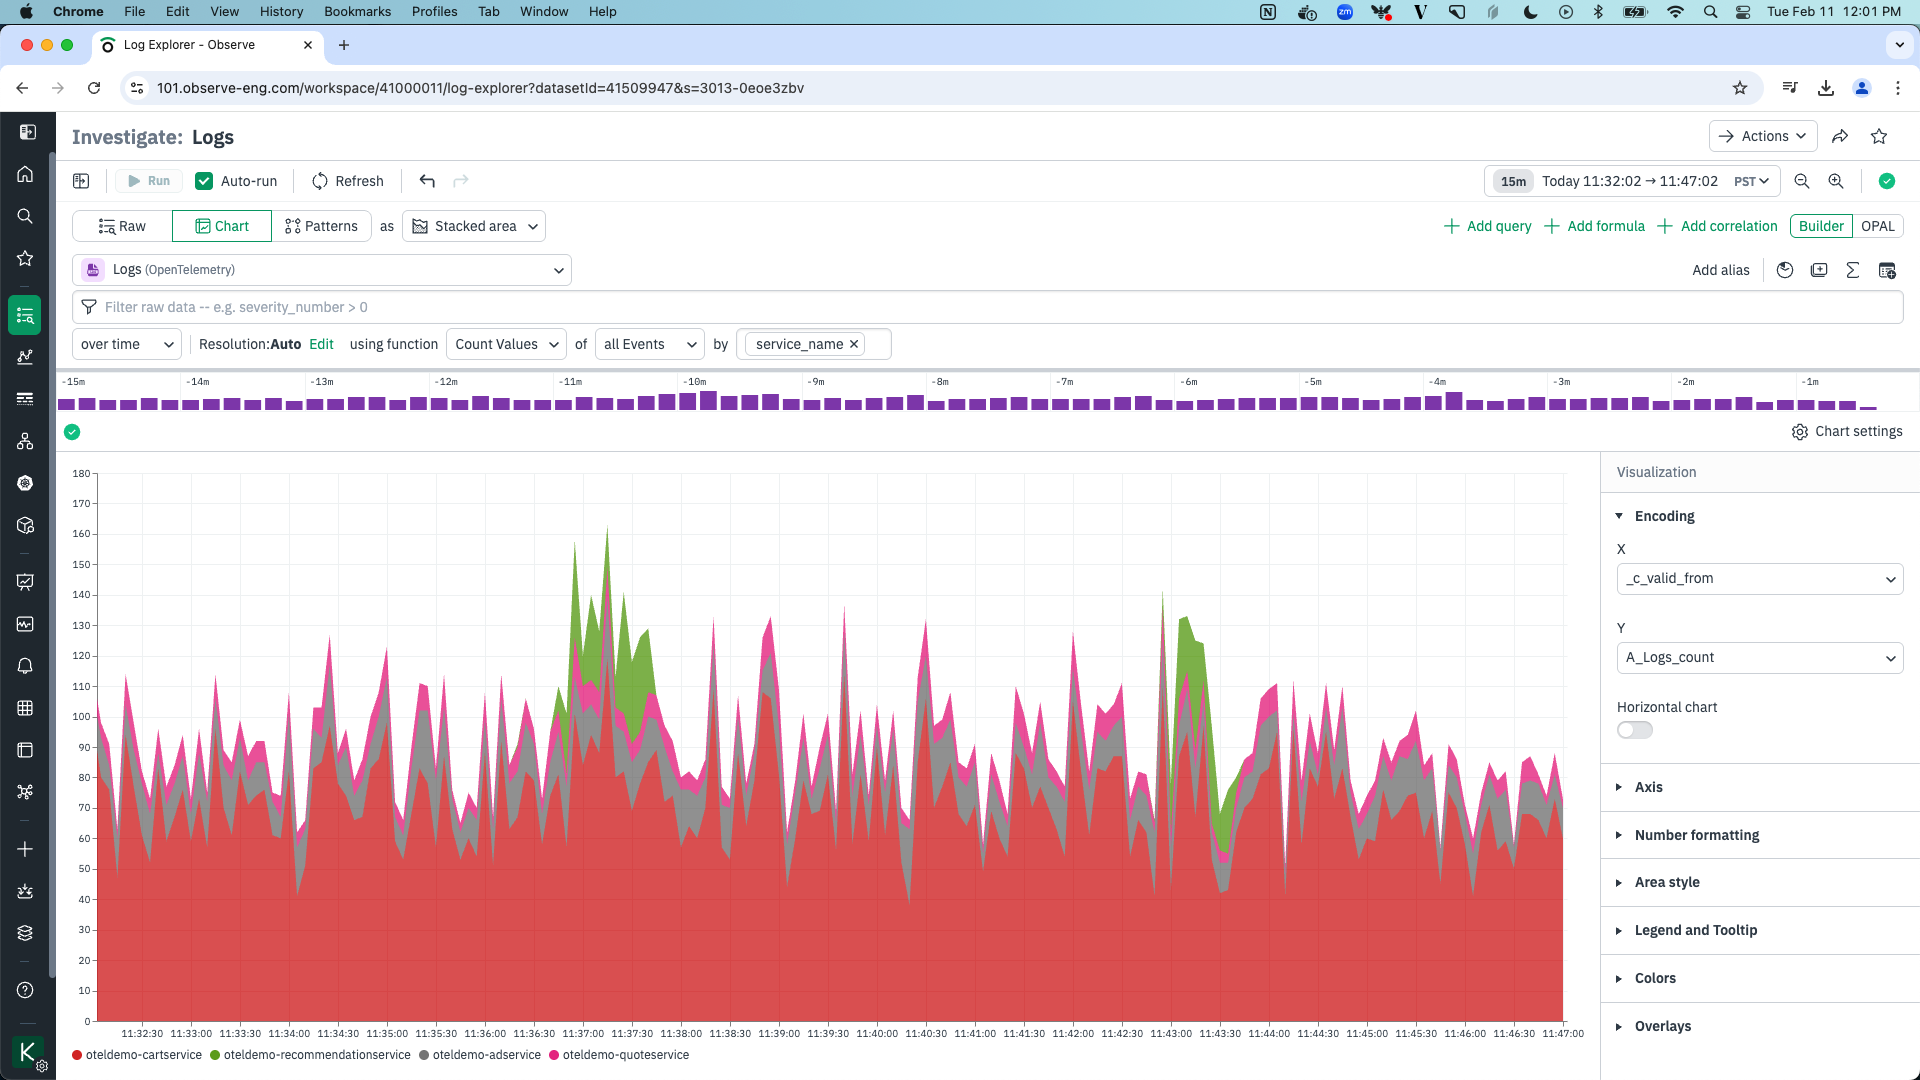
Stacked area
The stacked area chart is like a line chart, but values are ordered and stacked with smaller values on the top. This is useful for comparing related values in context while preventing some values from being hidden by overlapping.
Single stat
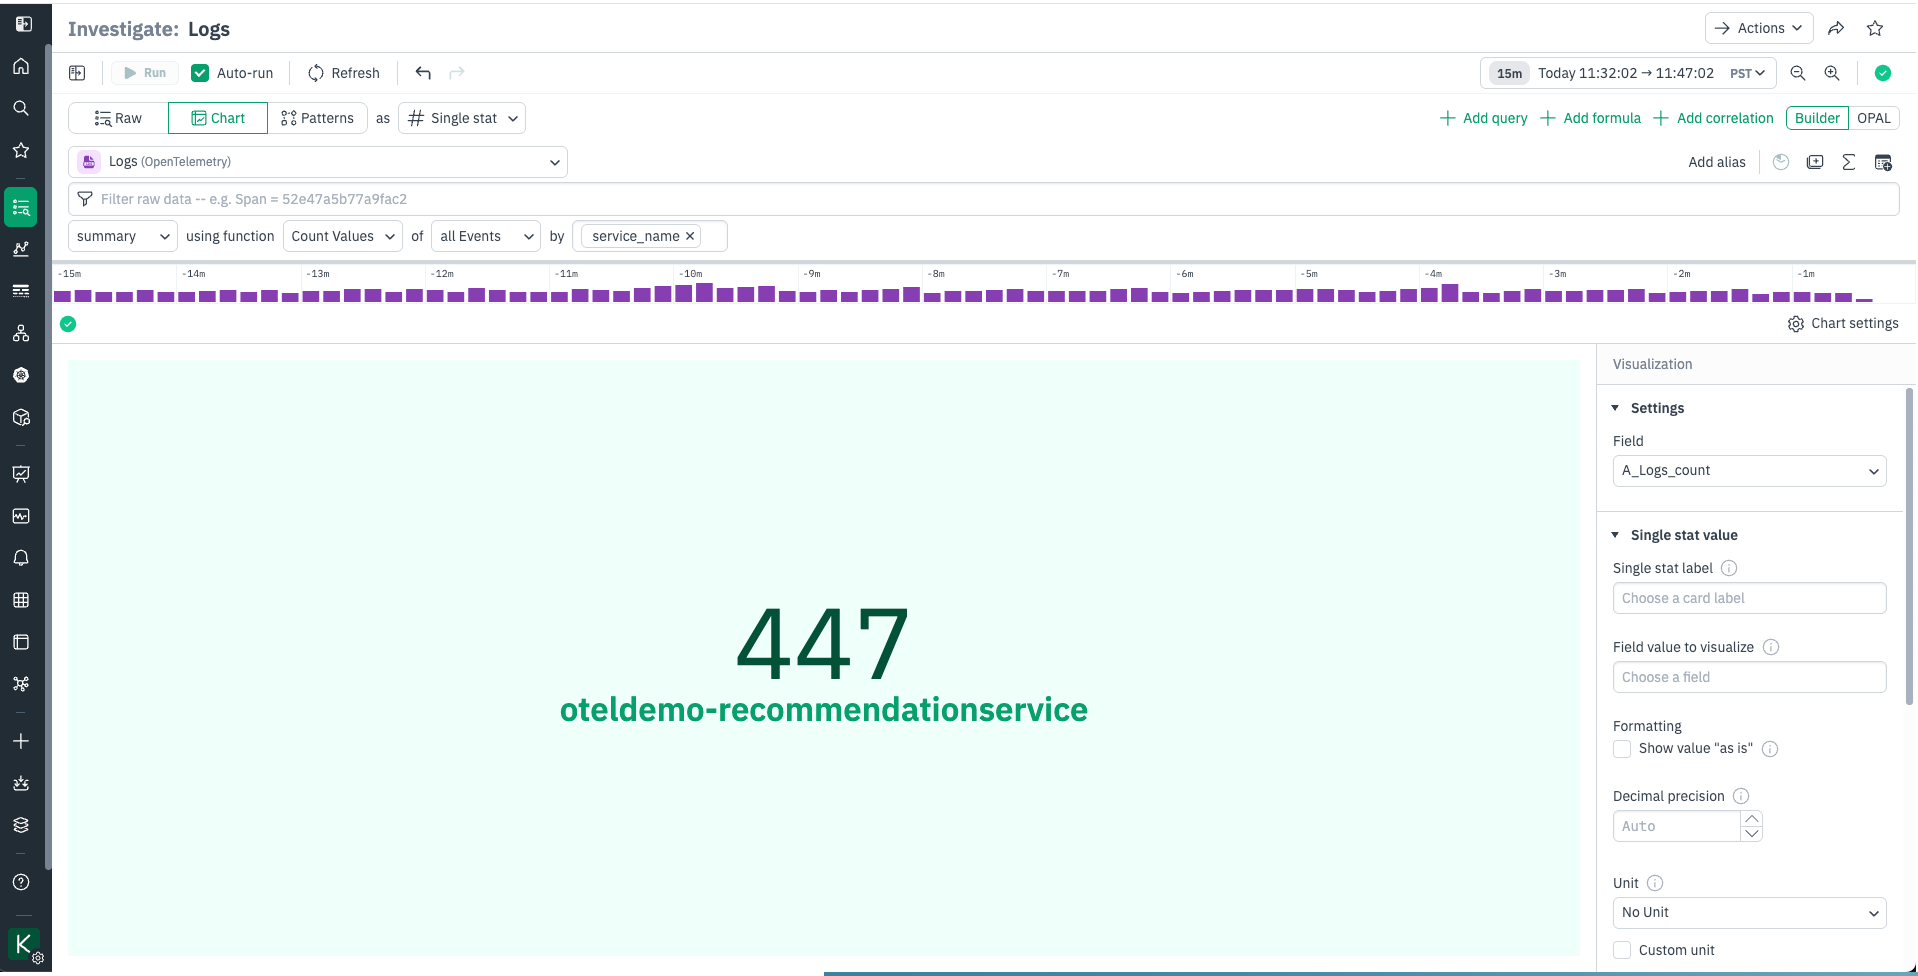
The single stat chart presents the latest value for a single field. The field name and an optional label are also displayed.
The Settings area has a single option, for setting the field that will be displayed.
The Single Stat area lets you add a Label to display below the value and select a single value to filter the field by.
If the charted field can have multiple values, you may only want to display a single one. Use Field Value to Visualize to select this value. For example, given a field that might have function IDs or the string ERROR, you can put ERROR in this field to create a panel that is blank unless an error is in the data. Under Formatting, uncheck “Show value as is” to enable the Axes section.
Pie chart
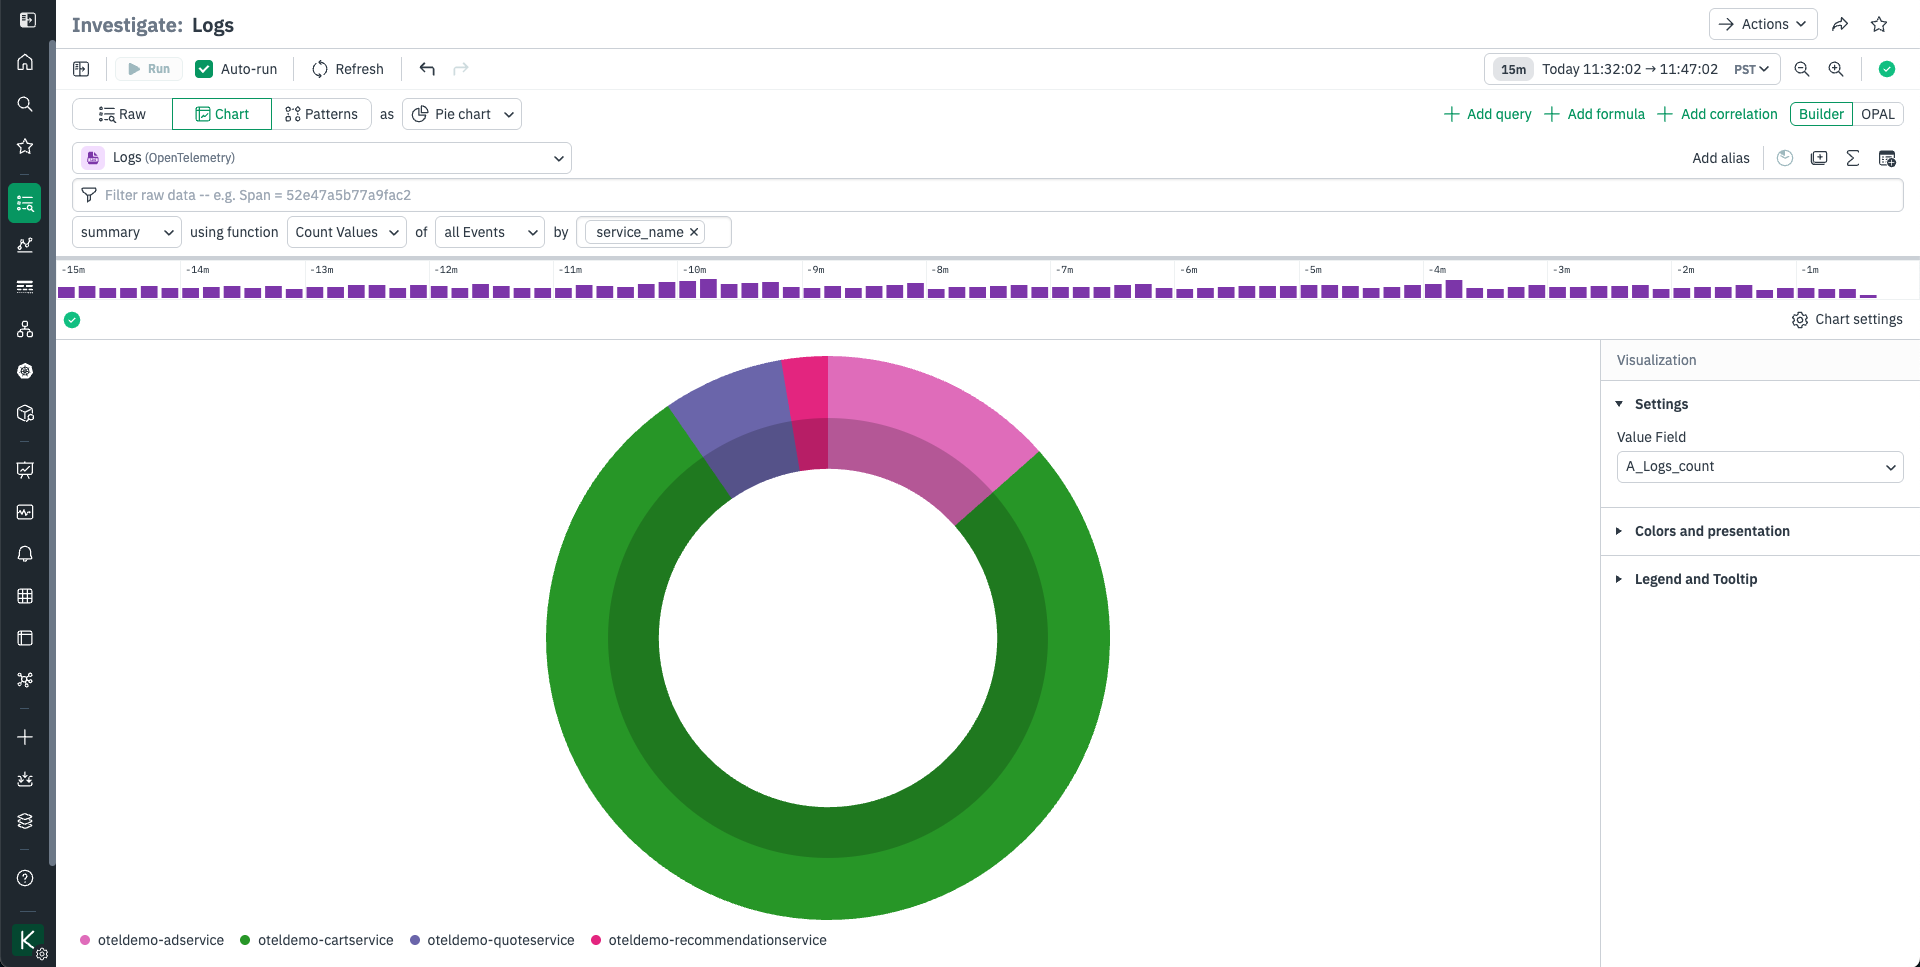
A pie chart is a familiar visualization which represents the relative size of values as slices of a circular graph. The pie chart visualization is ideal for visualizing datasets that naturally produce a complete whole, such as the number of tasks executed in a time period by a continuously running task engine. Note that Observe’s pie chart defaults to rendering as a ring with a shaded center, this a style decision that reduces human estimation errors.
The Settings area has a single option, for setting the field that will be displayed.
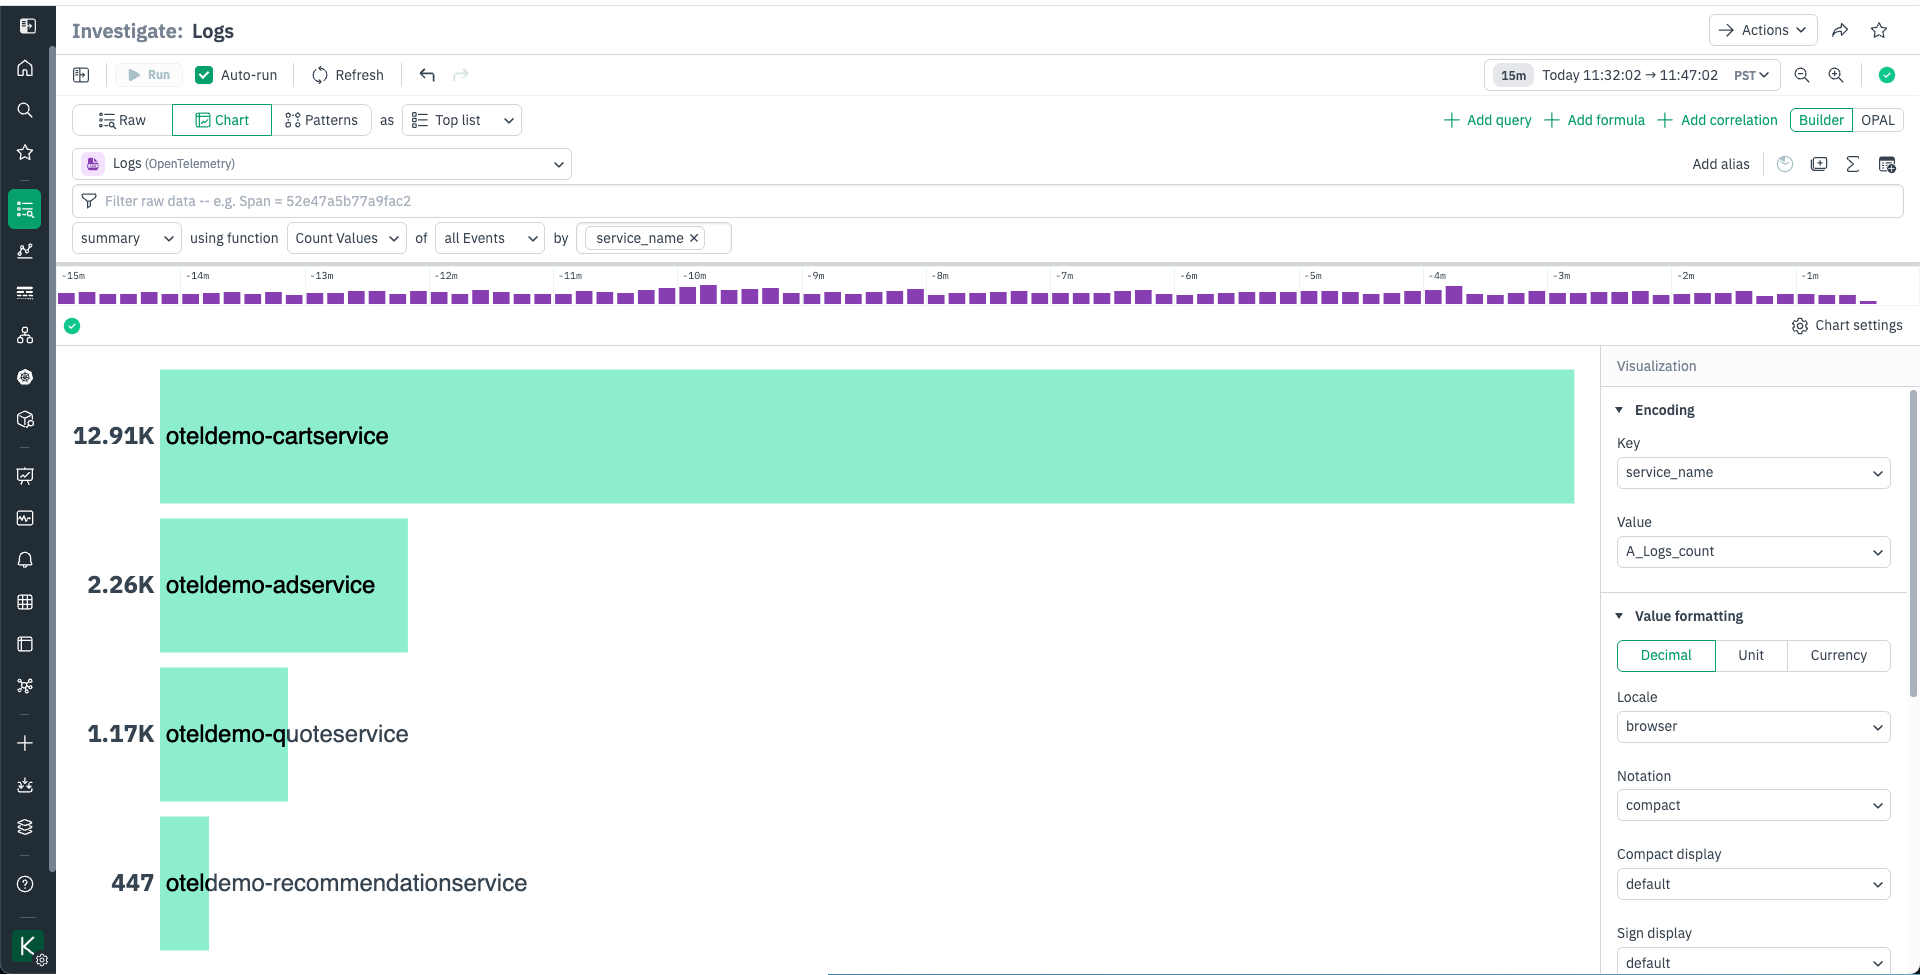
Top list
A top list visualization displays the Top N (where n is configurable) items from a query. It is a helpful way to visualize the top groups for a specific query.
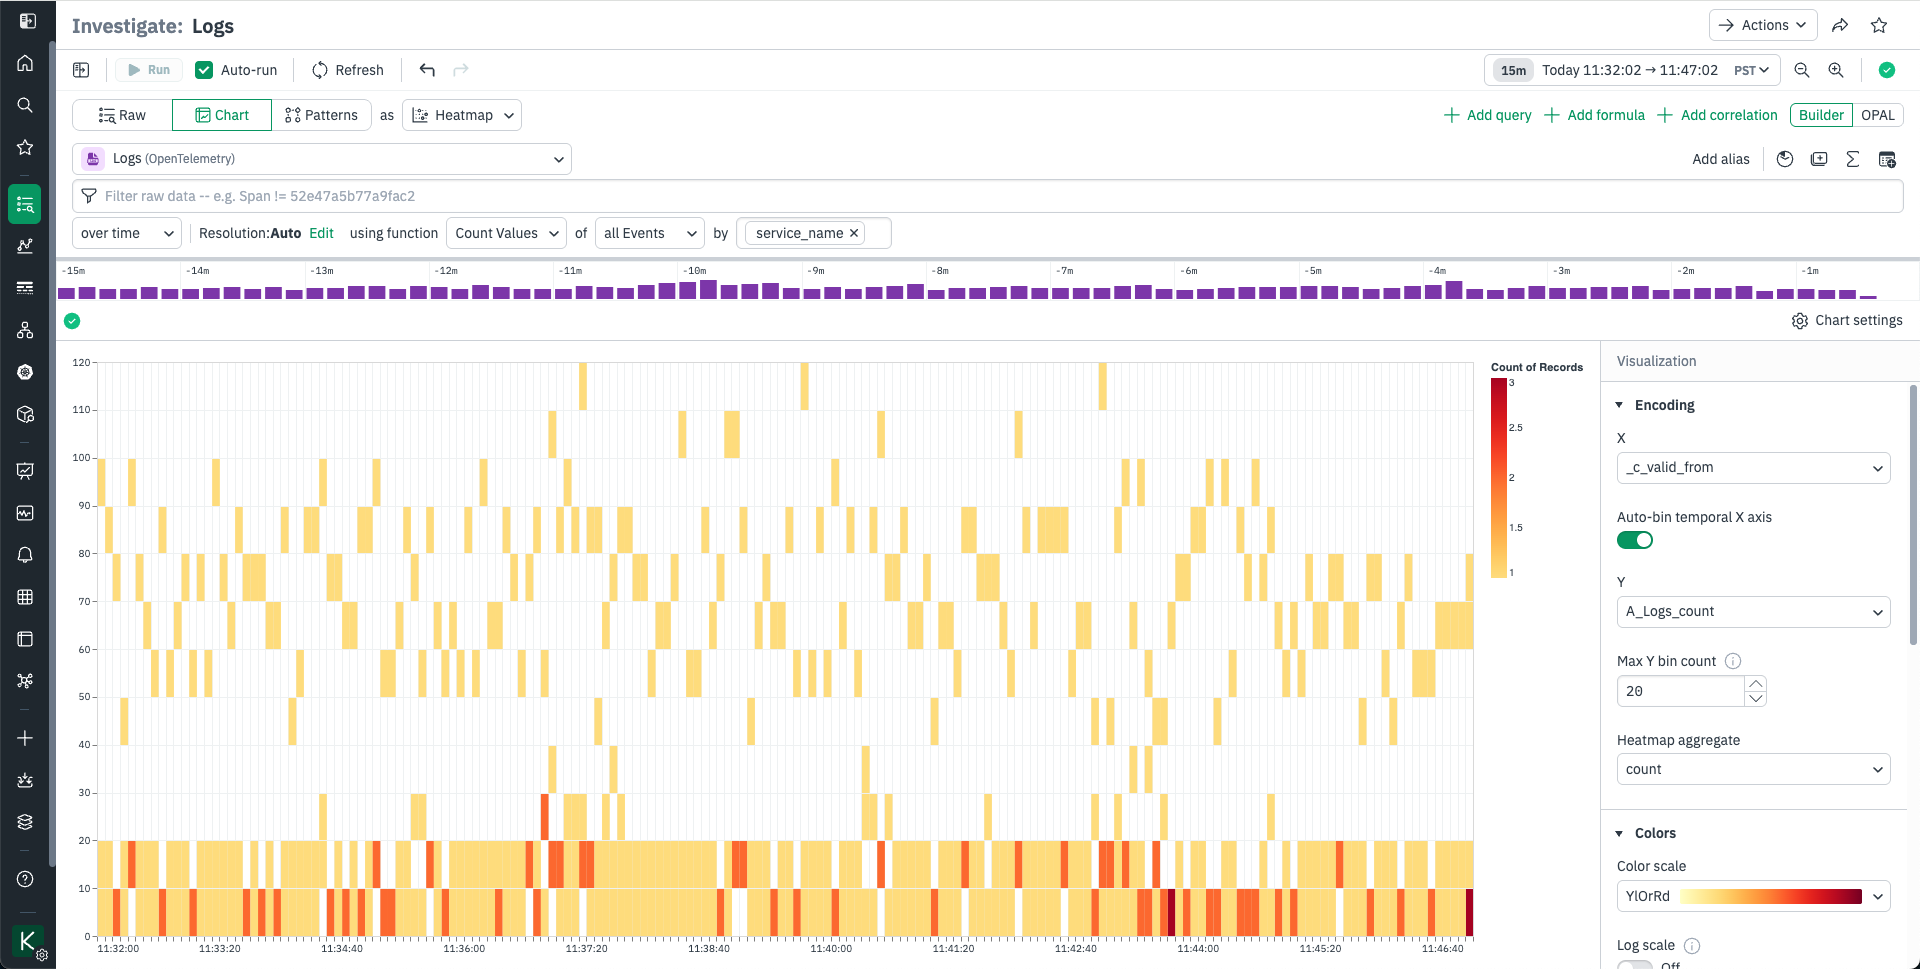
Heatmap
A heatmap is a configurable visualization that displays an aggregated value as a color (to represent a low to high gradient) within a 2D grid.
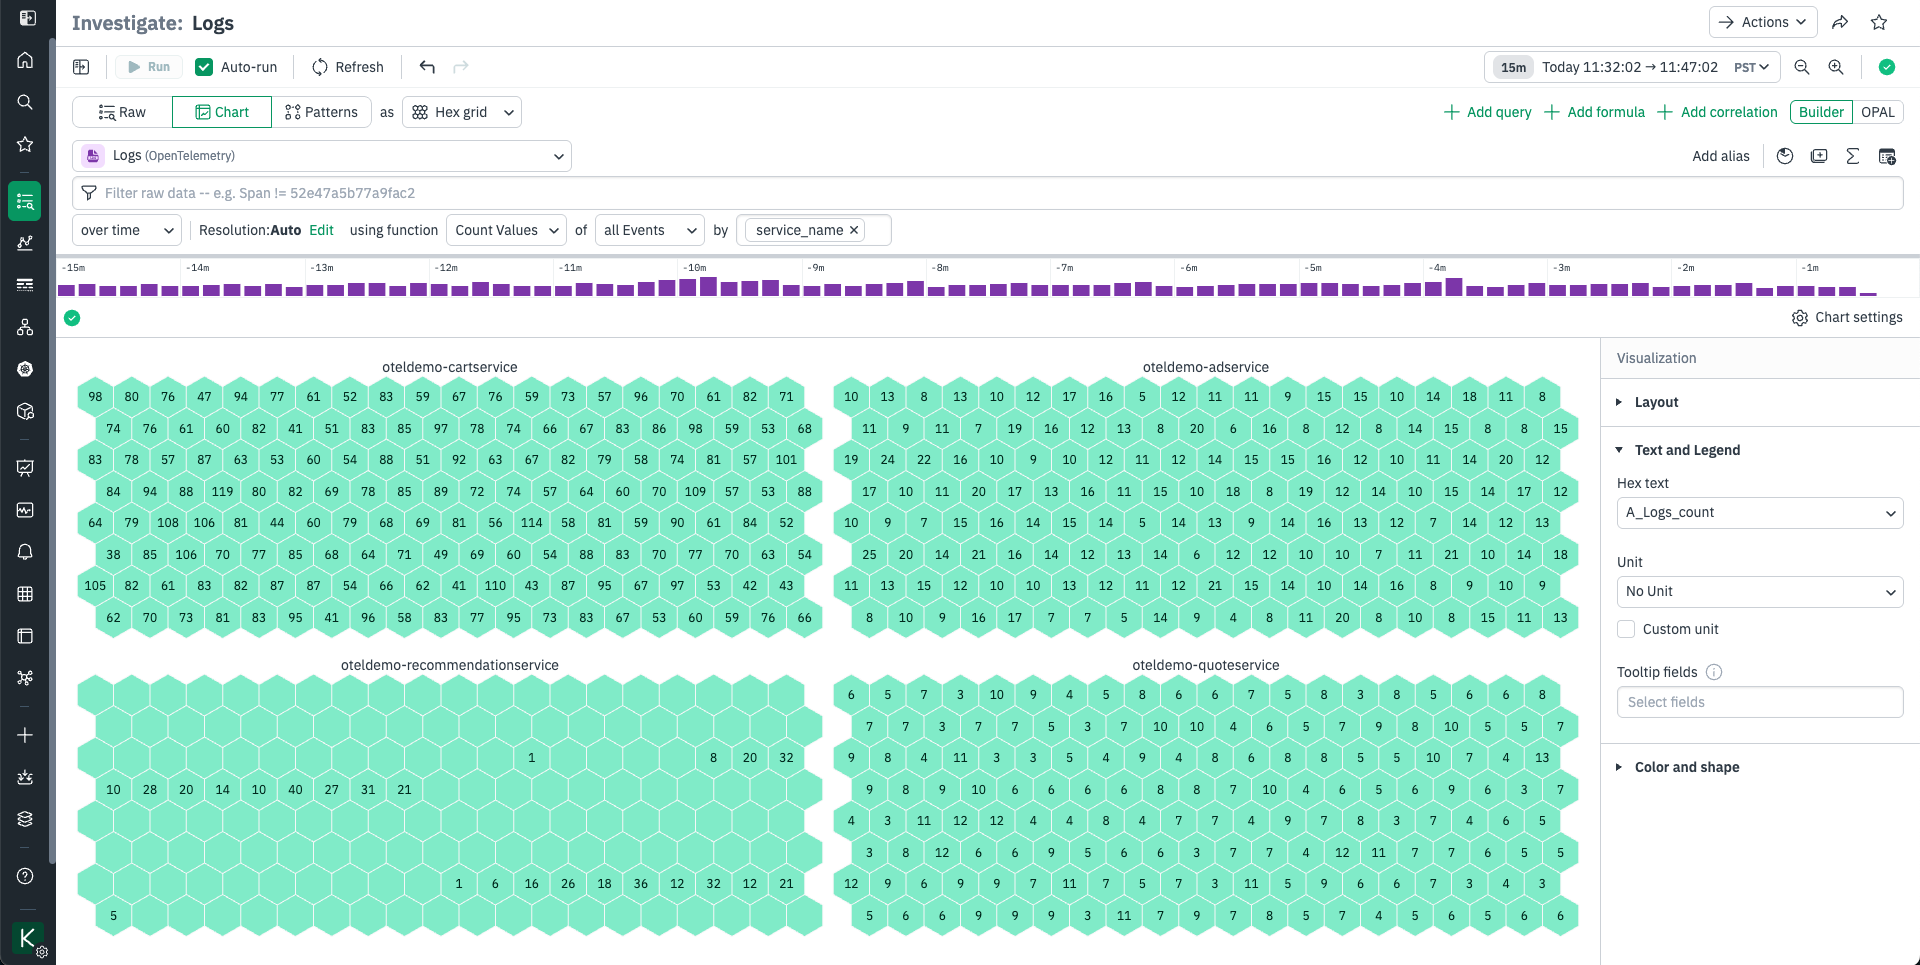
Hex grid
A hex grid is a way to visualize data grouped into sections (hexagons) with the option of adding a color and label to each hexagon. It can be a helpful way to get a quick overview of a variety of objects, such as Nodes or Servers.
The hex grid visualization is for logically grouping and annotating data. This visualization arranges your data into groups of uniformly sized hexagonal grids, like cells in a honeycomb. Each hexagon can be labeled and colored by data-driven rules.
Use the Layout option to choose a grouping Cohort. Hexes will be grouped together by this column’s value.
Use the Text and Legend area to select the column that will be used to label and color your hexes. Hex grids can all be one color, set by threshold or value, or set to follow one of two types of dynamic color scales:
- Threshold lets you set colors for numeric values at or over a threshold. To set colors by the values in a field, use the Threshold option and select a Field, then set the threshold values. Thresholds are sequentially ordered.
- If you have multiple values in a column, use the Value option and select the values to color hexes by. Click the pencil to the left to set its color.
- The Range option is where you select dynamic ranges. Select a numeric Field to apply range scaling with, then select a Color Scale Type. Sequential is suitable for “less to more” sequences; for instance if you want to visualize the number of sales per U.S. State. Diverging is suitable for “this vs that” sequences; for instance if you want to compare successful transactions to errored transactions per U.S. State. You can also adjust range bounds and midpoints here.
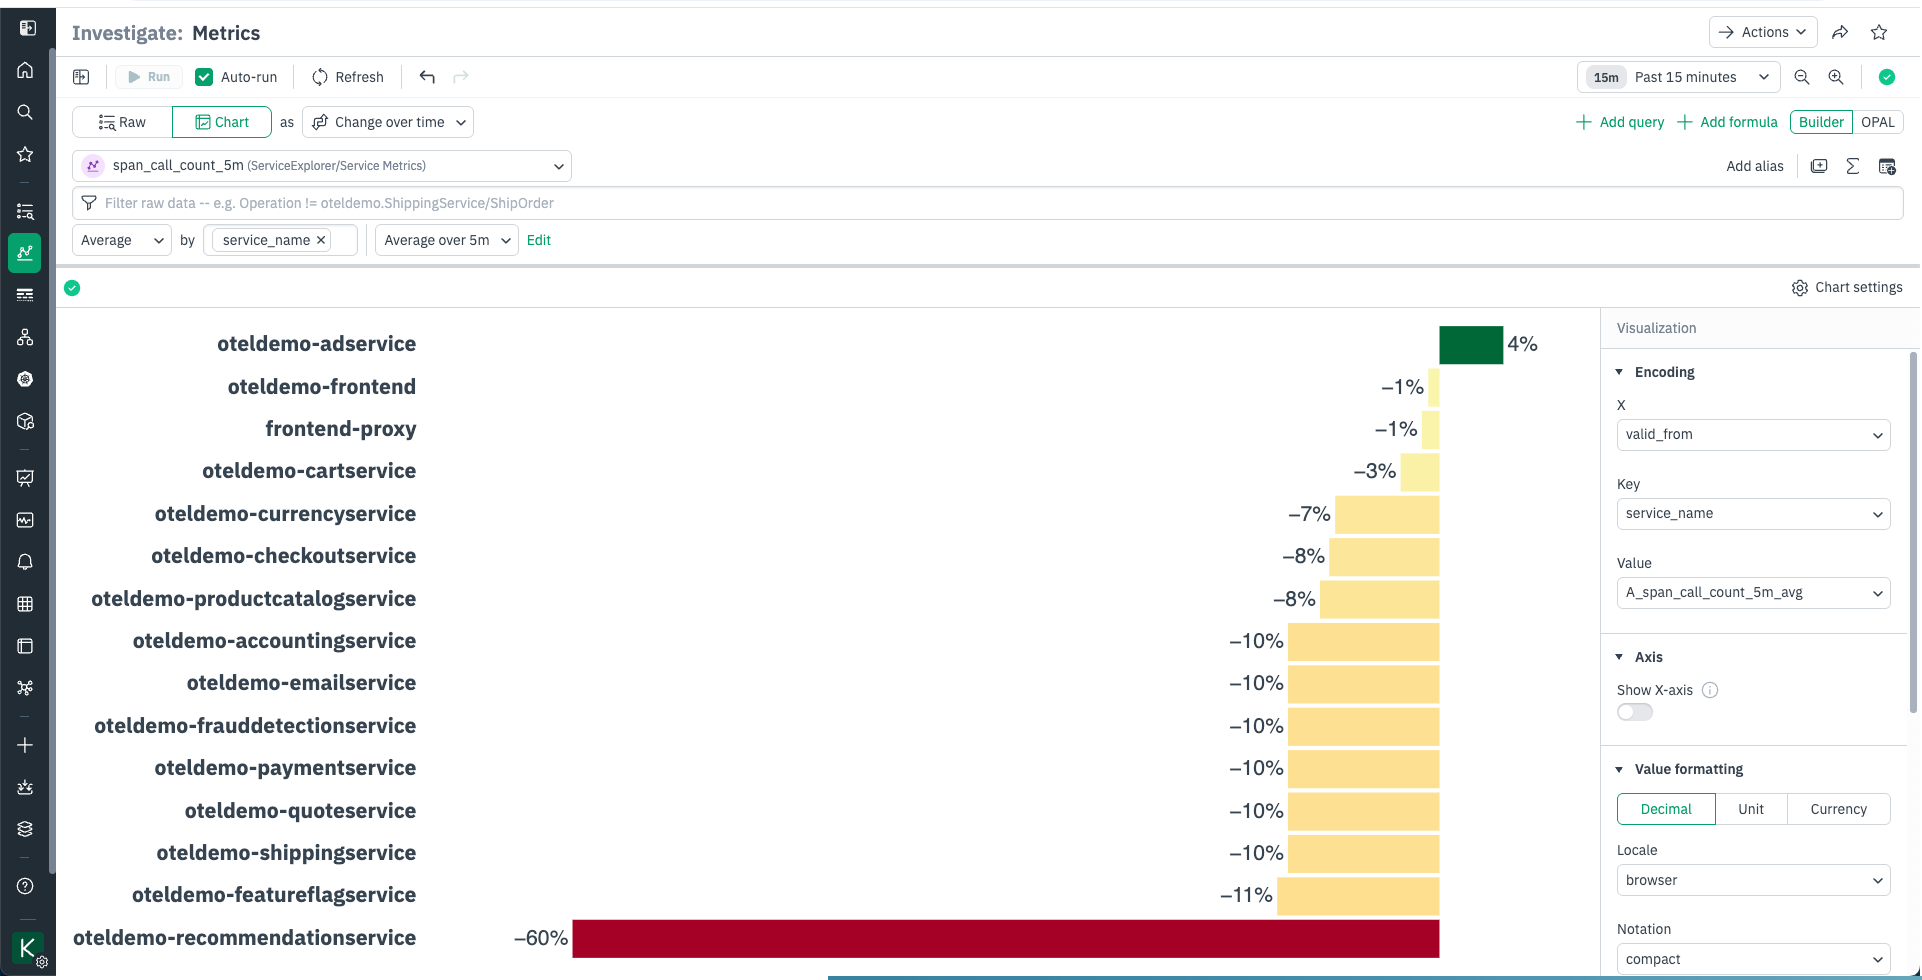
Change over time
Change over time is a convenient way to visualize the change in a metric over the query window, split out by groups.
Geographic map
The geographic map visualization helps you visualize data on a map of the world. It requires that you have extracted latitude and longitude values, and can optionally use Country, Region, and City values in enriched tool tips on location dots representing the data.
The Settings area has two options for setting the required fields that are used to position dots on the map.
- Latitude field is where you set the latitude
- Longitude field is where you set the longitude
The Geographic Map area has four options for handling non-required fields.
- The Country field is used in the tool tip display for a rendered location dot.
- The Region field is used in the tool tip display for a rendered location dot. Region is a normalized standard name for areas that may have different and more familiar names, such as State, Province, Territory, or District.
- The City field is used in the tool tip display for a rendered location dot.
- The Tool tip field is used to edit the content of the enrichment tool tip. The default is to show all fields in the data set; use this field to reduce the set. Note that these fields are not used to place dots, only to enrich them.
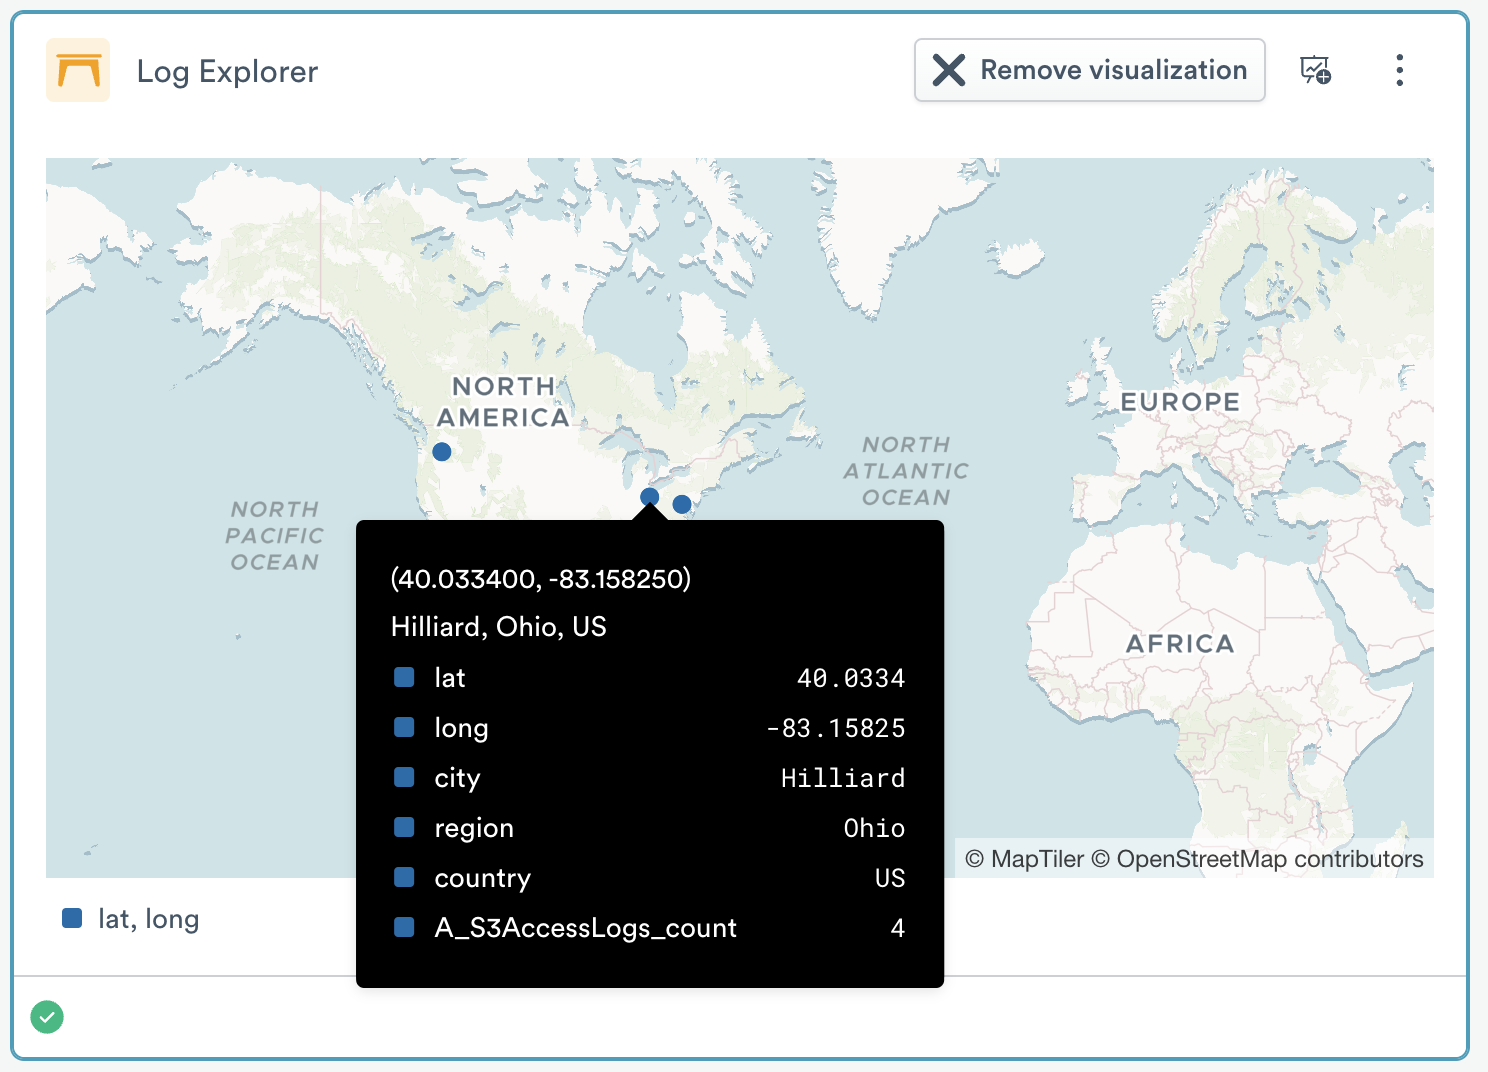
The Color area allows you to manage dot colors. If you want a single color, use the Single option and select a color from the palette. To set colors by the values in a field, use the By Value option and name each value, then click the pencil to the left to set its color. If no changes are made in this area, Observe will randomly select colors.
Geographic Map charts have a legend which names the value being charted and shows its matching color. The Legend area lets you change the position of this legend to any of the four edges of the visualization. You can also change how null legend entries are displayed, which can be useful in sparse datasets.
Choropleth map
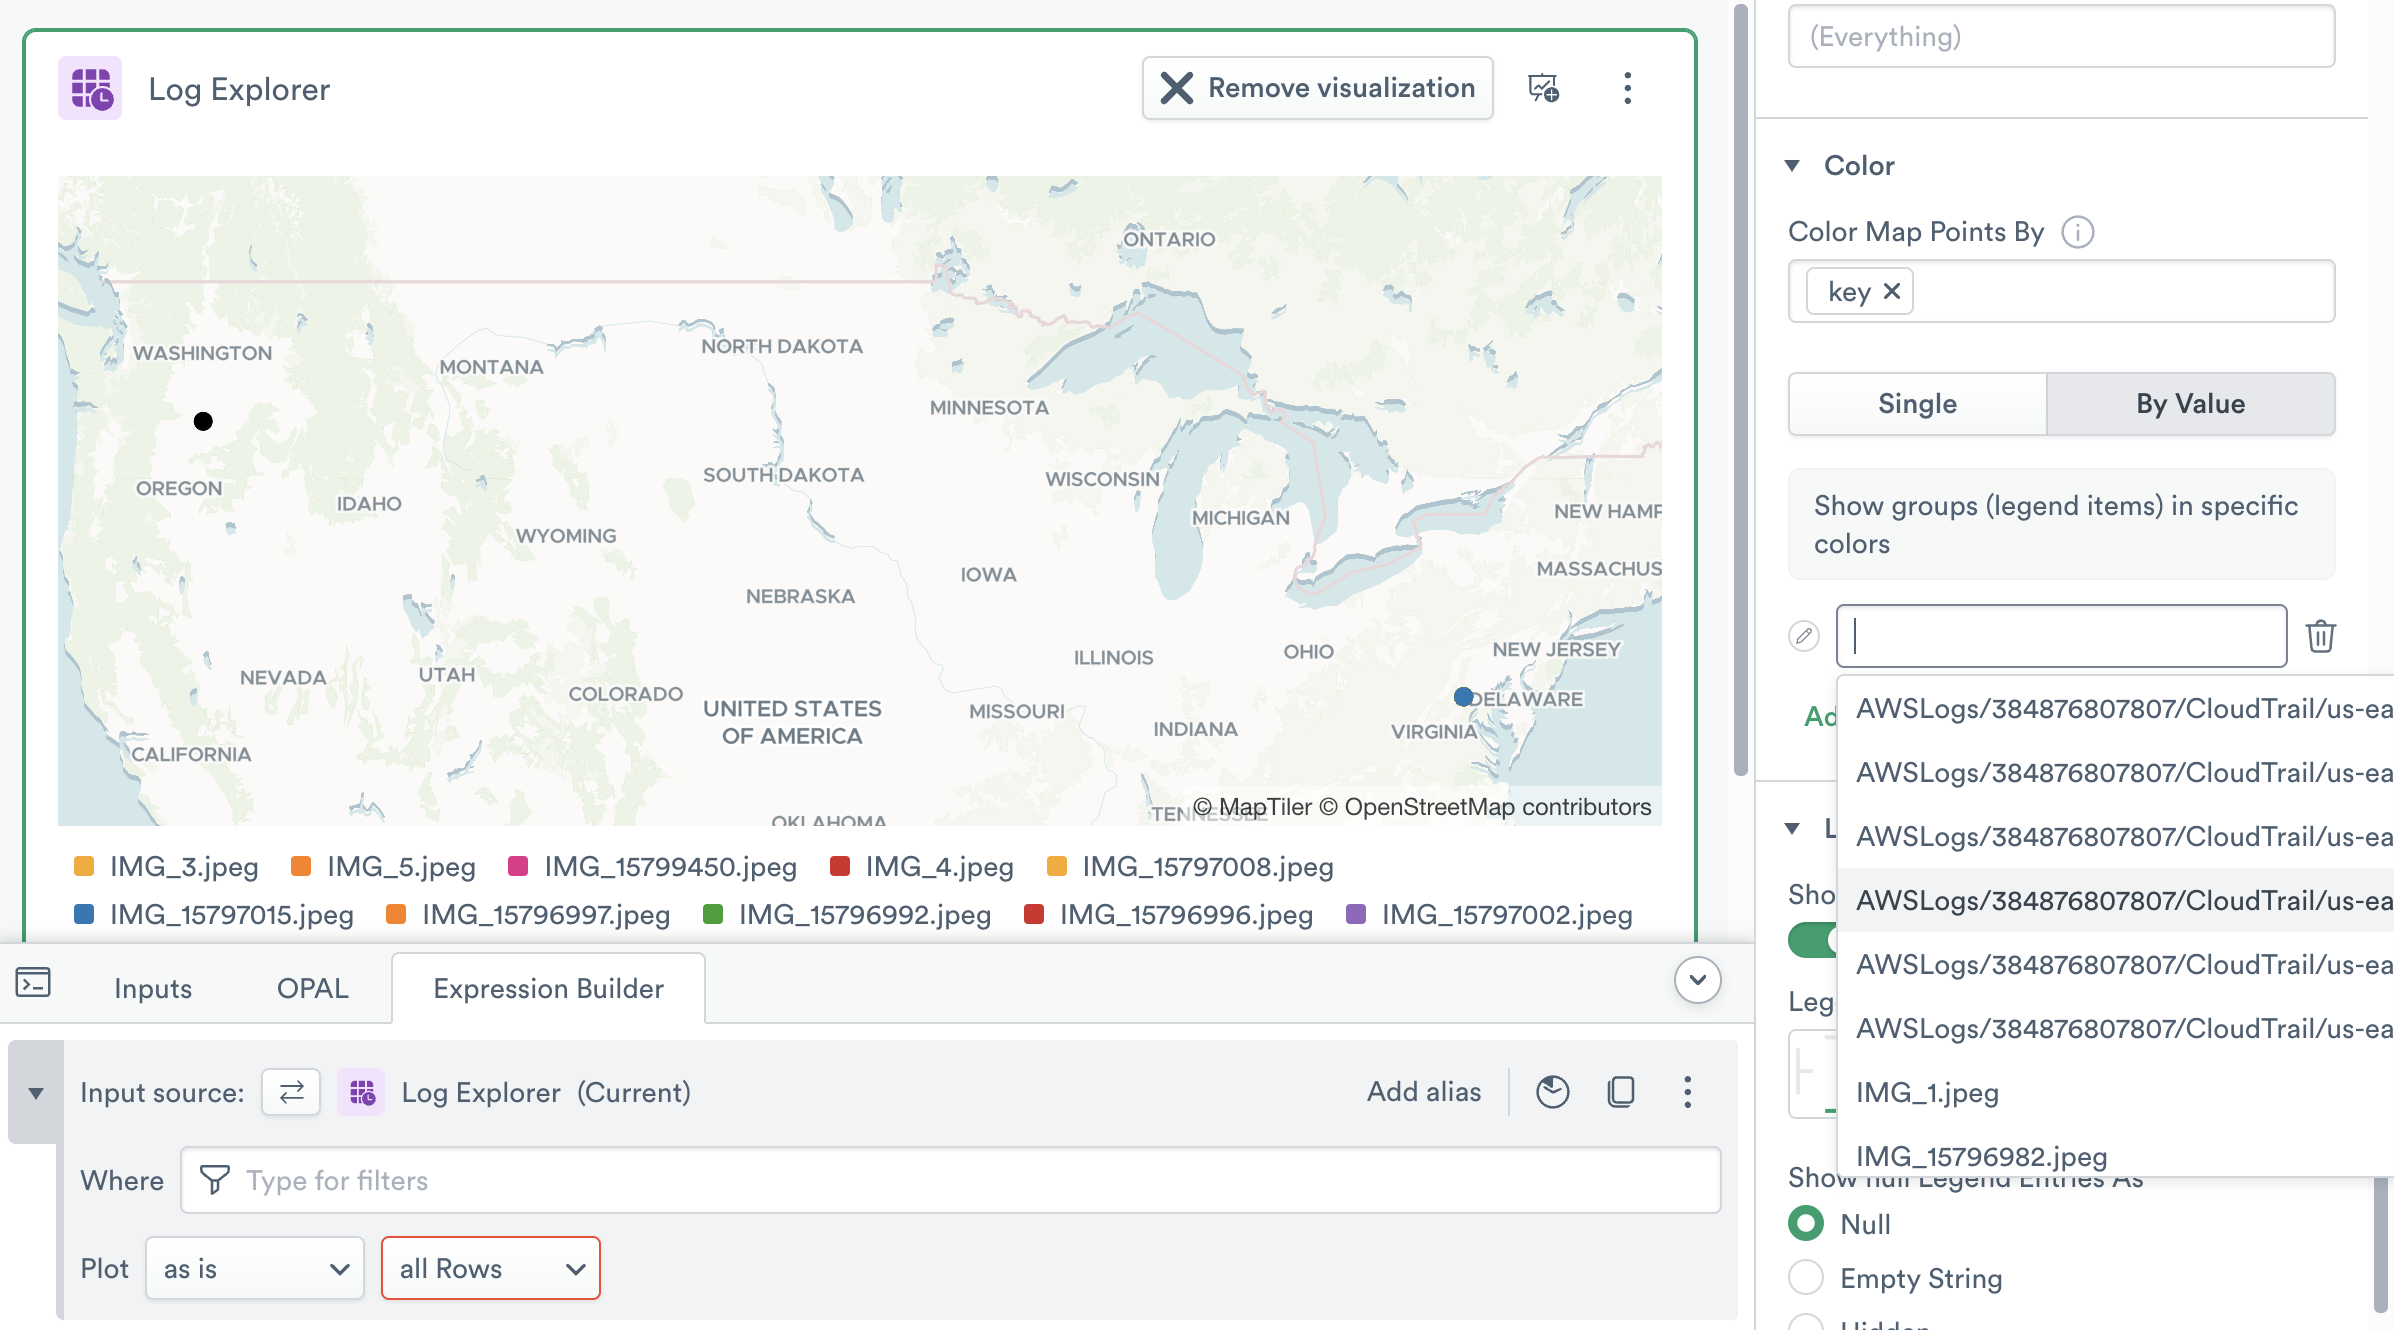
The choropleth map visualization helps you visualize data on a map of the world using color fills on political regions. It requires that you have extracted Country and optionally Region values into a group using the Expression Builder. The country field should be a 2-letter country ISO code. You may optionally add a Region name, but only U.S. states are fully supported at this time. Note that spelling can differ from regional expectation and needs to match; use the MapTiler Geocoding control to test if strings can be located.
By default, only the top 100 groups or objects are visible in an Observe visualization, but many choropleths will have more groups than this. For instance, a world map of countries has 198 objects. To properly display this map, click Add Function, then TopK, then set the number of objects that will be included to 200.
The Settings area has a single option for setting the name of the integer field that is used to color the map.
The Axes section allows you to select the unit size that is displayed in the chart.
- Unit lets you set the base unit type of the variable. You can select from pre-existing options such as weights, volumes, and data amounts, or enter a custom unit label. Custom units do not perform any math conversions on the data. See Units of Measurement for more detail.
The Color area allows you to manage fill colors. Choropleths can have one of two types of color scales:
- Sequential is suitable for “less to more” sequences; for instance if you want to visualize the number of sales per U.S. State.
- Diverging is suitable for “this vs that” sequences; for instance if you want to compare successful transactions to errored transactions per U.S. State.
Waterfall chart
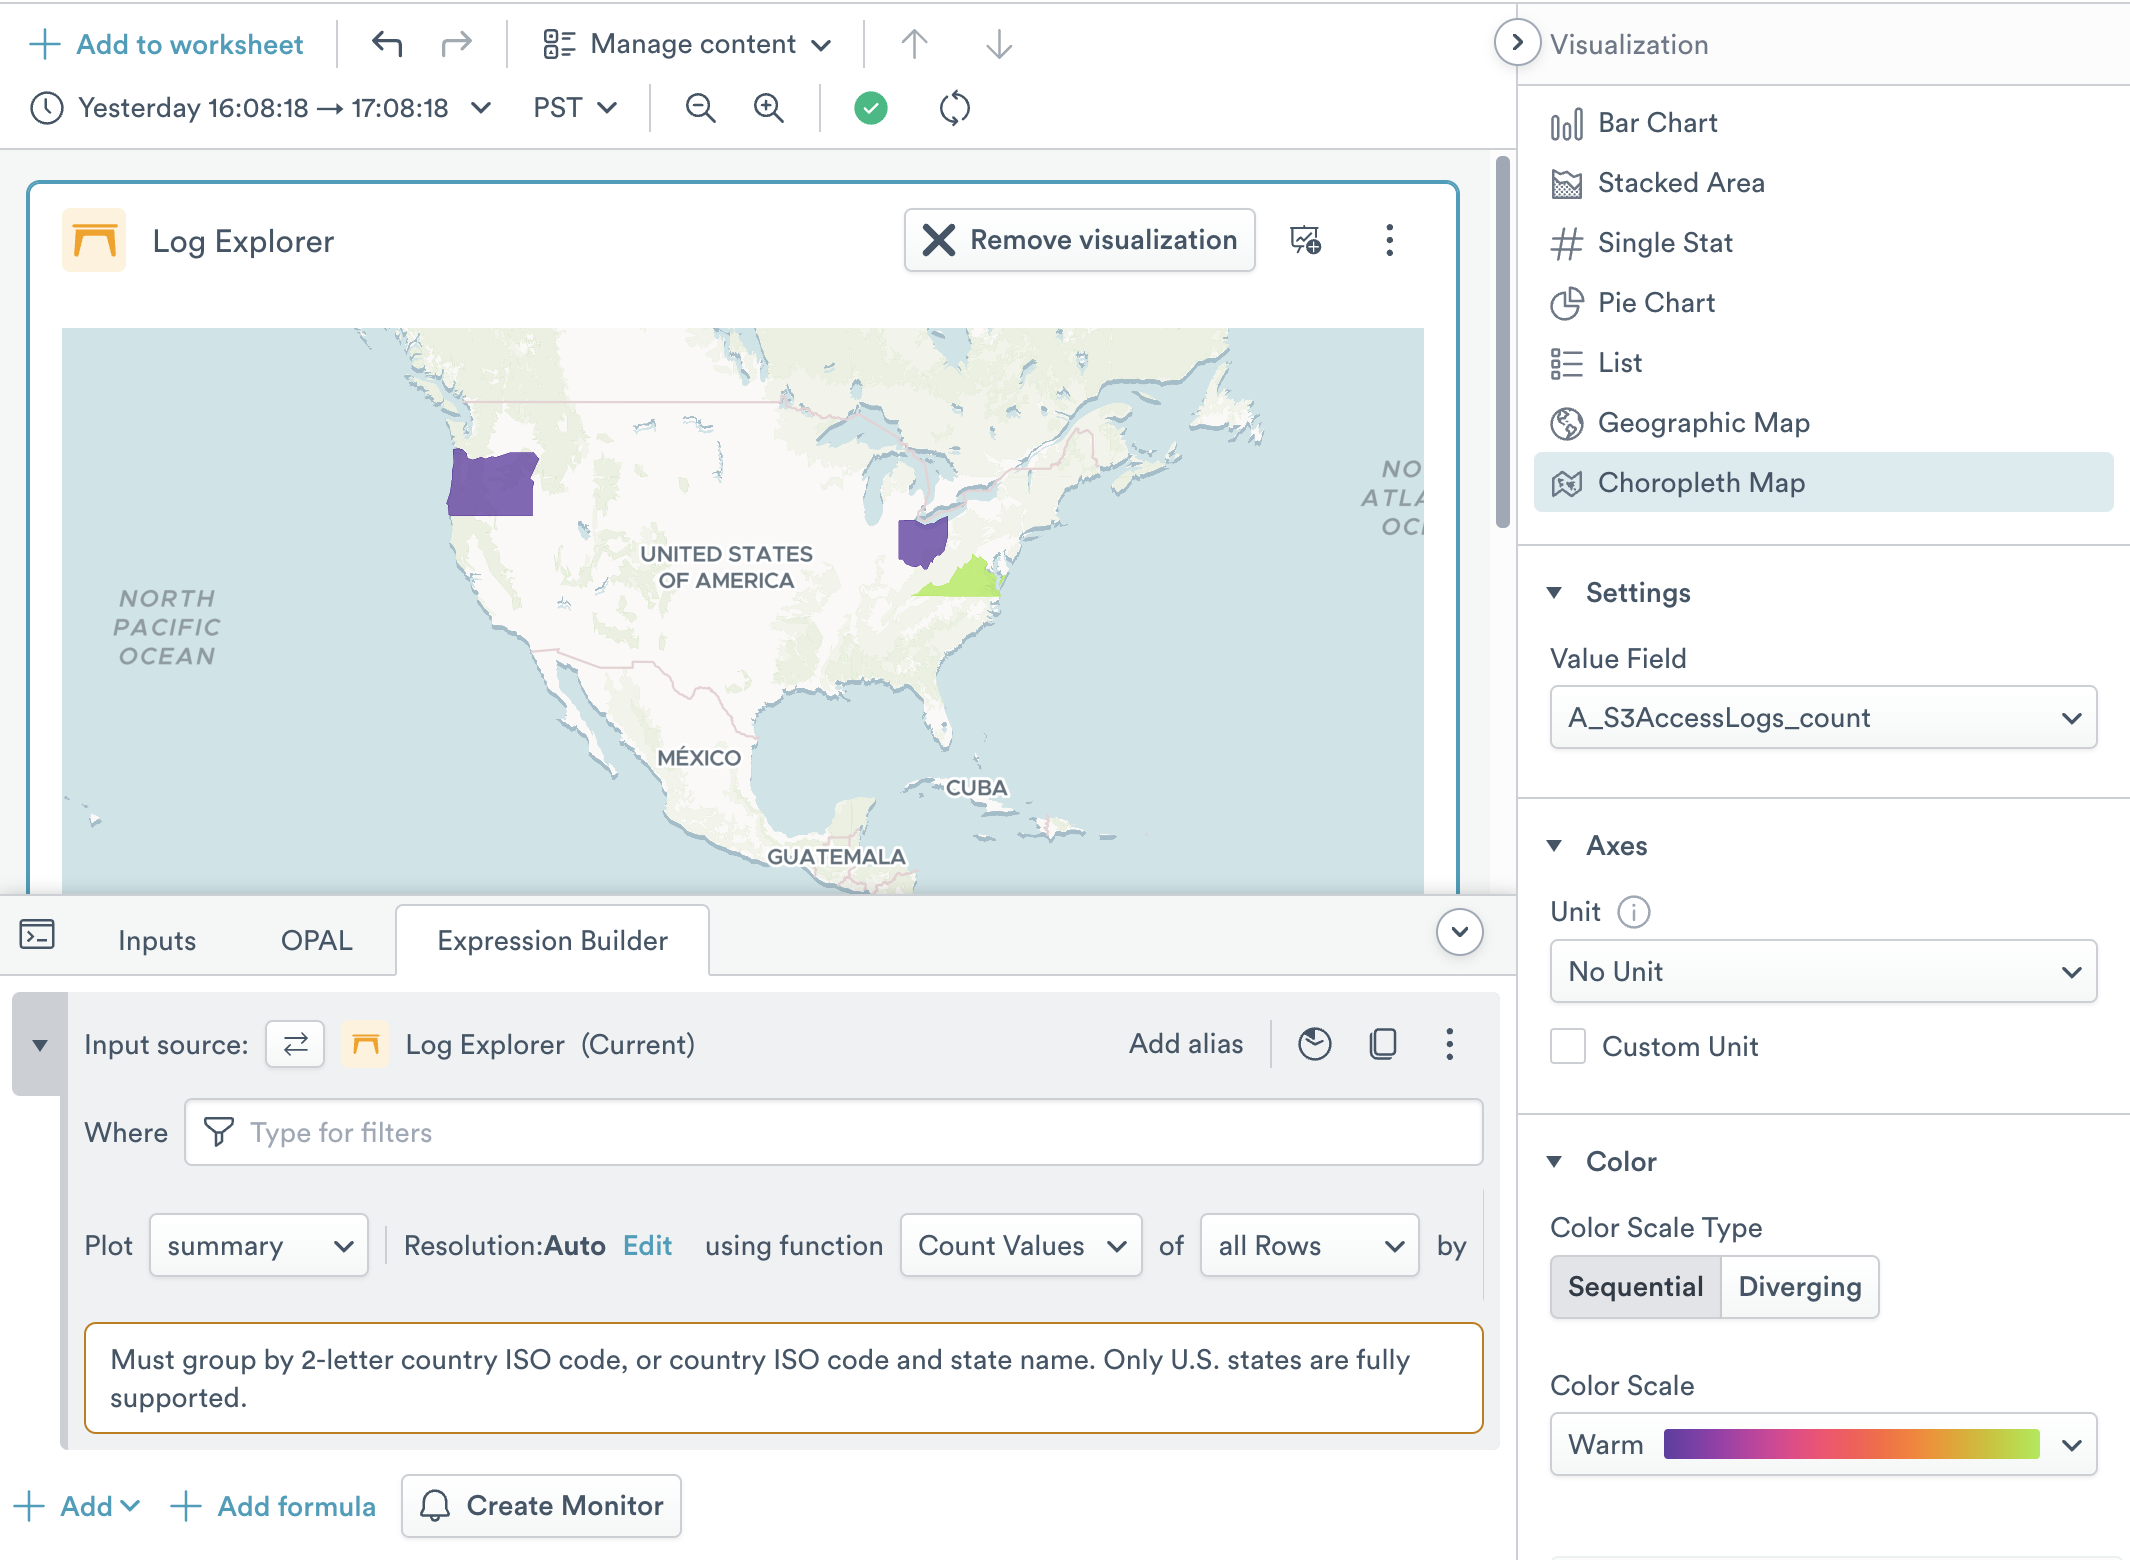
Waterfall charts are useful for analyzing span and trace data, and seeing how individual operations contribute to overall latency, where delays occur, and how different services or components interact over time. Waterfall charts work best with Datasets that have a parent/child relationship in the data, such as the Tracing/Span or OpenTelemetry/Span Datasets.
You can customize your waterfall charts by color coding specific fields. In this example, we color code by service name so that each service name has its own unique color:
We can further customize by highlighting errors. In the Error settings, slide the Color error rows toggle to the on position. In this example, we are highlighting any time a response_code contains an error, shown in red:
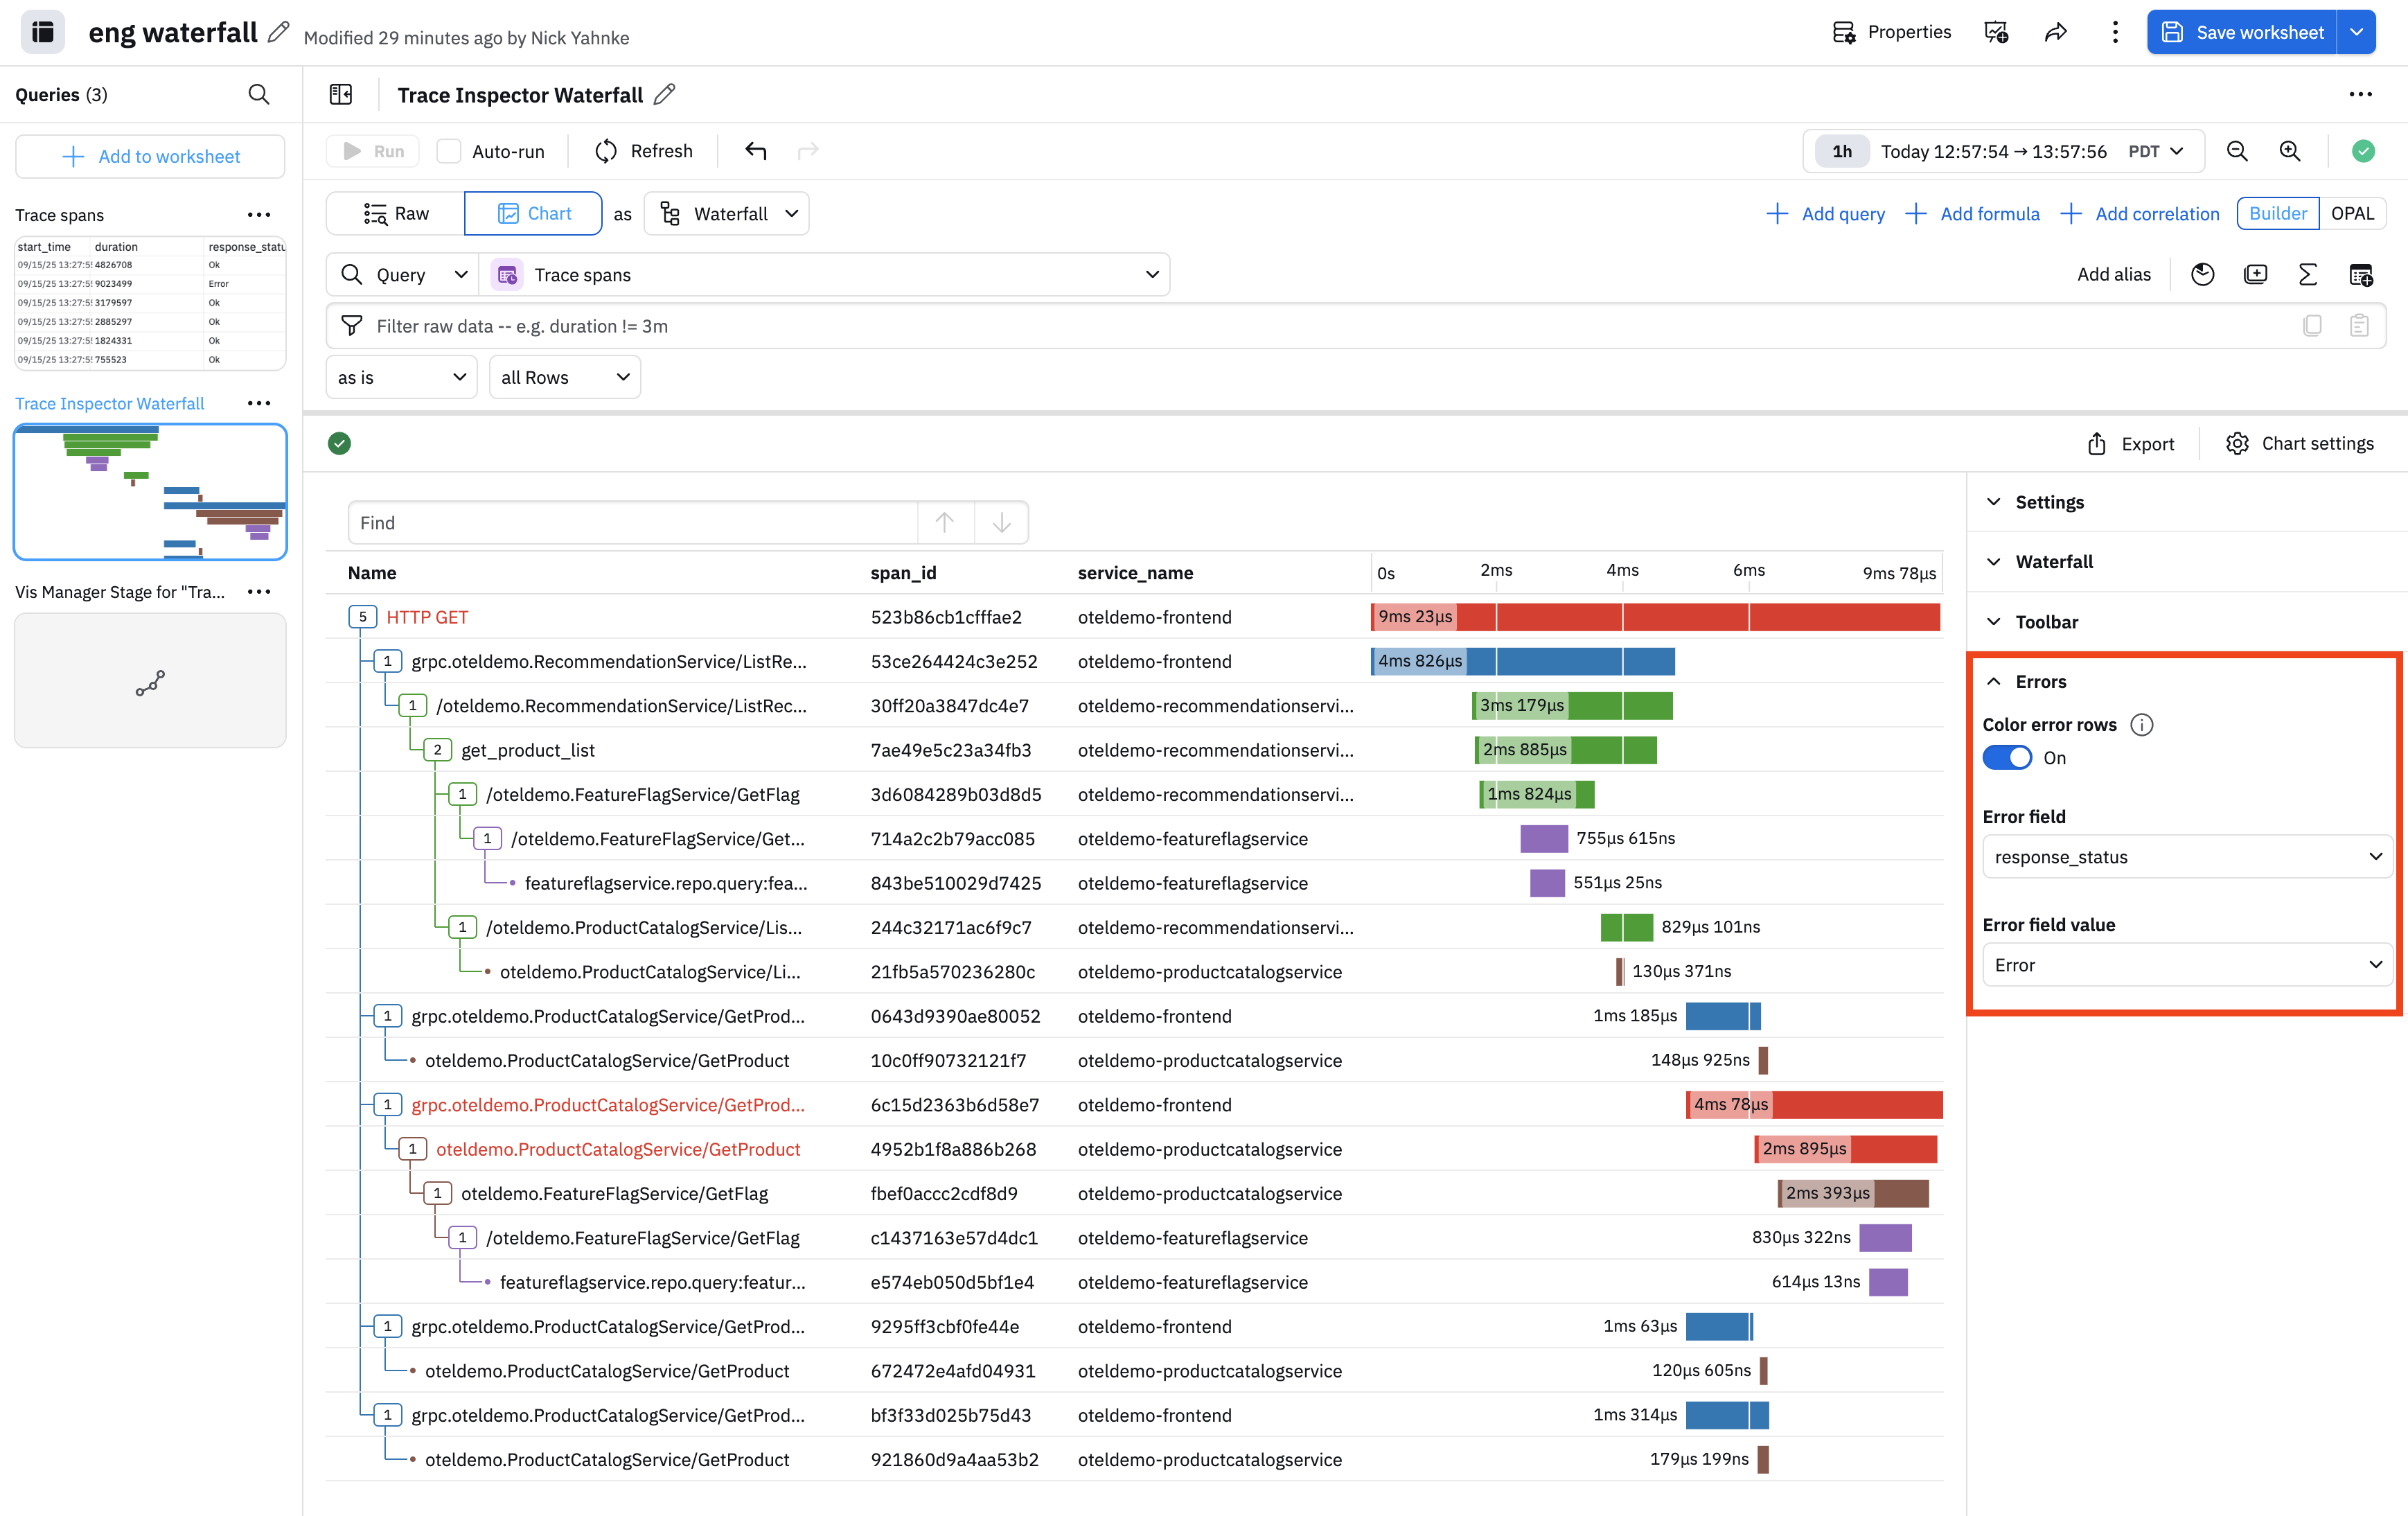
You can also customize the visualization by changing the table columns under Settings, and hiding the search field under Toolbar.
Customize the X and Y axis and number formatting
The Visualization Setting area has the following options:
- X Axis selects the variable that will be used for the horizontal range of the chart. A common option is to set this to a variable representing time, to make a timechart.
- Y Axis selects the variable that will be used for the vertical range of the chart.
The Axis area controls display of the X (horizontal) and Y (vertical) axis:
- Show X-Axis toggles the unit legend of the horizontal axis on or off. You can also add a Label string. You can also choose to hide the X axis gridlines. The range of the X axis can also be adjusted here. Select from Query Window (range is as long as the query) or Fit to Data (range is as long as the amount of data in the query).
- Show Y-Axis toggles the unit legend of the vertical axis on or off. You can also add a Label string. The minimum and maximum bounds of the Y axis can also be adjusted here if automatic sizing is not working for your use case. Activate the Y-axis log scale option and select a base size to use logarithmic scale. You can also choose to hide the Y axis gridlines.
You can also choose to set custom lower and upper bounds for the Y axis.
The number formatting section allows you to select the base unit type of the Y axis variable. You can select from pre-existing options such as weights, volumes, and data amounts, or enter a custom unit label. Custom units do not perform any math conversions on the data. See Units of Measurement for more detail.
Add summary statistics to your legend
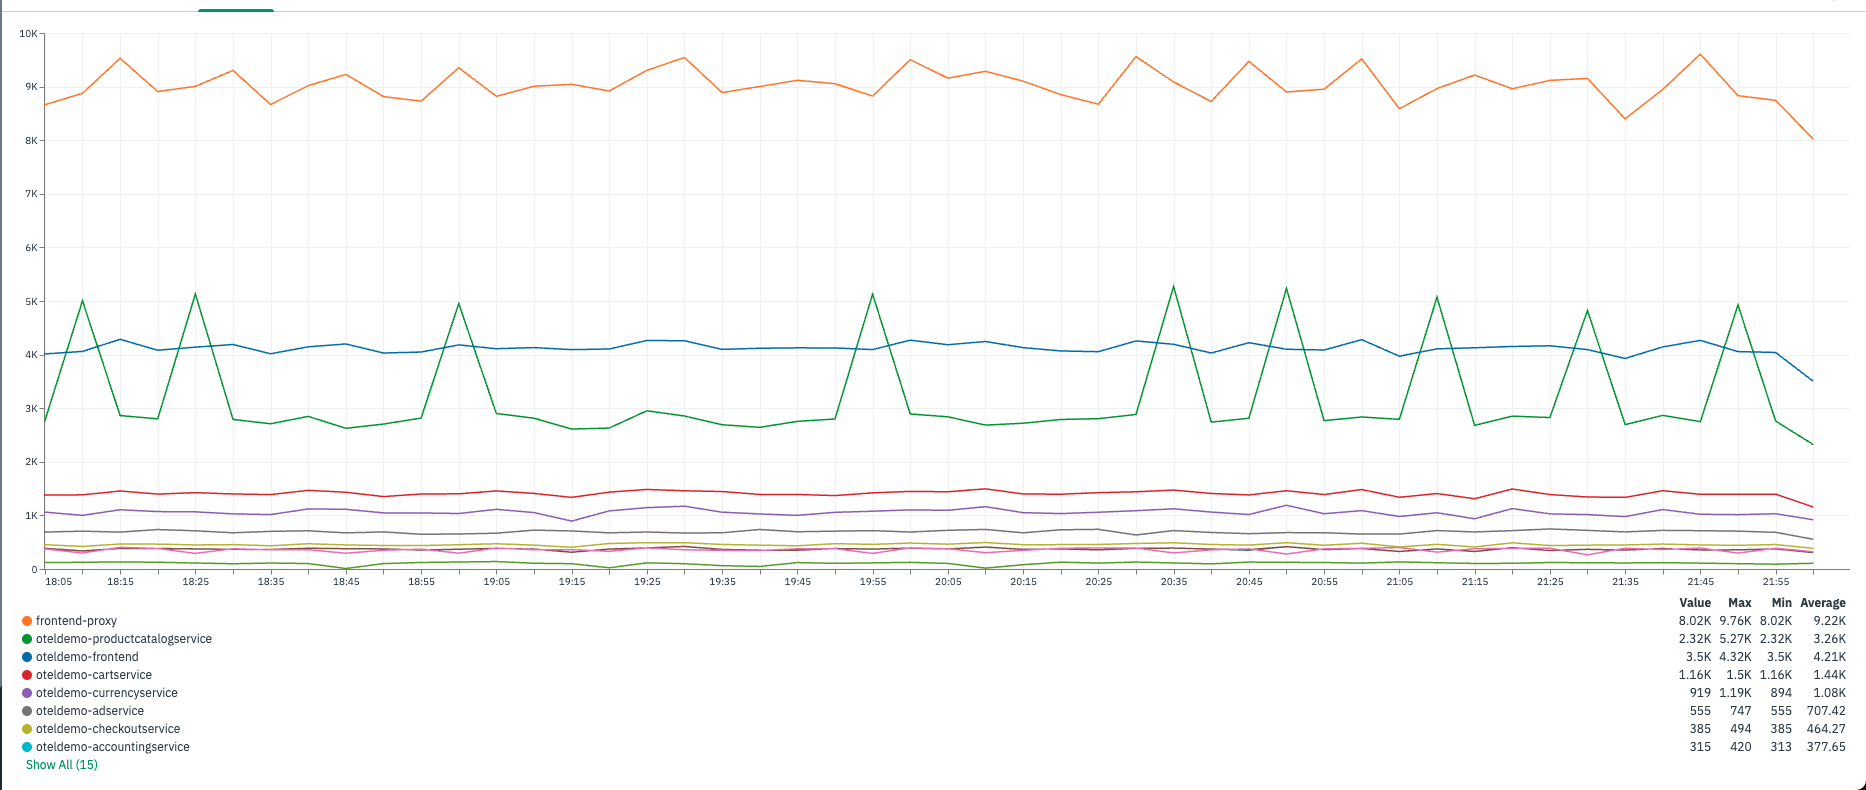
The Legend and Tooltip area allows you to customize the legend for the graph. If you choose Table presentation, you can choose to add the following values per series to the legend:
- Max
- Min
- Average
- Total
- Value
Manage colors in visualizations
The Color area allows you to manage line colors. If you have a single value, use the Single option and select a color from the palette. If you have multiple fields in a group_by, use the By Value option and name each grouped field, then click the pencil to the left to set its color. If no changes are made in this area, Observe will randomly select colors. The Chart Area Fill Style option in Color allows you to decorate a line chart with a color fill.
Add annotations to visualizations
The Overlays area supports adding Annotations to your charts.If you use this feature, you can overlay a threshold as a horizontal line or a shaded area over the chart. This makes it easy to visualize when the data is breaching an intended range. Multiple thresholds can be overlaid on a single chart.
Annotation is a line chart feature that supports dynamic overlays from a single existing data source for charts with time on the X axis. Select a data source (Dataset, Query, or Dashboard filter from the same dashboard as the chart). Data sources for annotation need to have a time column as well. If the annotating chart has a Valid From timestamp column, it will be used automatically to overlay rows onto the chart. You can select another timestamp column for annotation, select fields for the tooltip, and select the annotation color.
Updated 3 days ago