

View your compute credit usage in the Usage Dashboard
The Usage Dashboard displays your Observe by Snowflake Compute Credit (OCC) usage on your Usage licensed instance. Access it through the Dashboard listing, or by doing the following:
- Hover on your user name in the left navigation rail and select Manage account.
- Click Usage dashboard.
This dashboard is not available in data ingest based license plans. See View your data ingest usage in the License Dashboard instead.
Use the Credit Manager to manage interactive user credit limits, and use the Acceleration Manager to adjust the usage of data transformation and monitoring. You may also want to review the OPAL used in Datasets and Monitors for optimization opportunities: contact your Observe by Snowflake data engineer for assistance.
Summary
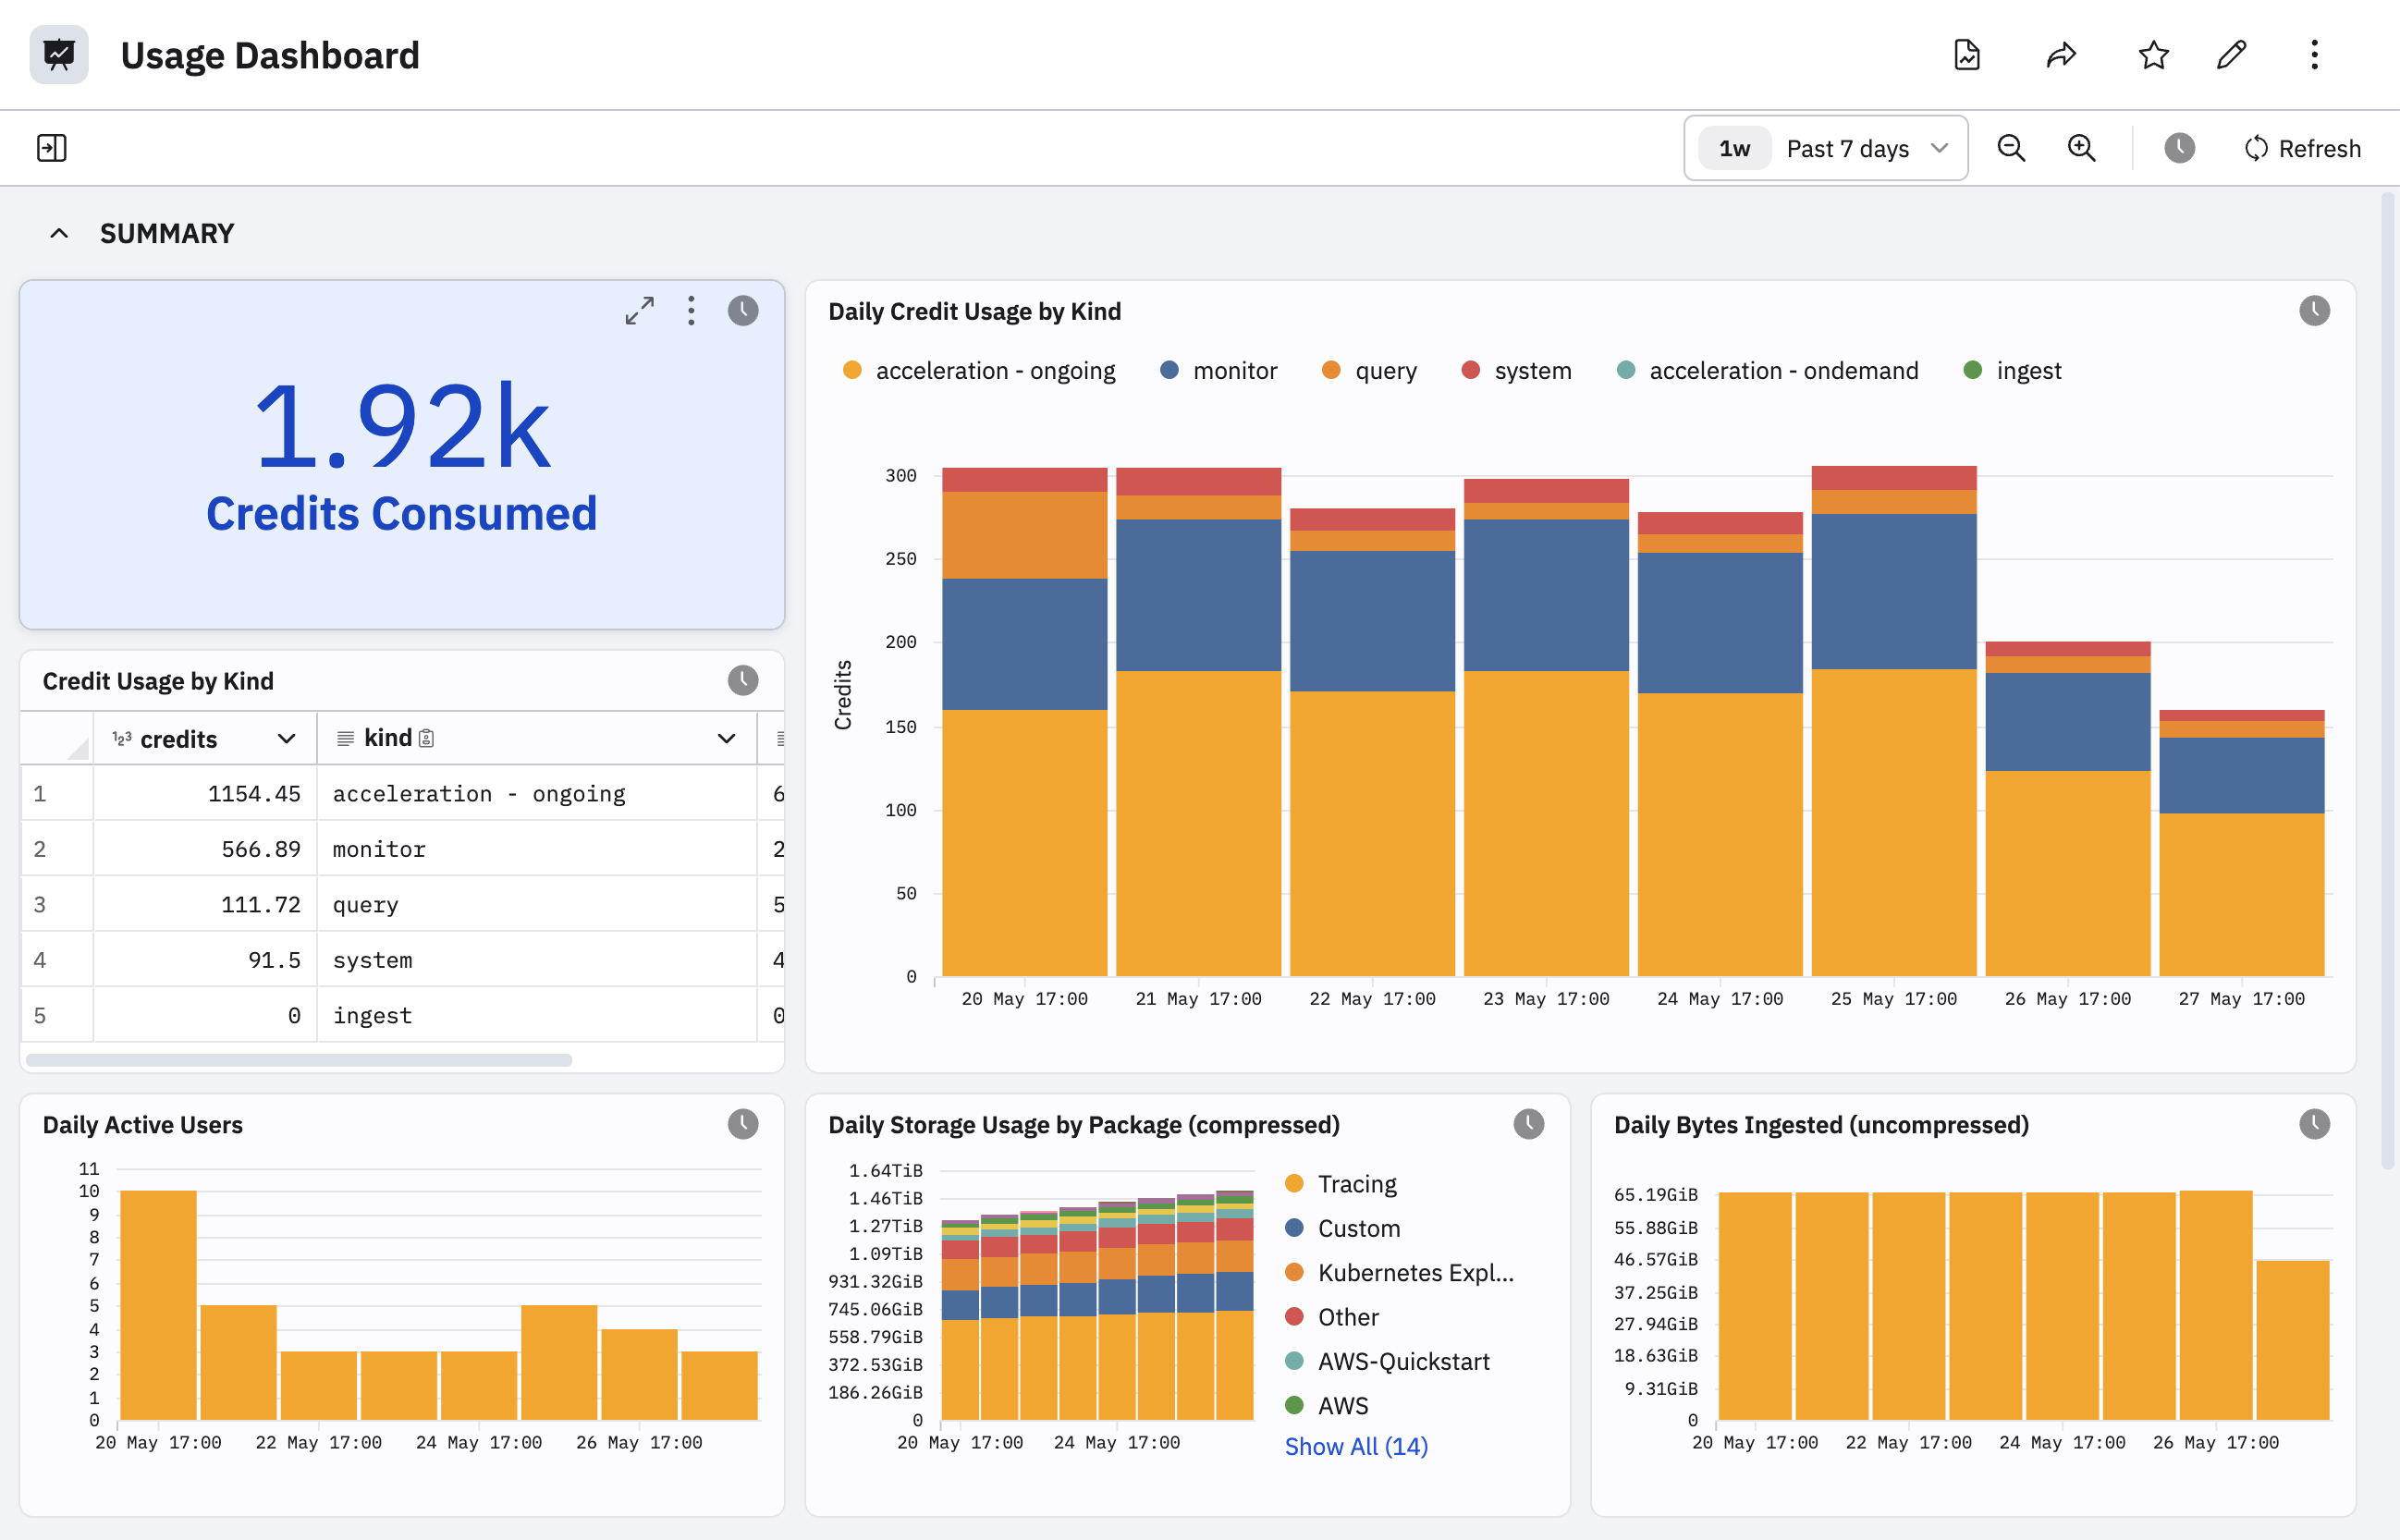
The Summary section contains information about overall credit usage by query and user, along with daily storage and data volume:
| Card | Description |
|---|---|
| Credits Consumed | The overall number of credits used by the instance. |
| Daily Credit Usage by Kind | The number of credits consumed by a query type. |
| Credit Usage by Kind | The total number of credits used by each type of query. |
| Daily Active Users | The total number of users active on a daily basis. |
| Daily Storage Usage by Package (compressed) | Daily storage usage in compressed form, measured in terabytes. |
| Daily Bytes Ingested (uncompressed) | The quantity of uncompressed data consumed daily by Observe by Snowflake. |
Detailed query credit consumption
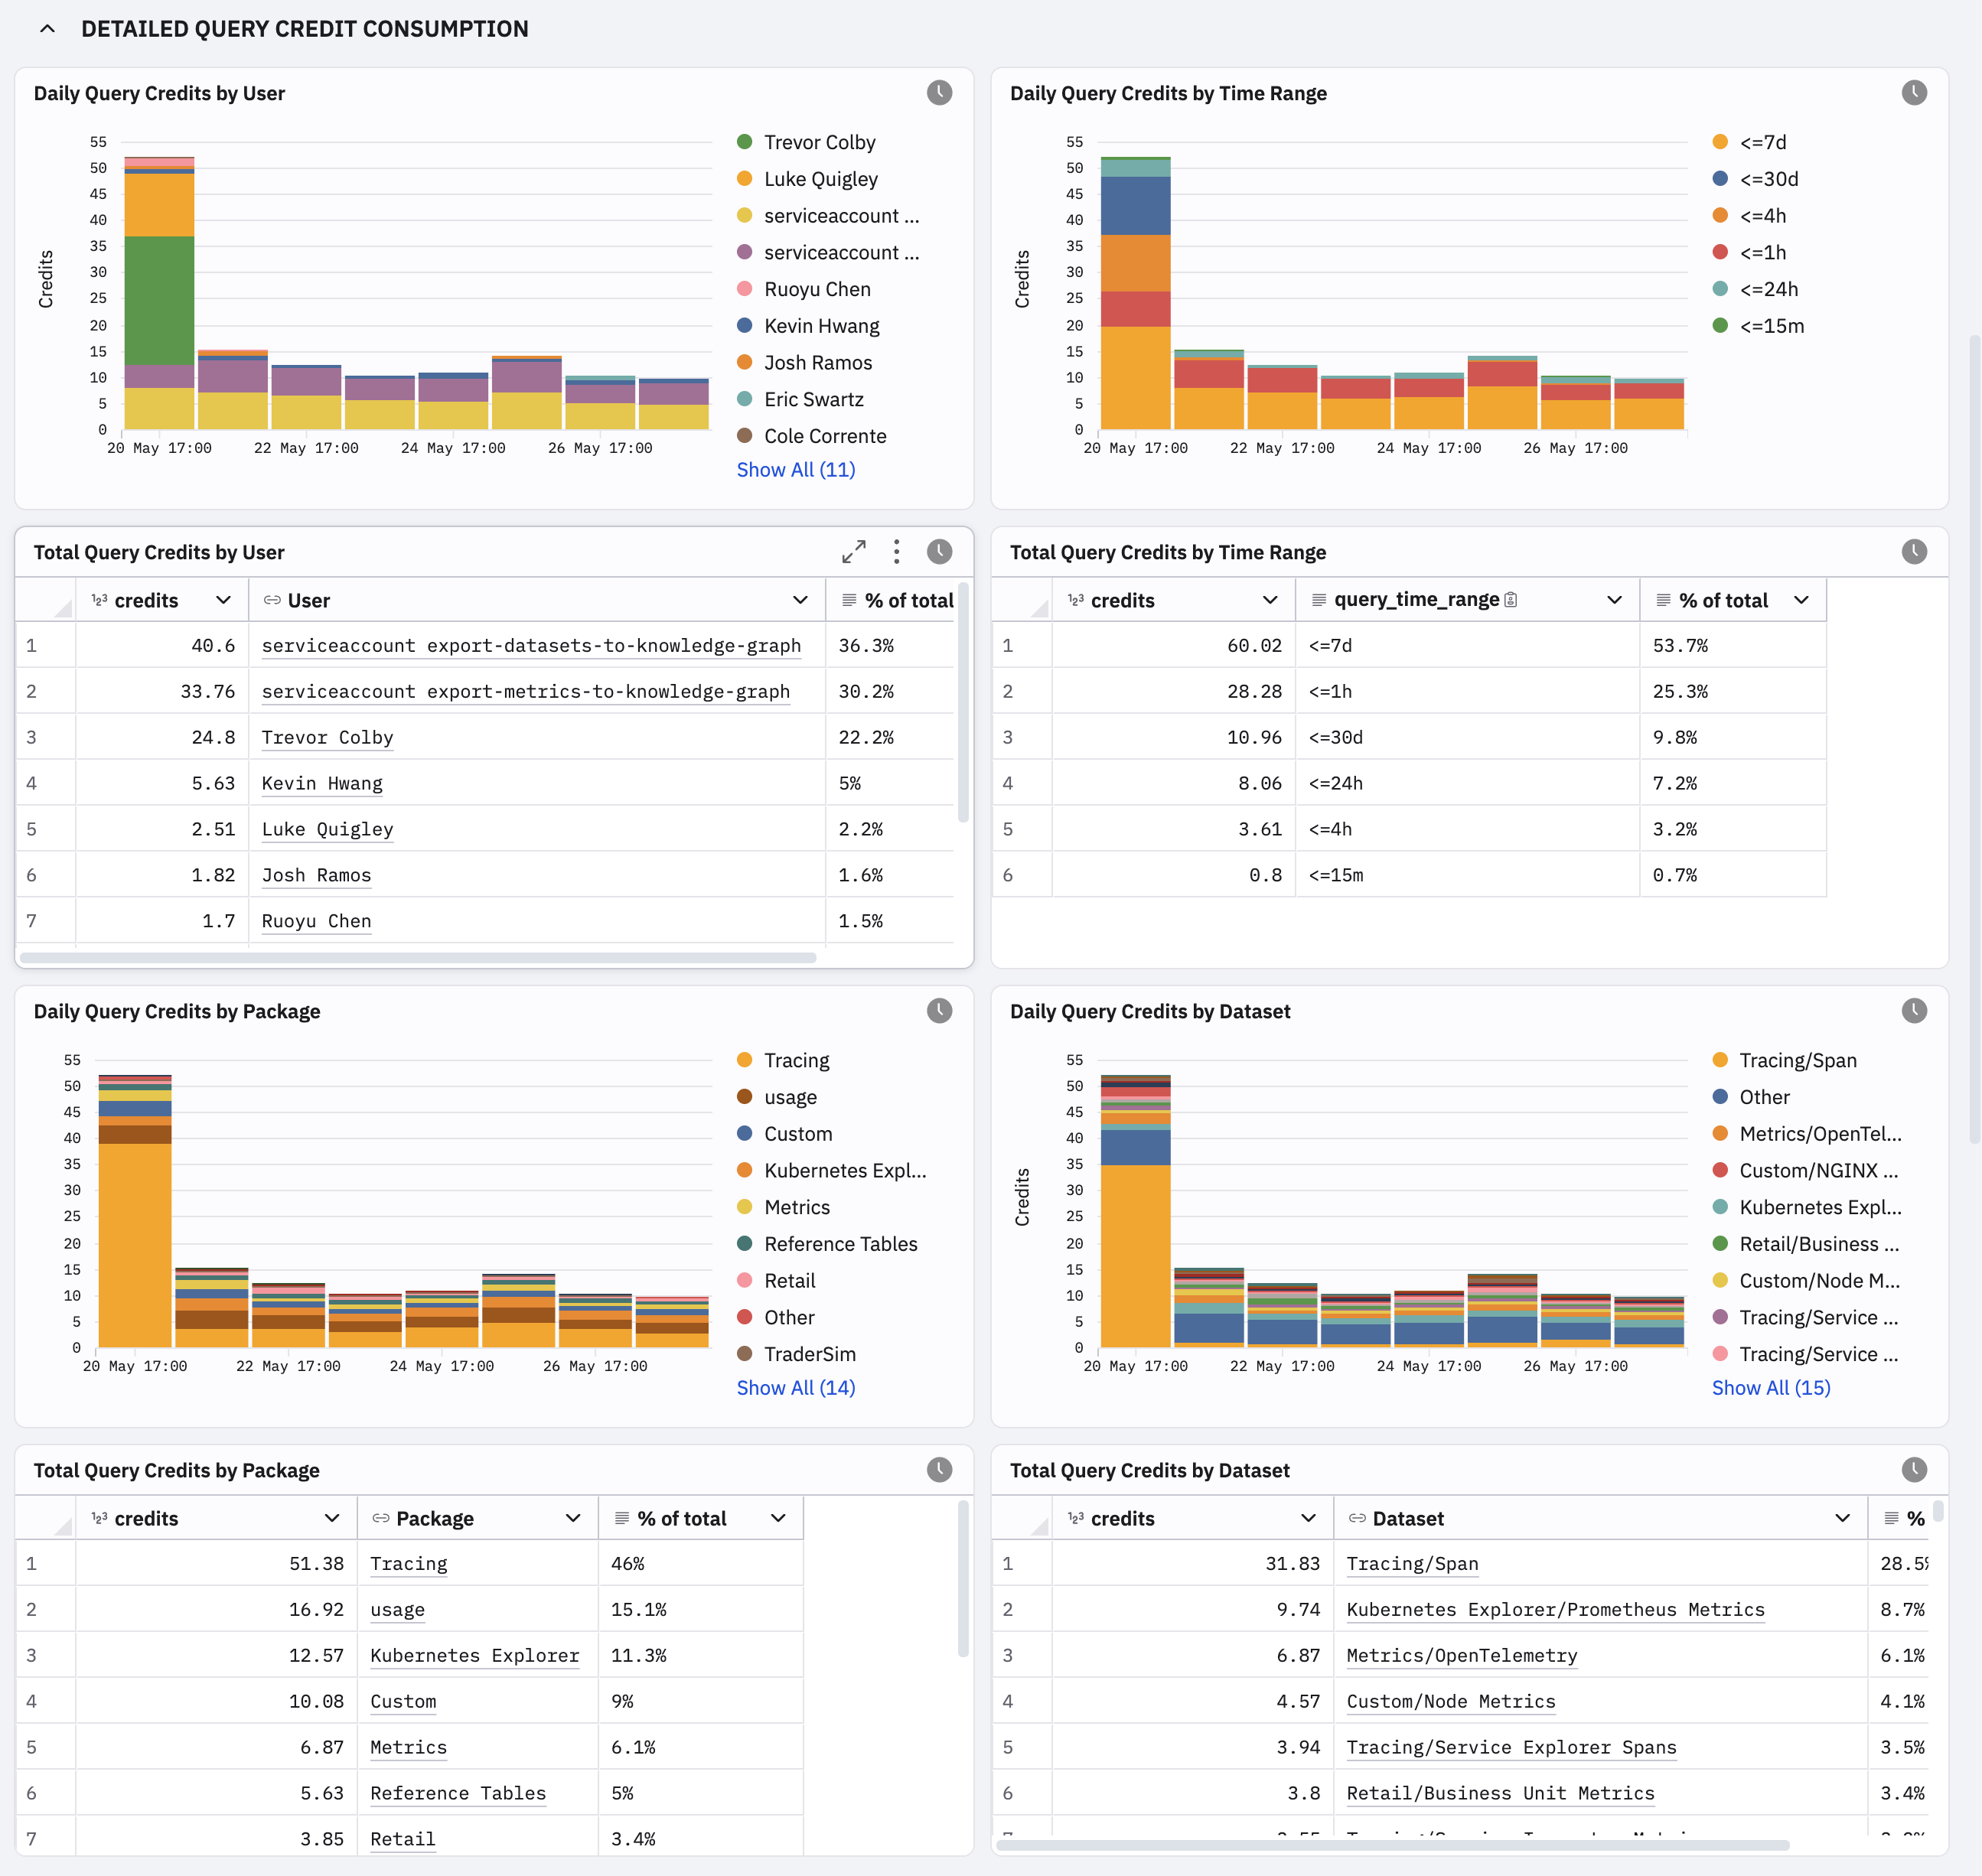
The Detailed Query Credit Consumption section displays details about credits by user, time ranges, and data sets.
| Card | Description |
|---|---|
| Daily Query Credits by User | Top users of query credits per day. |
| Daily Query Credits by Time Range | Peak time periods when queries occurred on your Observe by Snowflake instance. |
| Total Query Credits by User | Top users of query credits. |
| Total Query Credits by Time Range | Total number of query credits used over the past 30 days, 24 hours, or block of hours. |
| Daily Query Credits by Package | Displays information about the packages using query credits daily. |
| Daily Query Credits by Dataset | Displays information about the datasets using query credits daily. |
| Total Query Credits by Package | Total number of query credits consumed by a package. |
| Total Query Credits by Dataset | Total number of query credits consumed by a dataset. |
Detailed acceleration and Monitor credit consumption
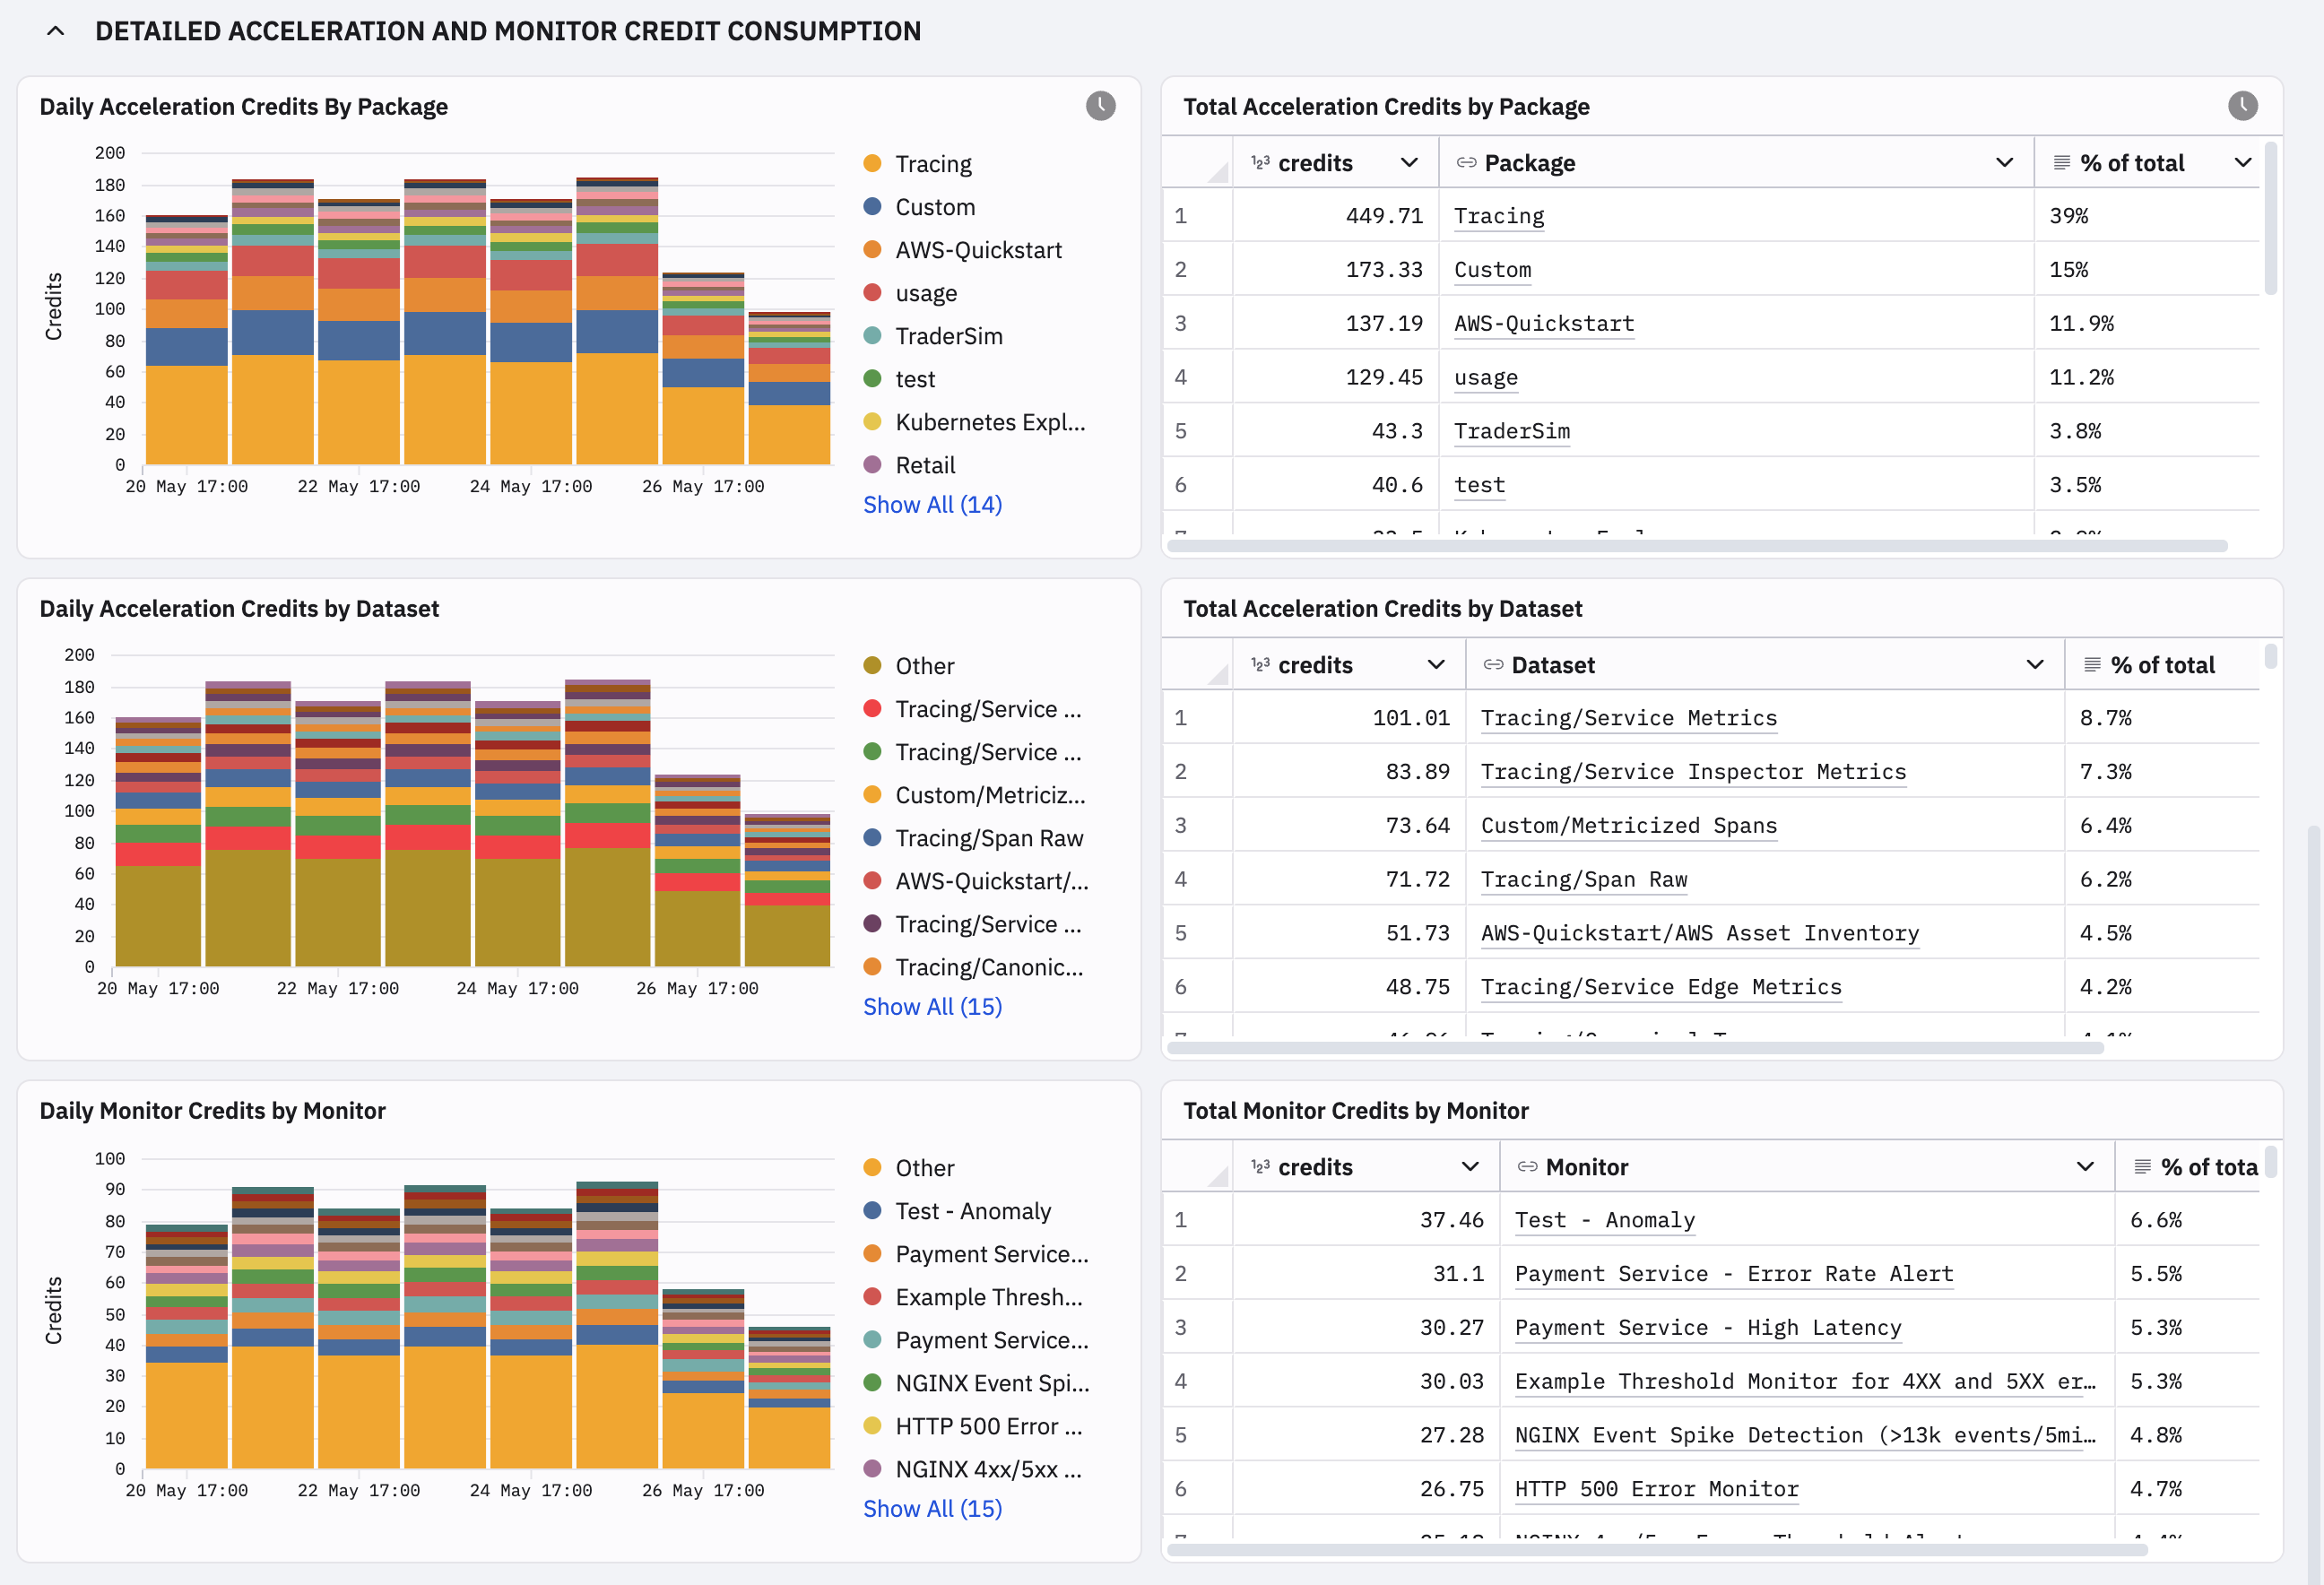
This section displays information about your Acceleration Credit usage. Dataset acceleration consumes credits. When you configure a Monitor, the Monitor also consumes credits.
This section displays information about your Acceleration Credit usage. Dataset acceleration consumes credits. When you configure a monitor, the monitor also consumes credits.
| Card | Description |
|---|---|
| Daily Acceleration Credits By Package | Top packages using acceleration credits daily. |
| Daily Acceleration Credits by Dataset | Top Datasets using acceleration credits daily. |
| Daily Live Mode Credits by Dataset | Number of consumed credits when using Live Mode. |
| Daily Acceleration Credits by Monitor | Top monitors using monitor credits daily. |
| Total Acceleration Credits by Package | Total number of packages using acceleration credits. |
| Total Acceleration Credits by Dataset | Total number of datasets using acceleration credits. |
| Total Live Mode Credits by Dataset | Number of consumed credits when using Live Mode. |
| Total Monitor Credits by Monitor | Total number of monitors using monitor credits. |
More options from the dashboard cards
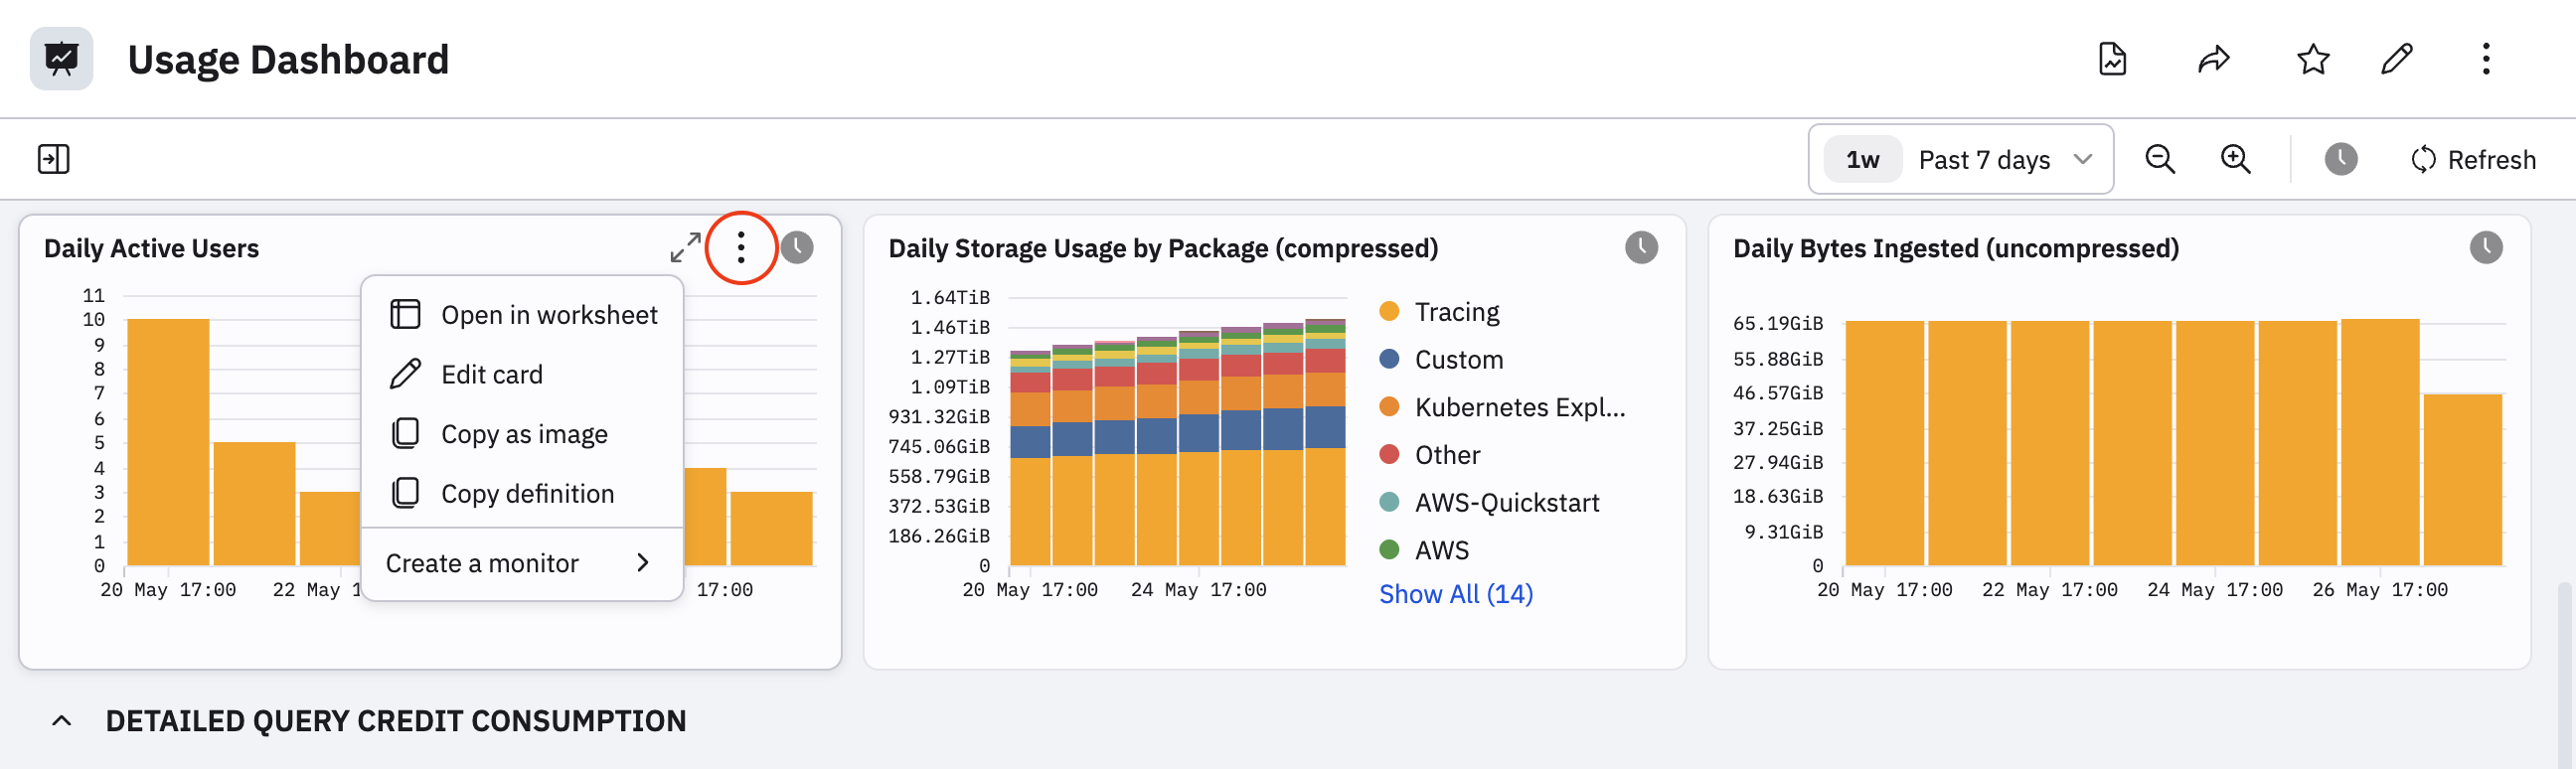
On each card in the Usage Dashboard, you can select the More icon (), and choose one of the following options:
| Option | Description |
|---|---|
| Open in Worksheet | Open the query in a new Worksheet, where you can adjust the query and filter as needed without affecting the underlying Dataset. |
| Edit card | Open the card for editing, where you can change any of the cards settings. See Edit dashboard cards . |
| Copy as image | Copy the dashboard card as an image that you can share. |
| Copy definition | Copy the definition of this card into your cache, so you can paste it in any other dashboard |
| Create a monitor | Create a Monitor. When you click Create a monitor, you can select the Monitor type, or pick Auto and have Observe by Snowflake pick the type for you. |
If there is a Content option, you can view the associated resources for the dashboard card if resources apply to the card. If a dashboard card doesn't have any associated resources, you won't see the Content option.
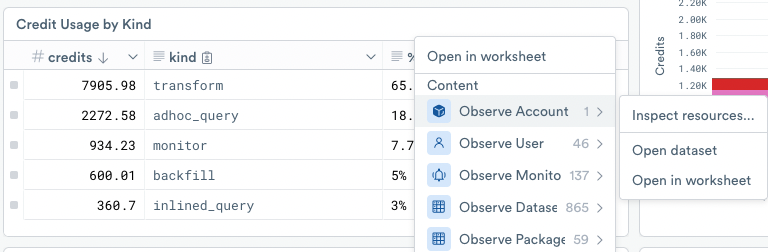
If you choose Content, you can choose any of the following options:
- Inspect resources
- Open dataset
- Open in worksheet
Updated 5 days ago