Negative monitoring
"Is it down?!" is a common question among Observability teams. A strong signal for indicating if a system is down is when the system stops reporting data.
Monitoring for the absence of data is referred to as negative monitoring.
Considerations for negative monitoring
This section describes how you can effectively configure negative monitoring.
- Check heartbeats and crash signals to see if a host is down
- Use stabilization delays to deal with lumpy data
- Use the "No data" alert type to detect missing data
Check heartbeats and crash signals to see if a host is down
The most effective approach to negative monitoring is converting it into a positive monitoring problem - look first for positive signals that a system is down such as system crash detection or heartbeat monitoring.
| Detection | Description |
|---|---|
| System crash detection | Monitor for reliably bad states like Crash Looping in Kubernetes or Kernel Panic in Linux. You can set up a count monitor based on a log string, when count > 0. |
| Heartbeat monitoring | Set up regular heartbeat signals or metric deliveries from agents to quickly indicate system failure. You can use a count style monitor to alert when count is = 0. |
These methods provide a lower latency mechanism for determining host or container crashes and disruptions.
Use stabilization delays to deal with lumpy data
Negative monitors may suffer from false positives due to late arriving data or sparse data sources. To reduce false positives from temporary data delivery issues:
- Minimize transformation chains. Create Monitors on Datasets that are earlier in the processing pipeline.
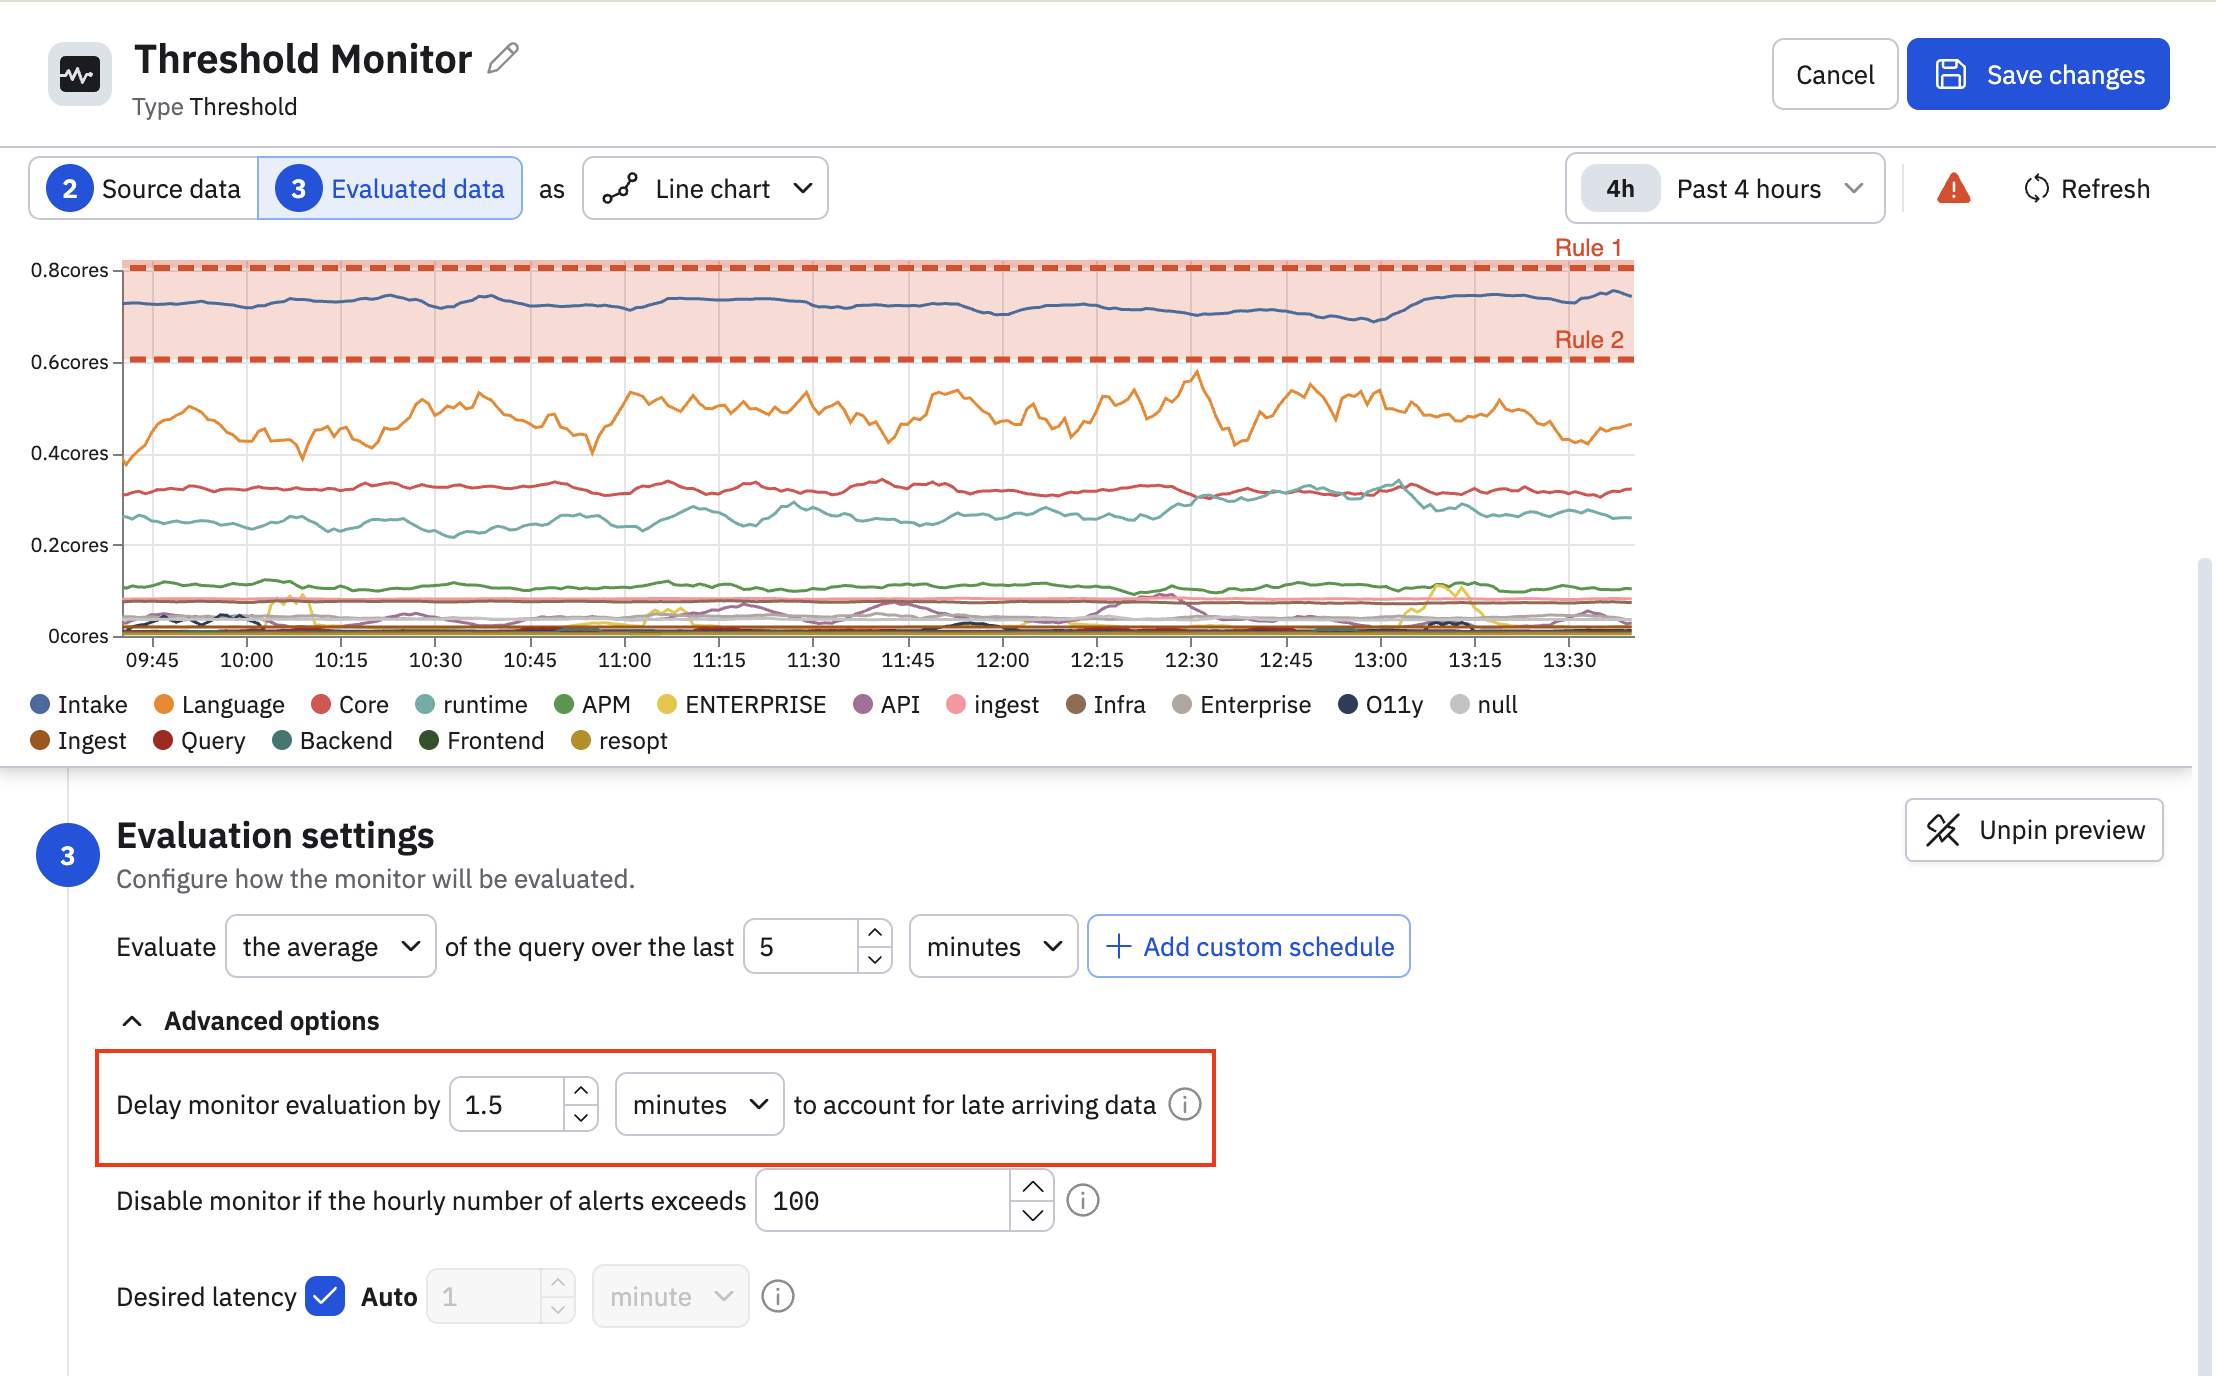
- Use stabilization delays. In the Monitor's evaluation settings, configure an appropriate stabilization delay. See Stabilization delay.
- Set appropriate lookback windows. The lookback period is measured from the stabilization delay. For example, if analysis shows log data typically arrives 60 seconds after creation:
- Set the stabilization delay to 1.5 minutes (90 seconds).
- For a 10-minute lookback, the monitor evaluates data from 1.5-11.5 minutes ago.
This provides adequate time for upstream systems to deliver records and not trigger a false positive.
Use the "No data" alert type to detect missing data
Observe supports a dedicated No data rule and severity level for negative monitoring use cases in threshold and anomlay Monitors. The evaluation period for the No data severity is tied to the evaluation settings for the Monitor query. By changing the evaluation settings for the Monitor query, the trigger condition for No data severity is also updated.
Key features:
- Dedicated alert rule: You can configure No data alerts separate from threshold-based alerts.
- Configurable missing data window: Set the duration for which data must be missing before alerting.
- Integration with existing alert policies: No data alerts work in addition to existing threshold based rules.
No data alert lifecycle
Monitors using the No data rule have a default expiry that is the lookback time of the Monitor + 2 hours. If your Monitor has a lookback window of 10 minutes and a No data alert fires, the maximum time that the alert will be in a triggering state is 2 hours 10 minutes. If data does not arrive for more than 2 hours plus the lookback window, the alert will stop triggering.
Triggering will only occur again after data starts to arrive, as this resets the alert conditions.
No data example - log record count negative monitor
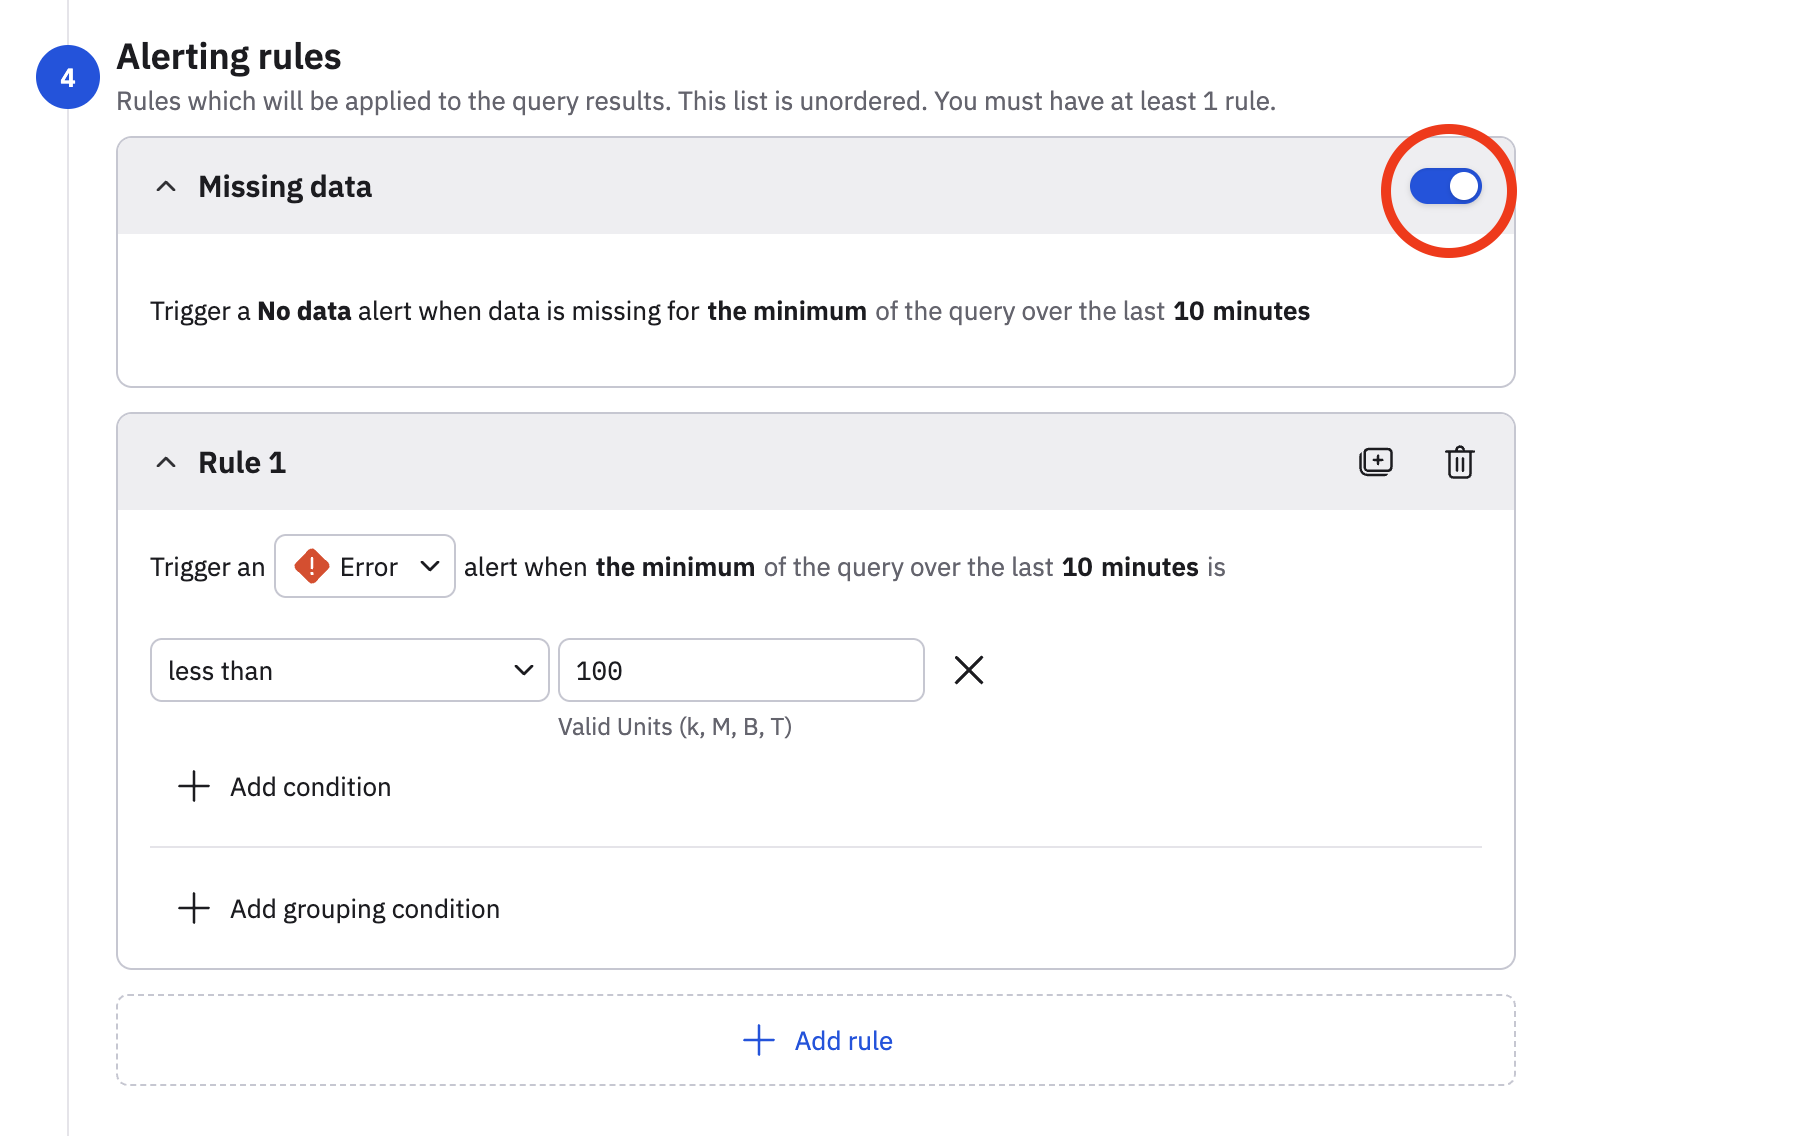
With the No data severity type, you can create negative monitors via a single click. In this example, we want to configure the Monitor to send an alert if usage attribution data is not received within the last 10 minutes.
We edit the monitor, and in the Alerting rules section, slide the Missing data toggle to the on position.
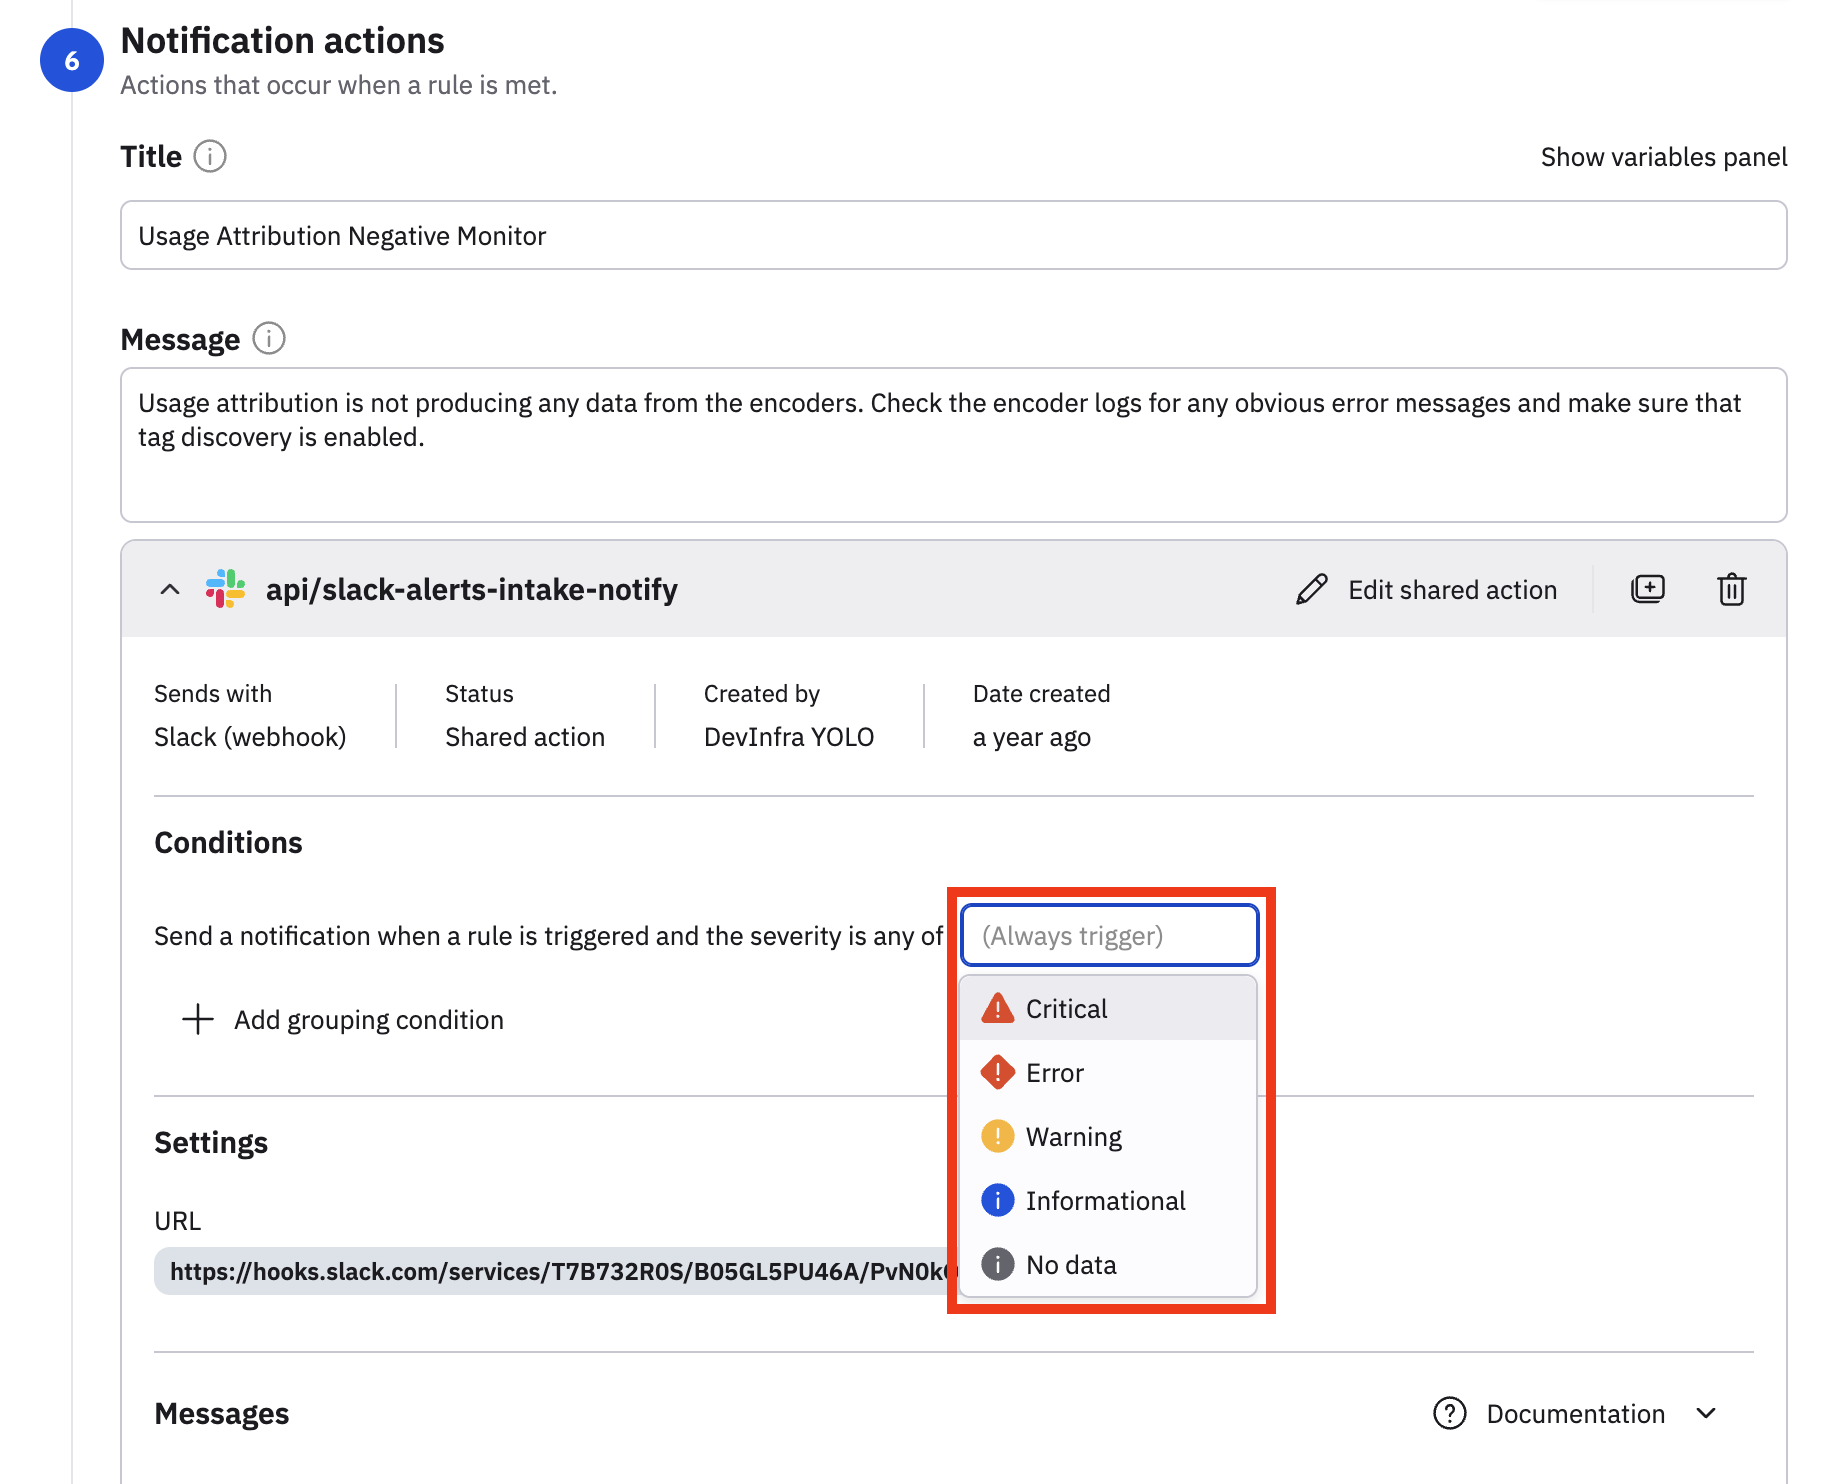
Now, the No data severity can be consumed by any new or existing actions in the Monitor. In the Notification actions, we have an existing Slack action configured, and we can use the No data severity in this existing action, or create a new action using the No data severity.