Deploy the Observe Agent to multiple Kubernetes clusters using Rancher
You can simplify deployment of the Observe Agent across multiple Kubernetes clusters by leveraging Rancher. Follow the steps below to configure Rancher with your fleet.yaml file, add necessary secrets, and manage distribution via Continuous Delivery.
Installation
Prepare fleet.yaml
Create a GitHub repository (or an equivalent VCS) Use this repository to hold your
fleet.yamlfile and any future updates or configurations.Add
fleet.yamlto your repository Commit the following contents into your repo asfleet.yaml. Replace<YOUR_OBSERVE_COLLECTION_ENDPOINT>with your instance’s collection endpoint (ex: https://123456789012.collect.observeinc.com/).
defaultNamespace: observe

helm:
  chart: "agent"                    # chart name
  repo: "https://observeinc.github.io/helm-charts"
  # version: "0.51.1"
  releaseName: observe-agent

  # Enable or confirm "disablePreProcess" is false so Fleet processes templating.
  # (This is usually the default, but some Fleet versions require you to specify.)
  disablePreProcess: false

  values:
    agent:
      selfMonitor:
        enabled: false
    application:
      prometheusScrape:
        # Set it to false if you don't want to use Prometheus Autodiscovery to scrape Prometheus metrics from your pods.
        enabled: true
    cluster:
      events:
        enabled: true
      metrics:
        enabled: true
      # If a cluster does not have the env label, the expansion becomes an empty string—meaning the name might become "-monitored-cluster".
      # If you want a fallback, you can do something like:
      name: "${ index .ClusterLabels \"env\" | default \"unknown\" }-observe-monitored-cluster"
    node:
      enabled: true
      containers:
        logs:
          enabled: true
        metrics:
          enabled: true
      forwarder:
        enabled: true
        traces:
          enabled: true
        metrics:
          enabled: true
          outputFormat: "otel"
        logs:
          enabled: true
    observe:
      collectionEndpoint:
        value: "<YOUR_OBSERVE_COLLECTION_ENDPOINT>"
      token:
        create: false
      traceToken:
        create: false
Configure Rancher
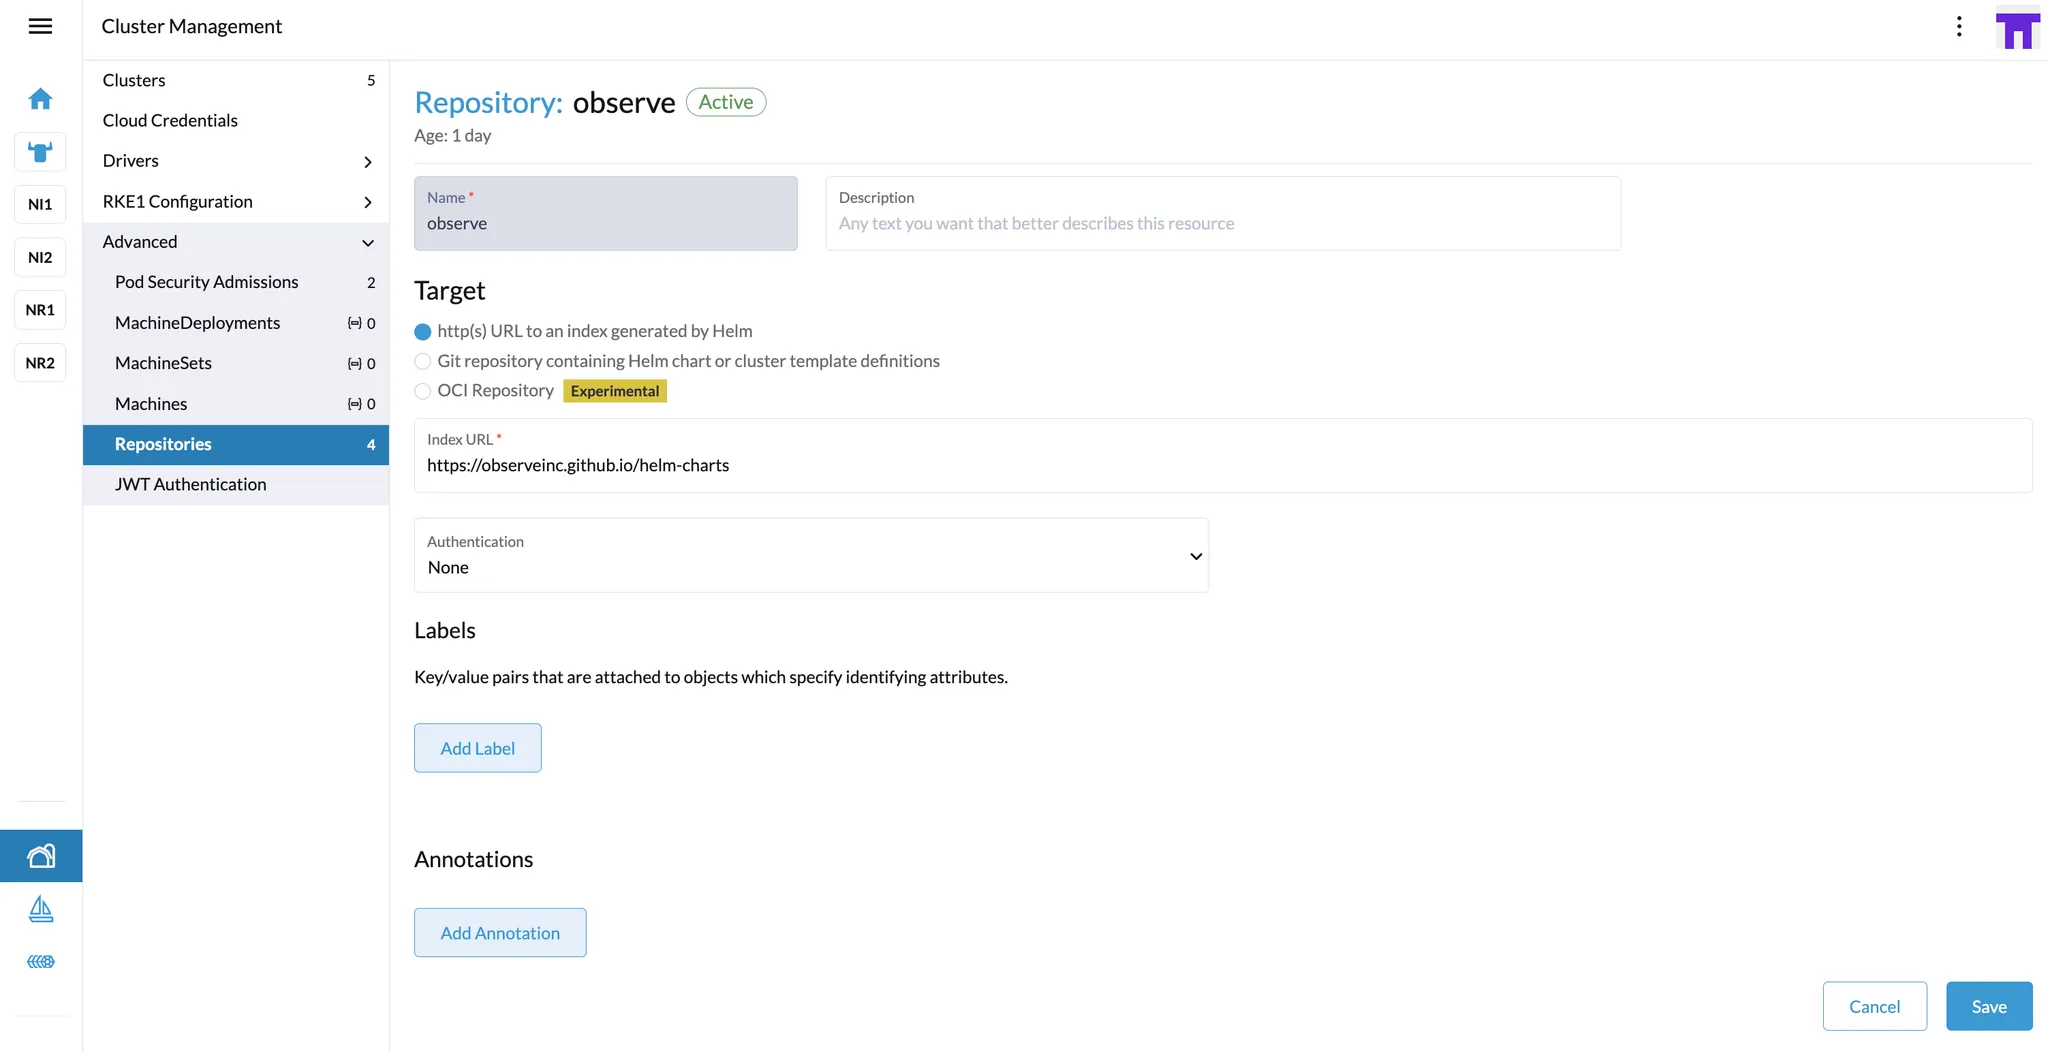
Add the Observe Helm Repository
In Rancher, go to Cluster Management → Repositories.
Create a new repository with the following details:
URL:
https://observeinc.github.io/helm-charts
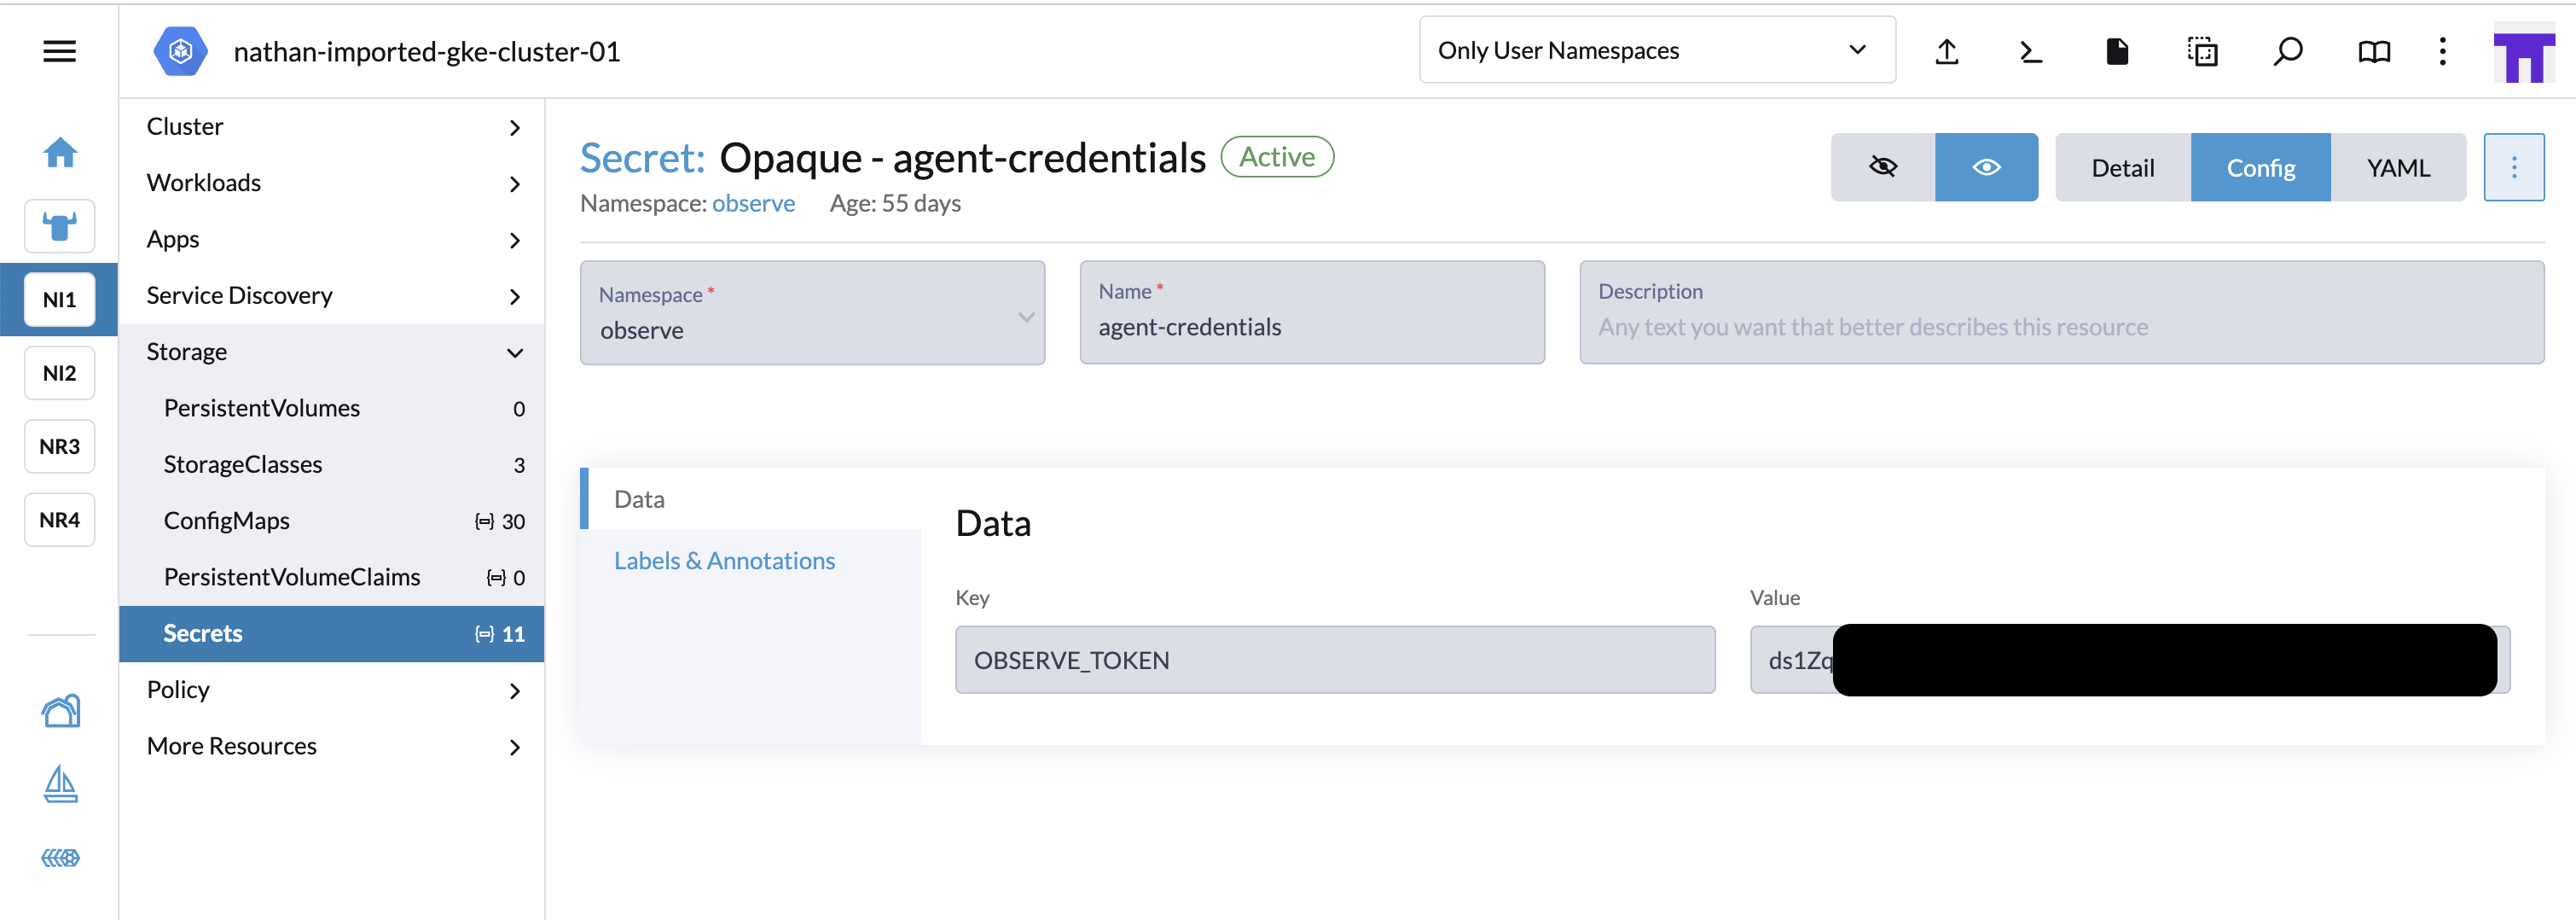
Create a Secret for Each Kubernetes Cluster
Select a cluster in Rancher, then navigate to Secrets.
Add a new secret with the following settings:
Type:
OpaqueName: For example,
agent-credentials.Namespace:
observe(or another namespace, but presumablyobserveif you’re deploying the Observe Agent there).Key-Value Pairs:
Key:
OBSERVE_TOKEN, Value:ds1gF7ZGV52S...(Ingest token you create from the Add Data for Kubernetes page)
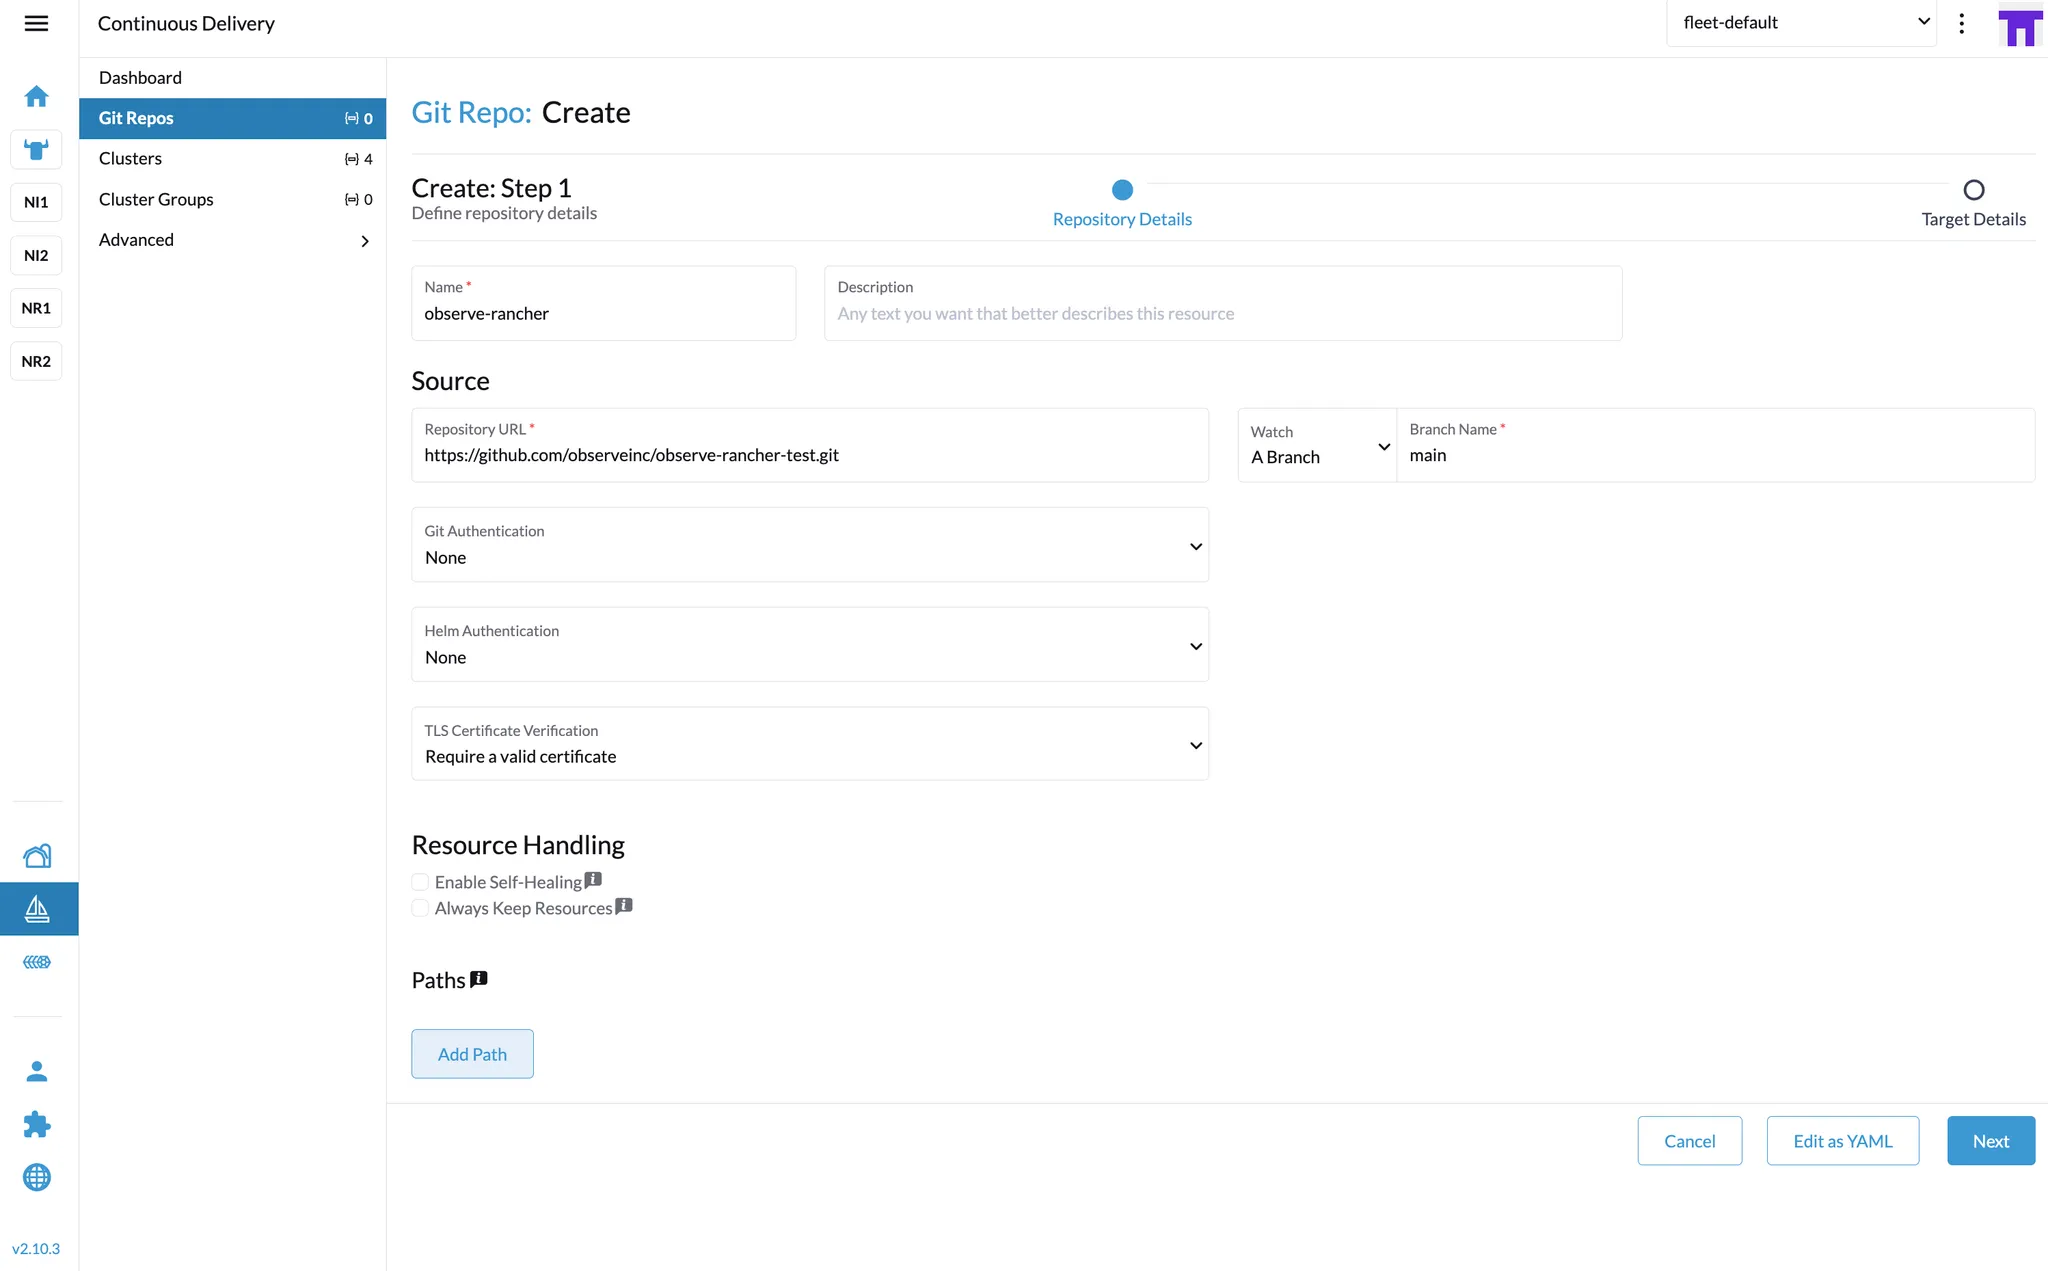
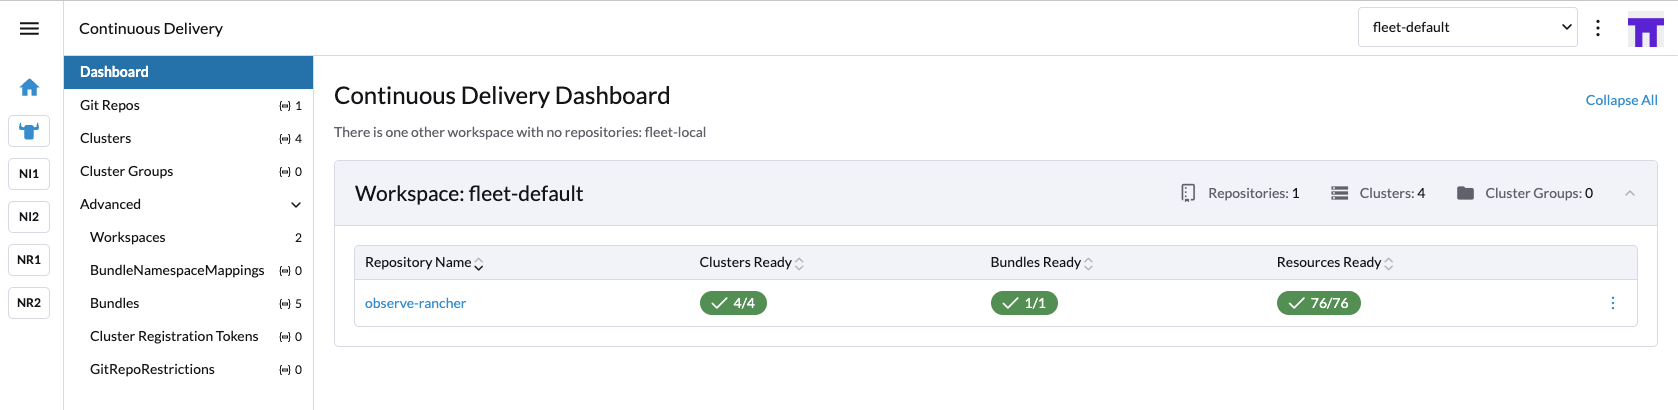
Add Your GitHub Repository in “Continuous Delivery”
Go to Continuous Delivery → Git Repos in Rancher.
Add a new Git repository:
URL: the link to the repository containing your fleet.yaml. (e.g.,
https://github.com/observeinc/observe-rancher-test.git)
Choose target clusters to deploy the Observe Agent.
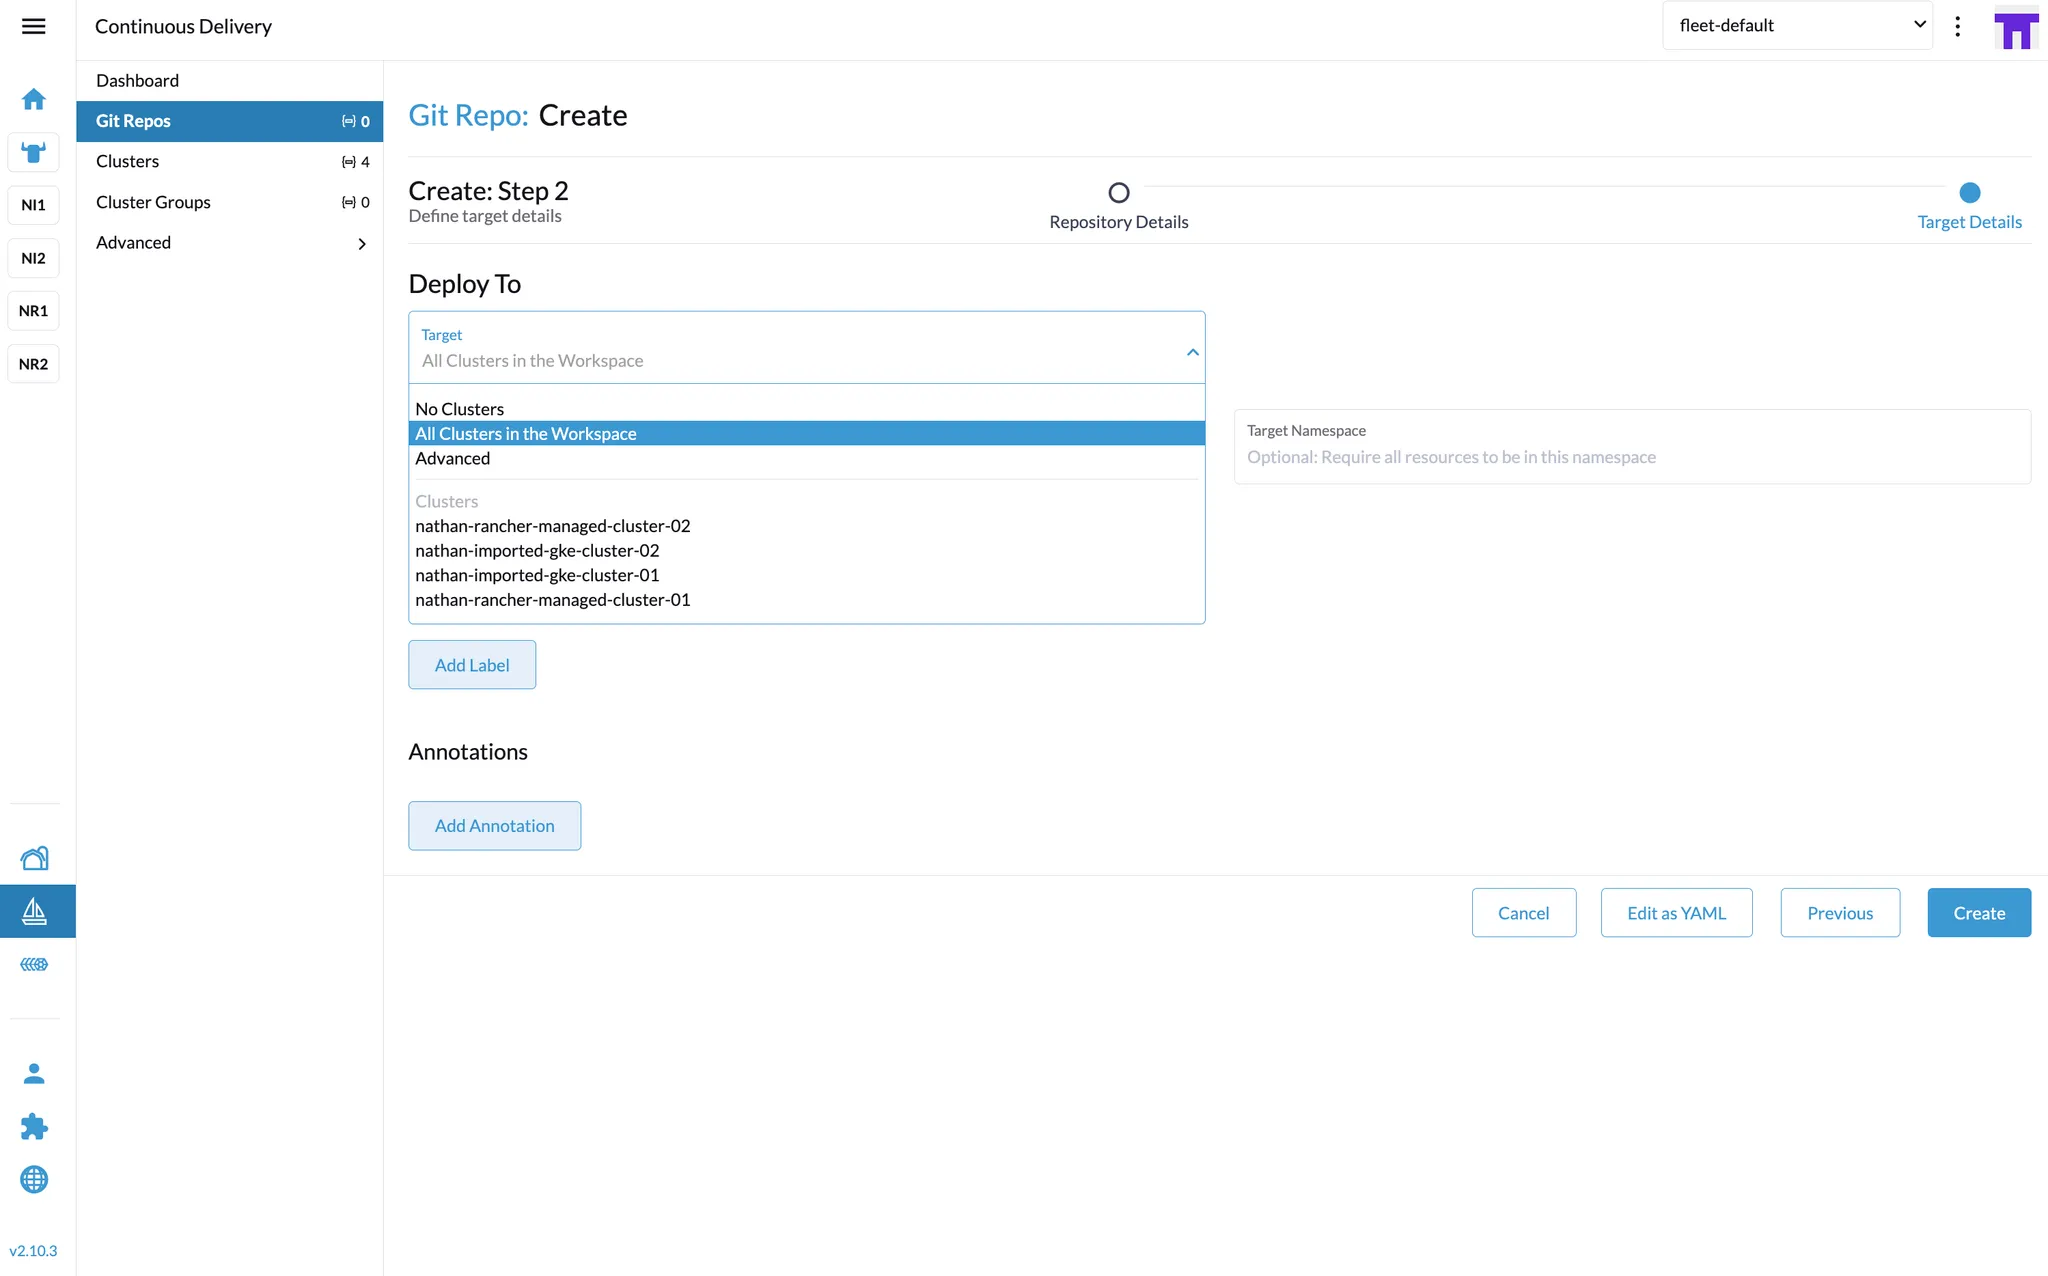
Wait for Rancher to synchronize and deploy the Observe Agent to each selected cluster.
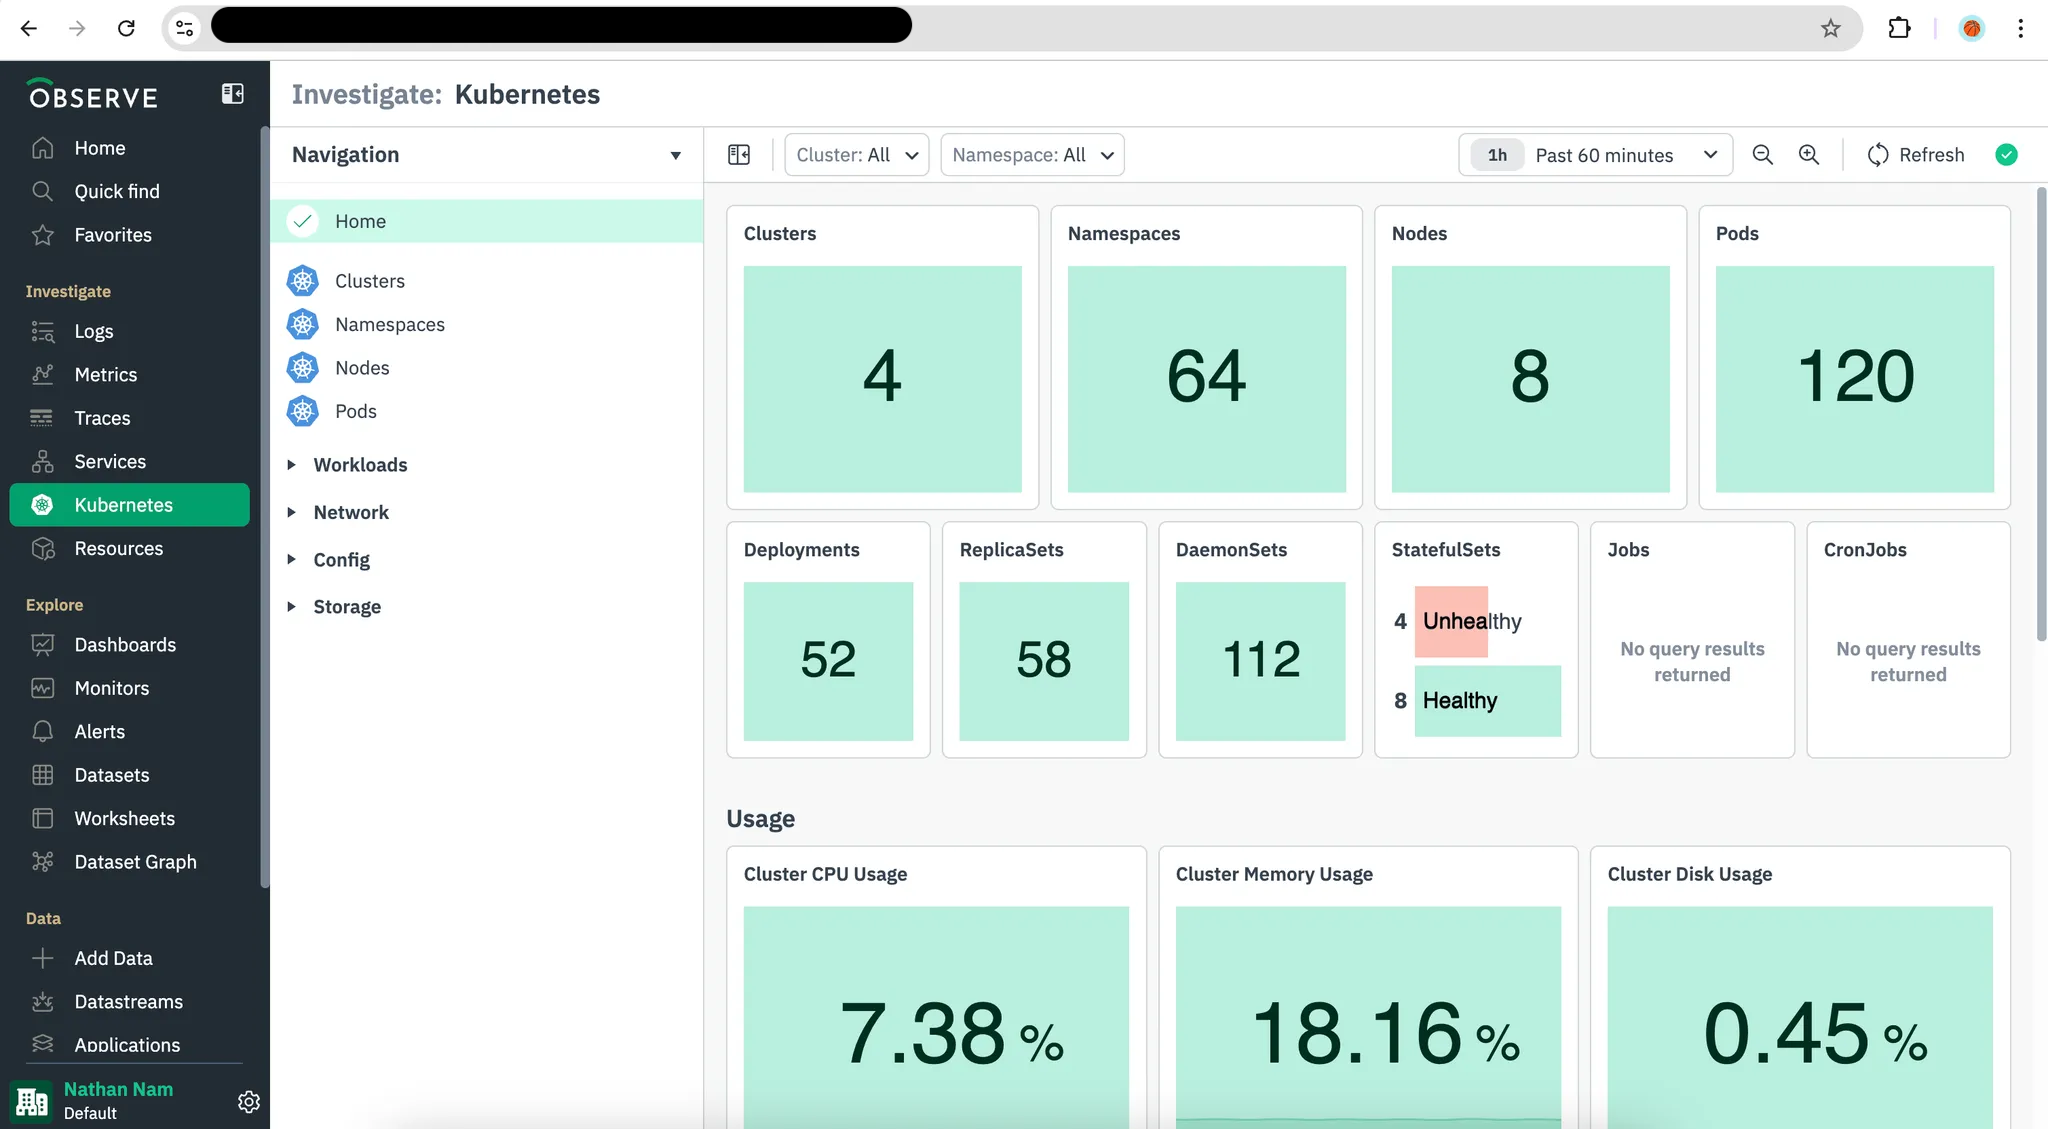
Verify Deployment Once the process completes, check Kubernetes Explorer in your Observe account (or your chosen monitoring view) to confirm the Observe Agent is reporting data as expected.
Configure application instrumentation
Once the Observe Agent is deployed, configure your application instrumentation or set the OTEL_EXPORTER_OTLP_ENDPOINT environment variable to one of the following addresses to send application telemetry including traces to the Observe Agent.
Note
When setting up the endpoint to send traces, make sure you use the path that your OTLP library requires. Some libraries need traces to go to /v1/traces, while others expect them at the root path /.
OTLP/HTTP endpoint:
http://observe-agent-forwarder.observe.svc.cluster.local:4318OTLP/grpc endpoint:
http://observe-agent-forwarder.observe.svc.cluster.local:4317
For example, if you are using the OpenTelemetry Astronomy Shop Demo app, create the app.yaml.
default:
  envOverrides:
  - name: OTEL_EXPORTER_OTLP_ENDPOINT
    value: 'http://observe-agent-forwarder.observe.svc.cluster.local:4318'
Upgrade the helm chart for the OpenTelemetry Astronomy Shop Demo app.
helm upgrade --reuse-values -f app.yaml my-otel-demo open-telemetry/opentelemetry-demo
Learn more about how to instrument your app
Next steps
Use the Kubernetes Explorer to monitor your Kubernetes clusters. To analyze your trace data, explore both the Trace Explorer and the Service Explorer