Add metrics using the Metrics Expression Builder
The Metrics Expression Builder allows you to build metrics expressions in Observe. For instance, you might want to visualize CPU usage for an application. You can add metrics to any new or existing Worksheet or dashboard.
Access the Expression Builder
You can access the Expression Builder using one of the following methods:
- Open a Metrics Dataset and add an expression
- Add a metric to a Worksheet
- Access Expression Builder from a dashboard card
Open a Metrics Dataset and add an expression
Perform the following steps to open a Metrics Dataset and add an expression:
- In Observe, click Metrics in the left navigation rail.
- Select a metric from the list of metrics, such as cpu_utilization (Server/Telegraf CPU Metrics).
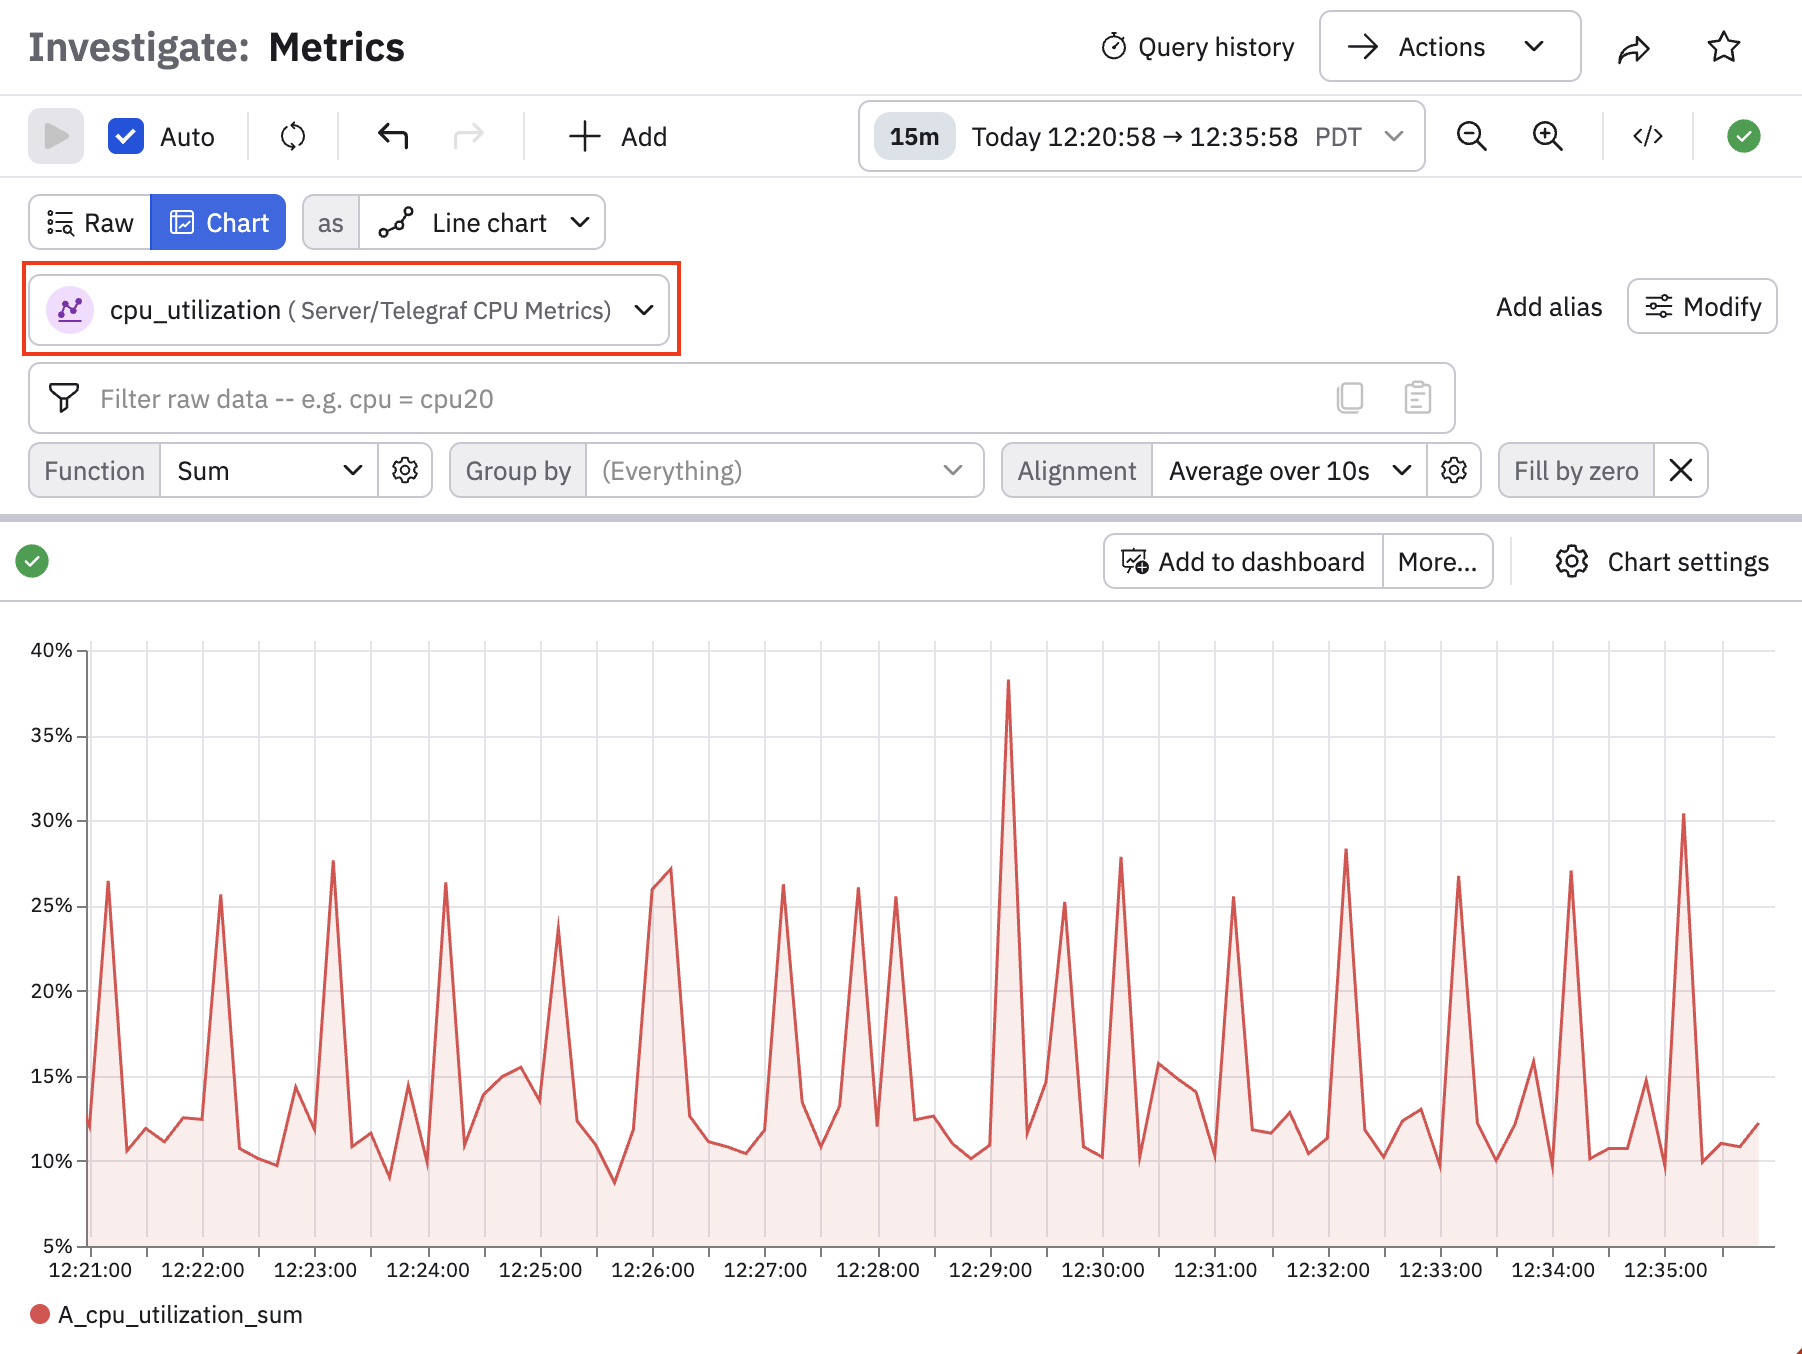
-
Configure the query bar to view specific details about your data. The default Function is Sum, you can click in this drop-down to select another function. See OPAL functions and verbs to get more information about the functions.
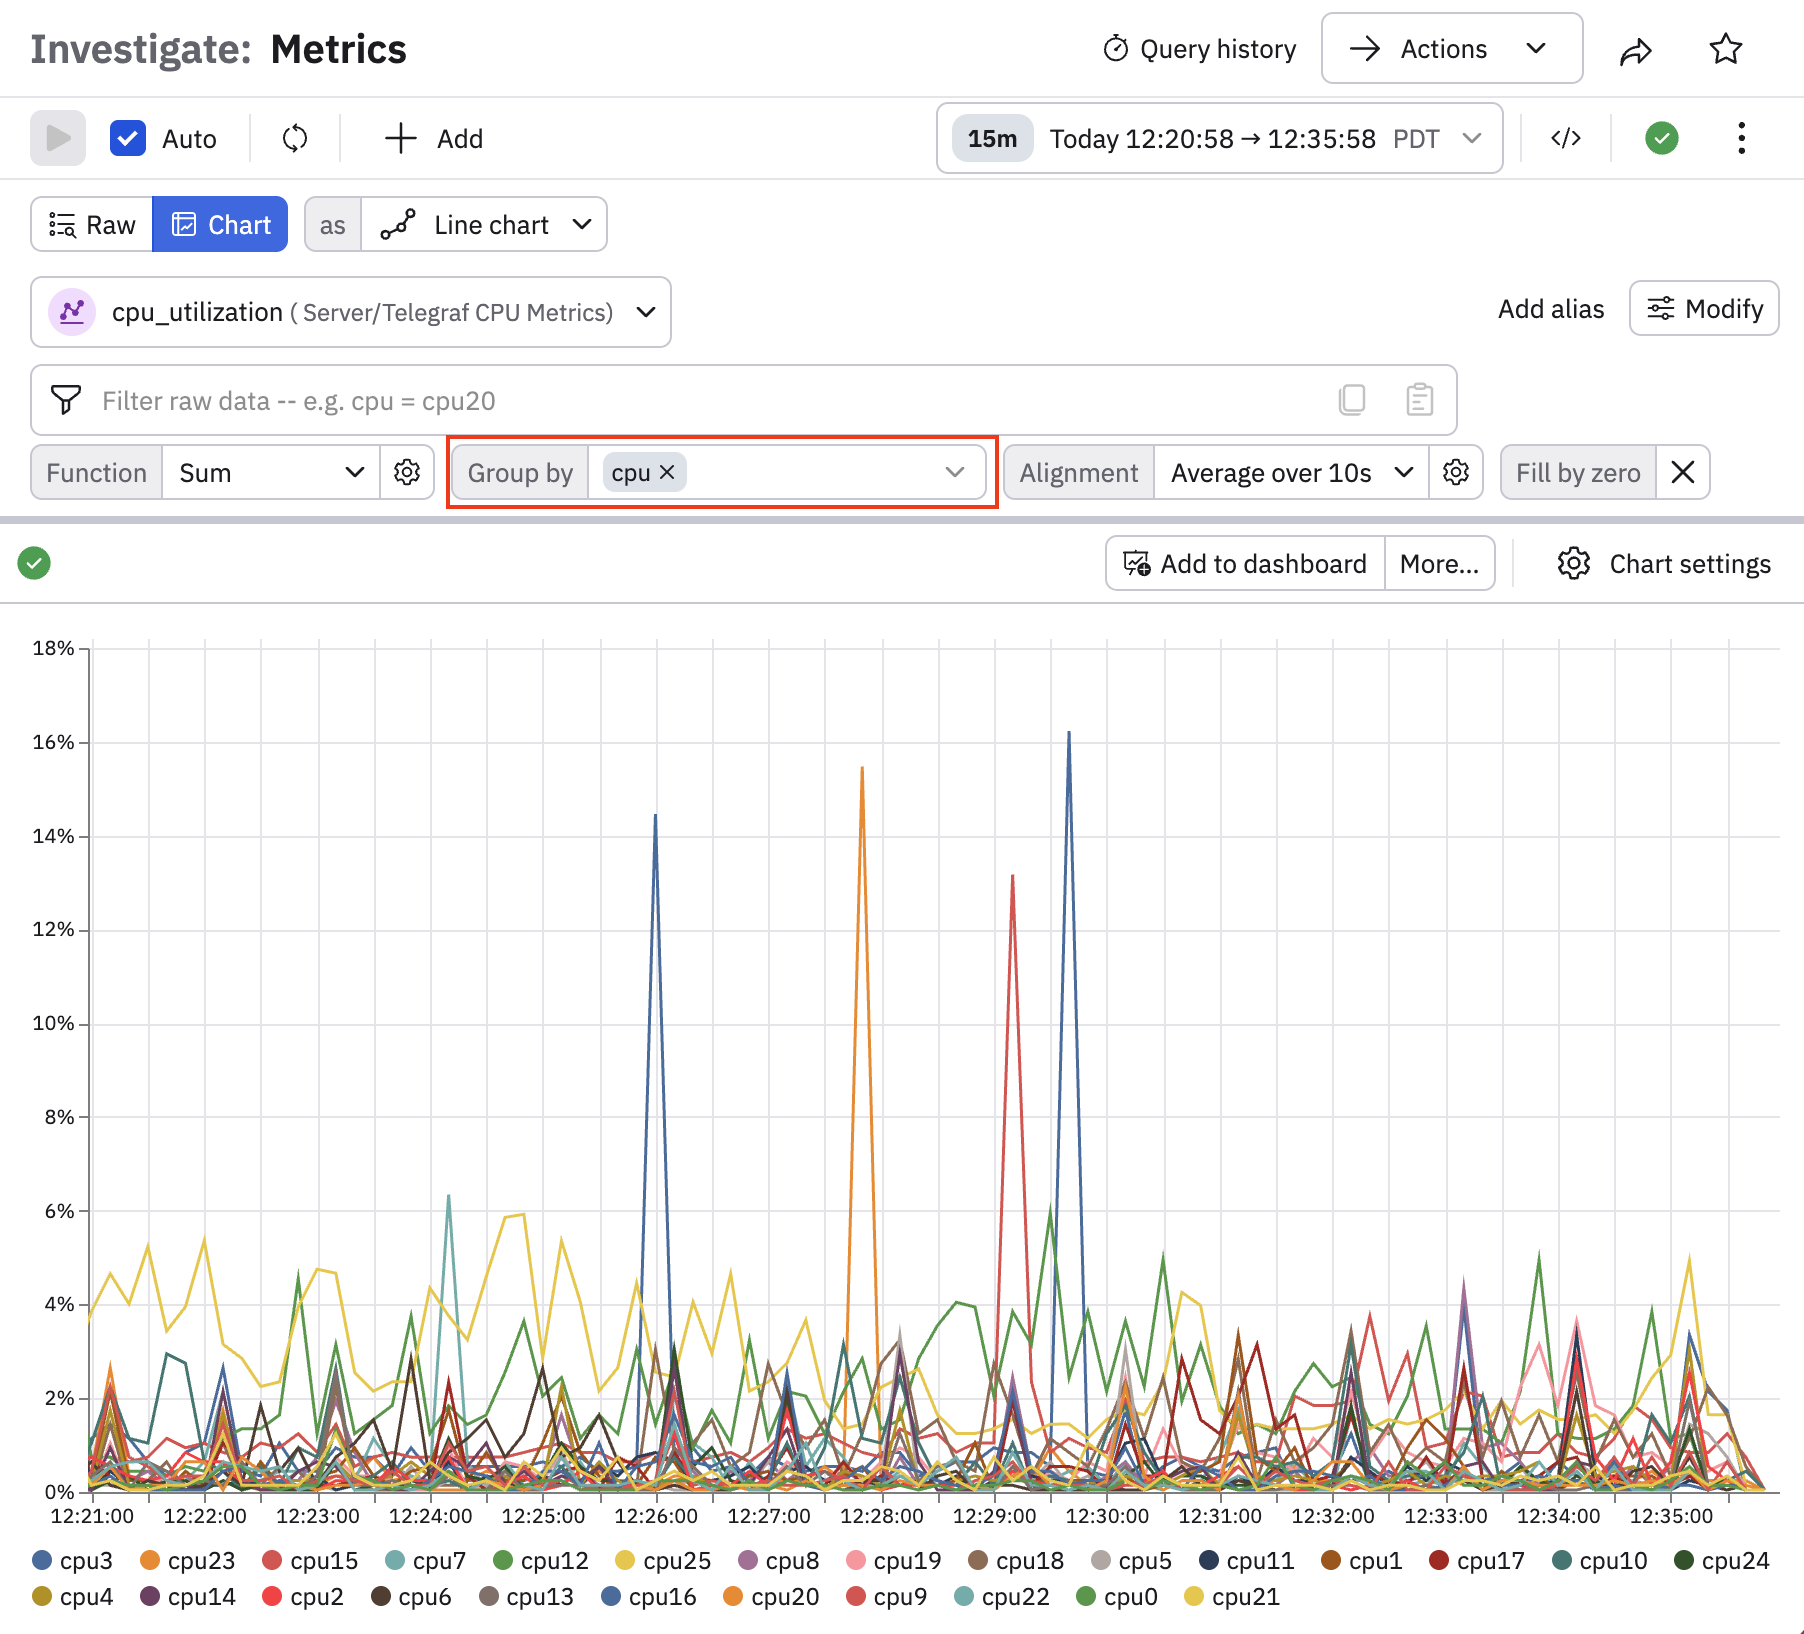
In the Group by drop-down list, we can select a field such as cpu to show the CPU utilization per CPU, instead of the total for all CPUs.
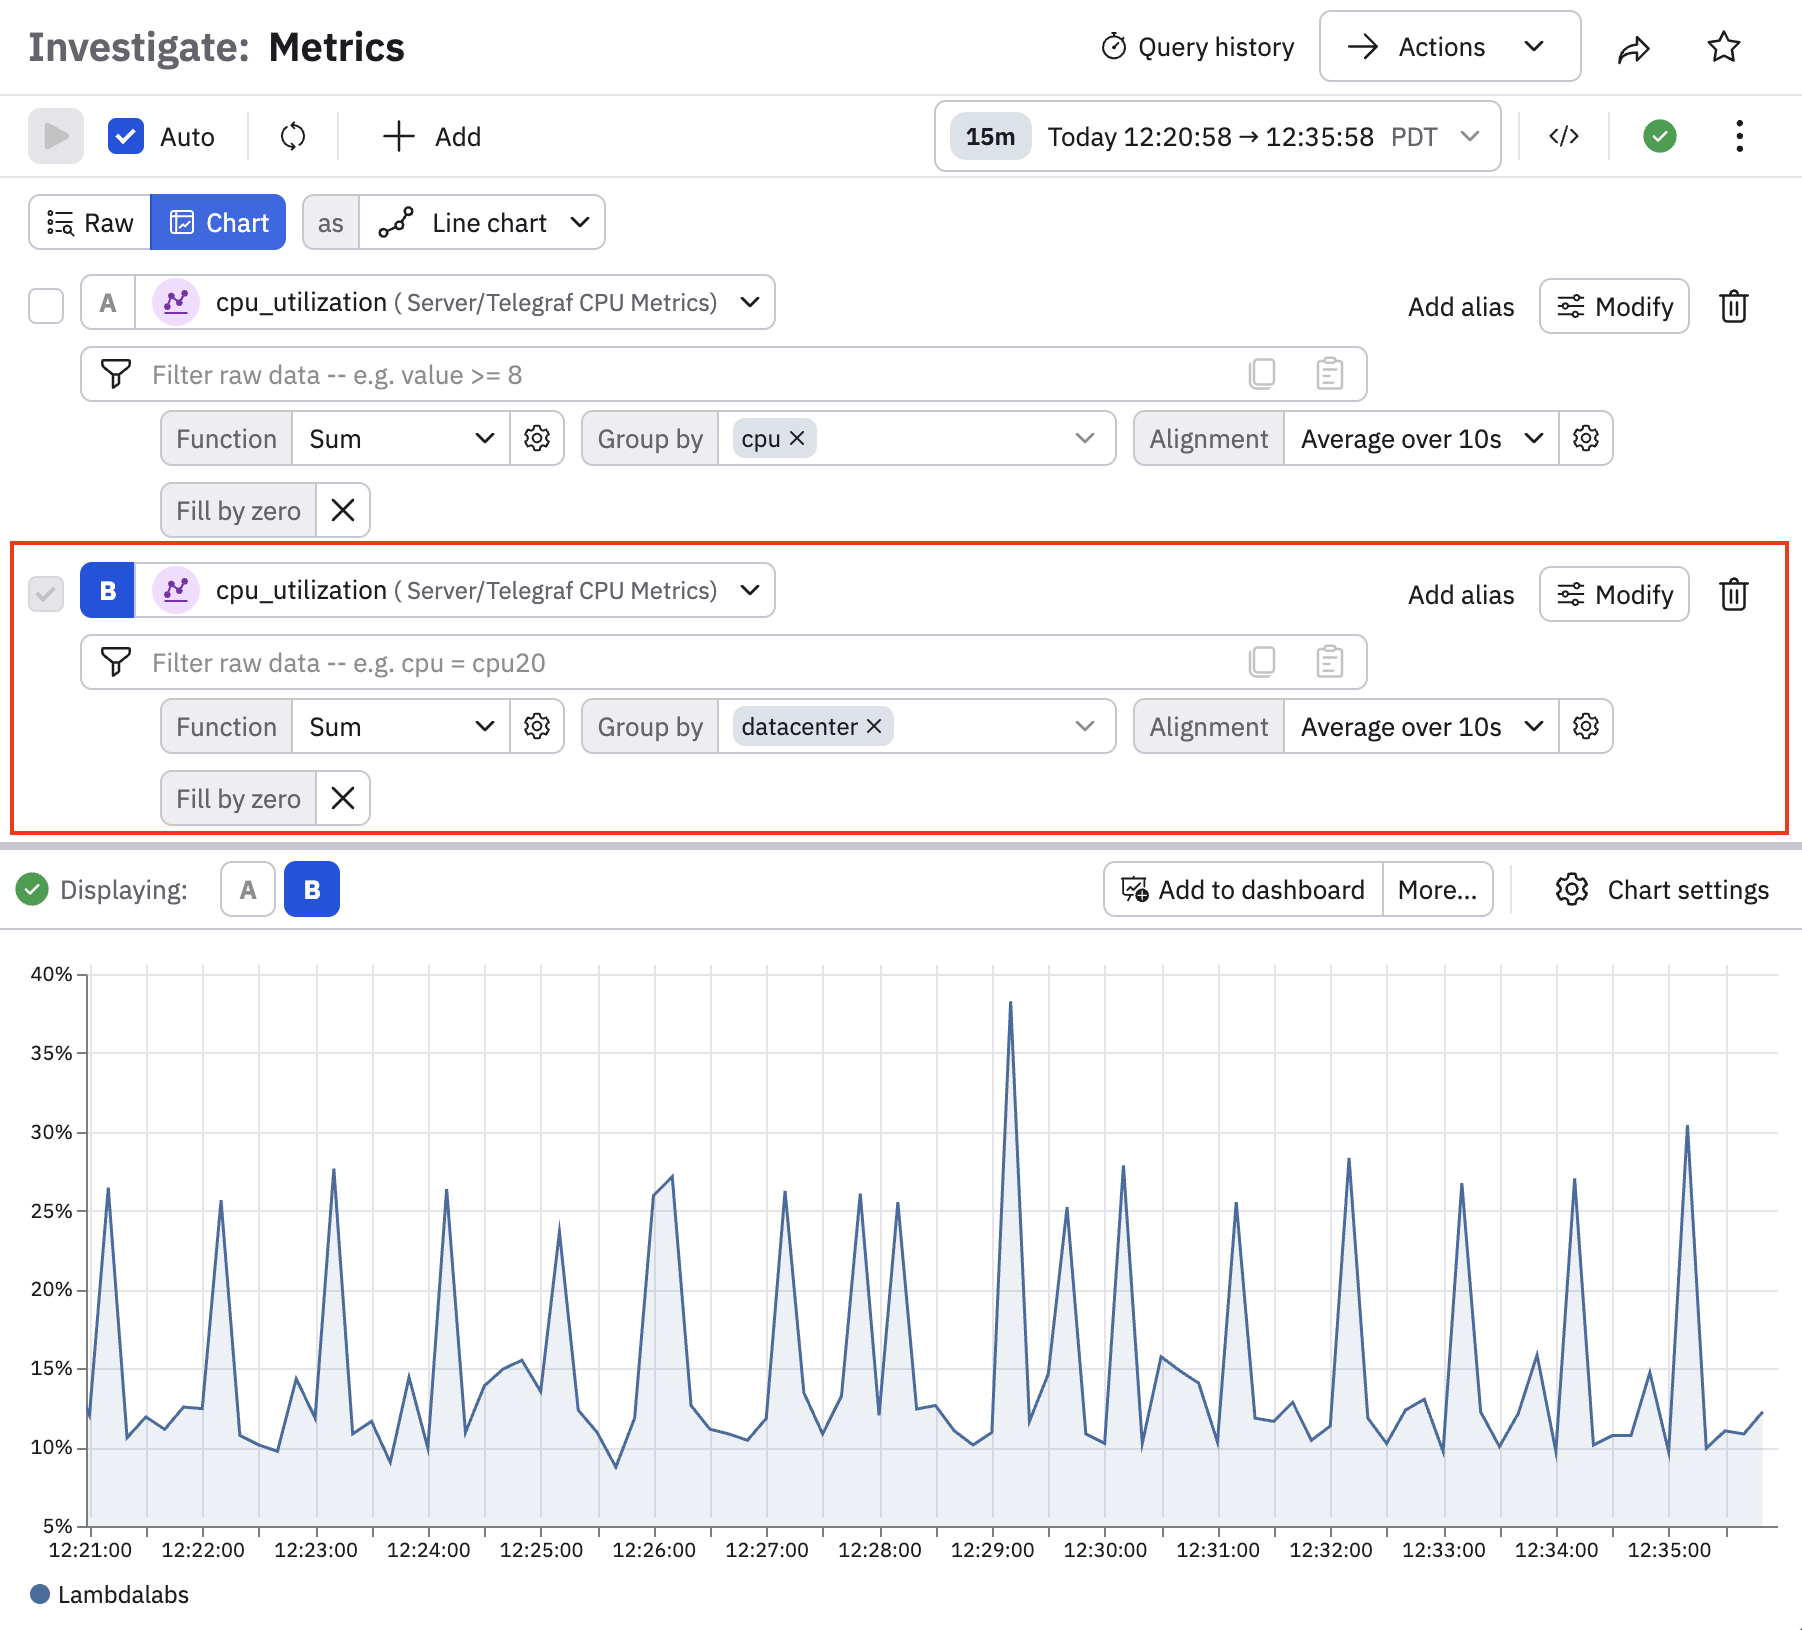
- You can configure multiple queries on the same page. Click +Add, then select +Query, or on wider screens, you can just click +Query directly.
- Configure a second query just like you did for the first query. For example, this time we group by datacenter, instead of by cpu. There is only one graph for this, as there is only one datacenter:
For either query, you can change the visualization options:
- Click Raw to view the raw data in a table
- Click Chart and then pick a visualization type to get a visual representation of your data.
Add a metric to a Worksheet
To add a metric to a Worksheet, use the following steps:
- Open an existing worksheet or create a new one from an Event Dataset.
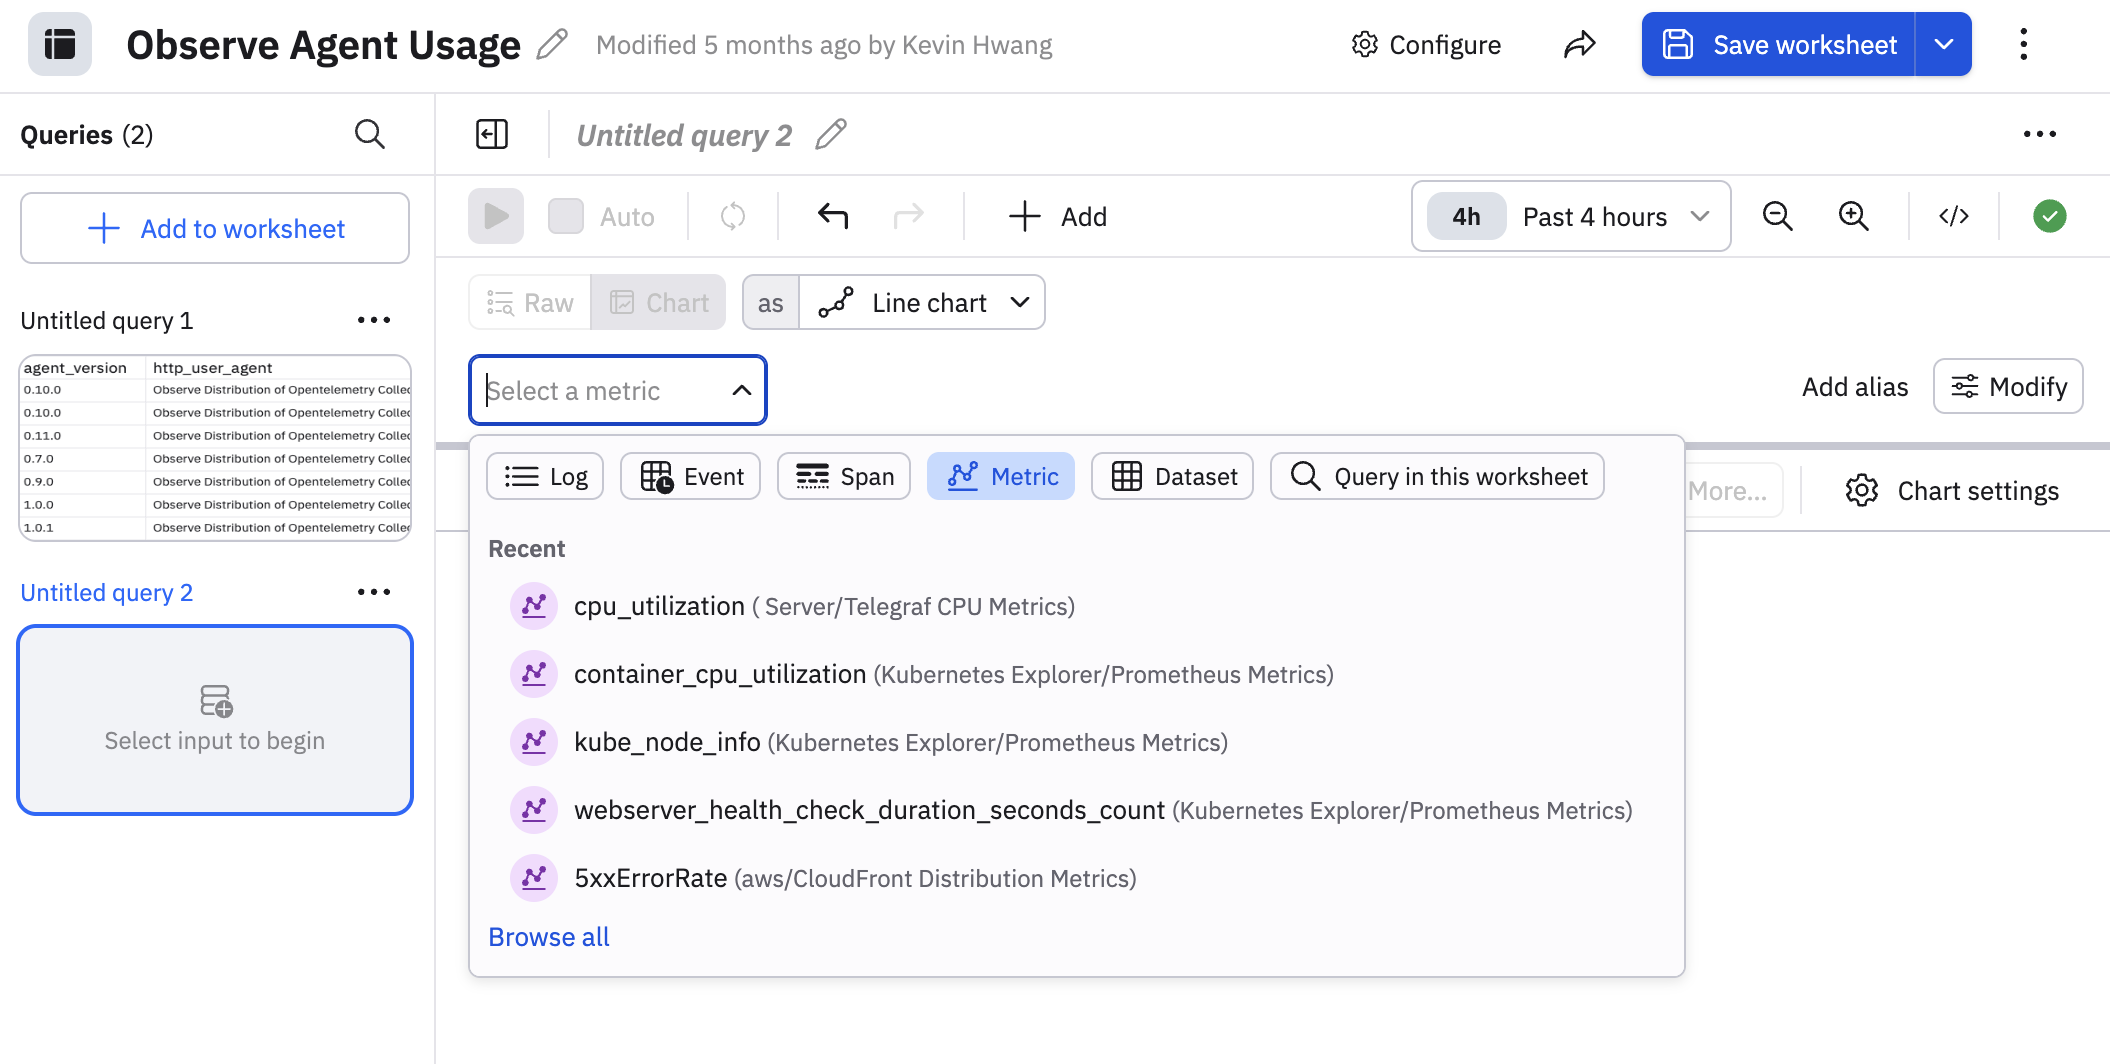
- Click Add to worksheet and select Metric.
- Select a metric from the list of related metrics.
Access Expression Builder from a dashboard card
Access the Expression Builder from a Dashboard card:
- In Observe, click Dashboards in the left navigation.
- Select a Dashboard from the list.
- On a card with metrics, click the vertical ellipsis icon () and select Open in Worksheet.
- Click Add to worksheet, then select Metrics.
- Select a metric, such as
cpu_utilization.