Azure virtual machines
Azure Virtual Machines provide a popular form of on-demand, scalable cloud computing resource offered by Azure. VMs are commonly used to develop and test applications in the cloud and extend data centers.
The Observe Microsoft Azure app helps you monitor the health and performance of your virtual machines with these features:
- A Dataset containing the details of individual virtual machines, allowing you to investigate their status and attributes over time.
- A dashboard with at-a-glance insights, such as CPU Utilization, Disk Operations, and Network Throughput.
- Additional Datasets for resources related to your virtual machines, such as Virtual Machine Disks, Network Interfaces, and Public IPs, as well as metrics and logs related to those resources.
- Sample monitor configurations to enable proactive alerting on changes in your virtual machines health.
Observe provides these tools as part of the Observe Azure Integration. To use them in your workspace, install the Microsoft Azure app.
NoteTo monitor the operating system or processes running on an Azure Virtual Machine, rather than the information that Azure provides about that hypervisor, install the Observe Agent on your host to get operating system-level metrics such as memory usage and free disk space.
Installed Datasets
By default, the Microsoft Azure app installs the following Datasets related to Azure virtual machines:
Event Dataset
- Virtual Machine Metrics
Resource Dataset
- Virtual Machine
- Virtual Machine Disk
- Network Interface
Azure Virtual Machine Monitor Templates
- CPU Threshold - alerts when any Virtual Machine percentage CPU is above a given threshold.
- Available Memory less than 5GB - alerts when any Virtual Machine available memory bytes drops below a given threshold.
- Disk Utilization over 80% - alerts when any Virtual Machine
os disk iops consumed percentagespikes above a given threshold.
View Azure virtual machines in Observe
The Observe Azure App offers the following dashboards related to the Azure Virtual Machines service:
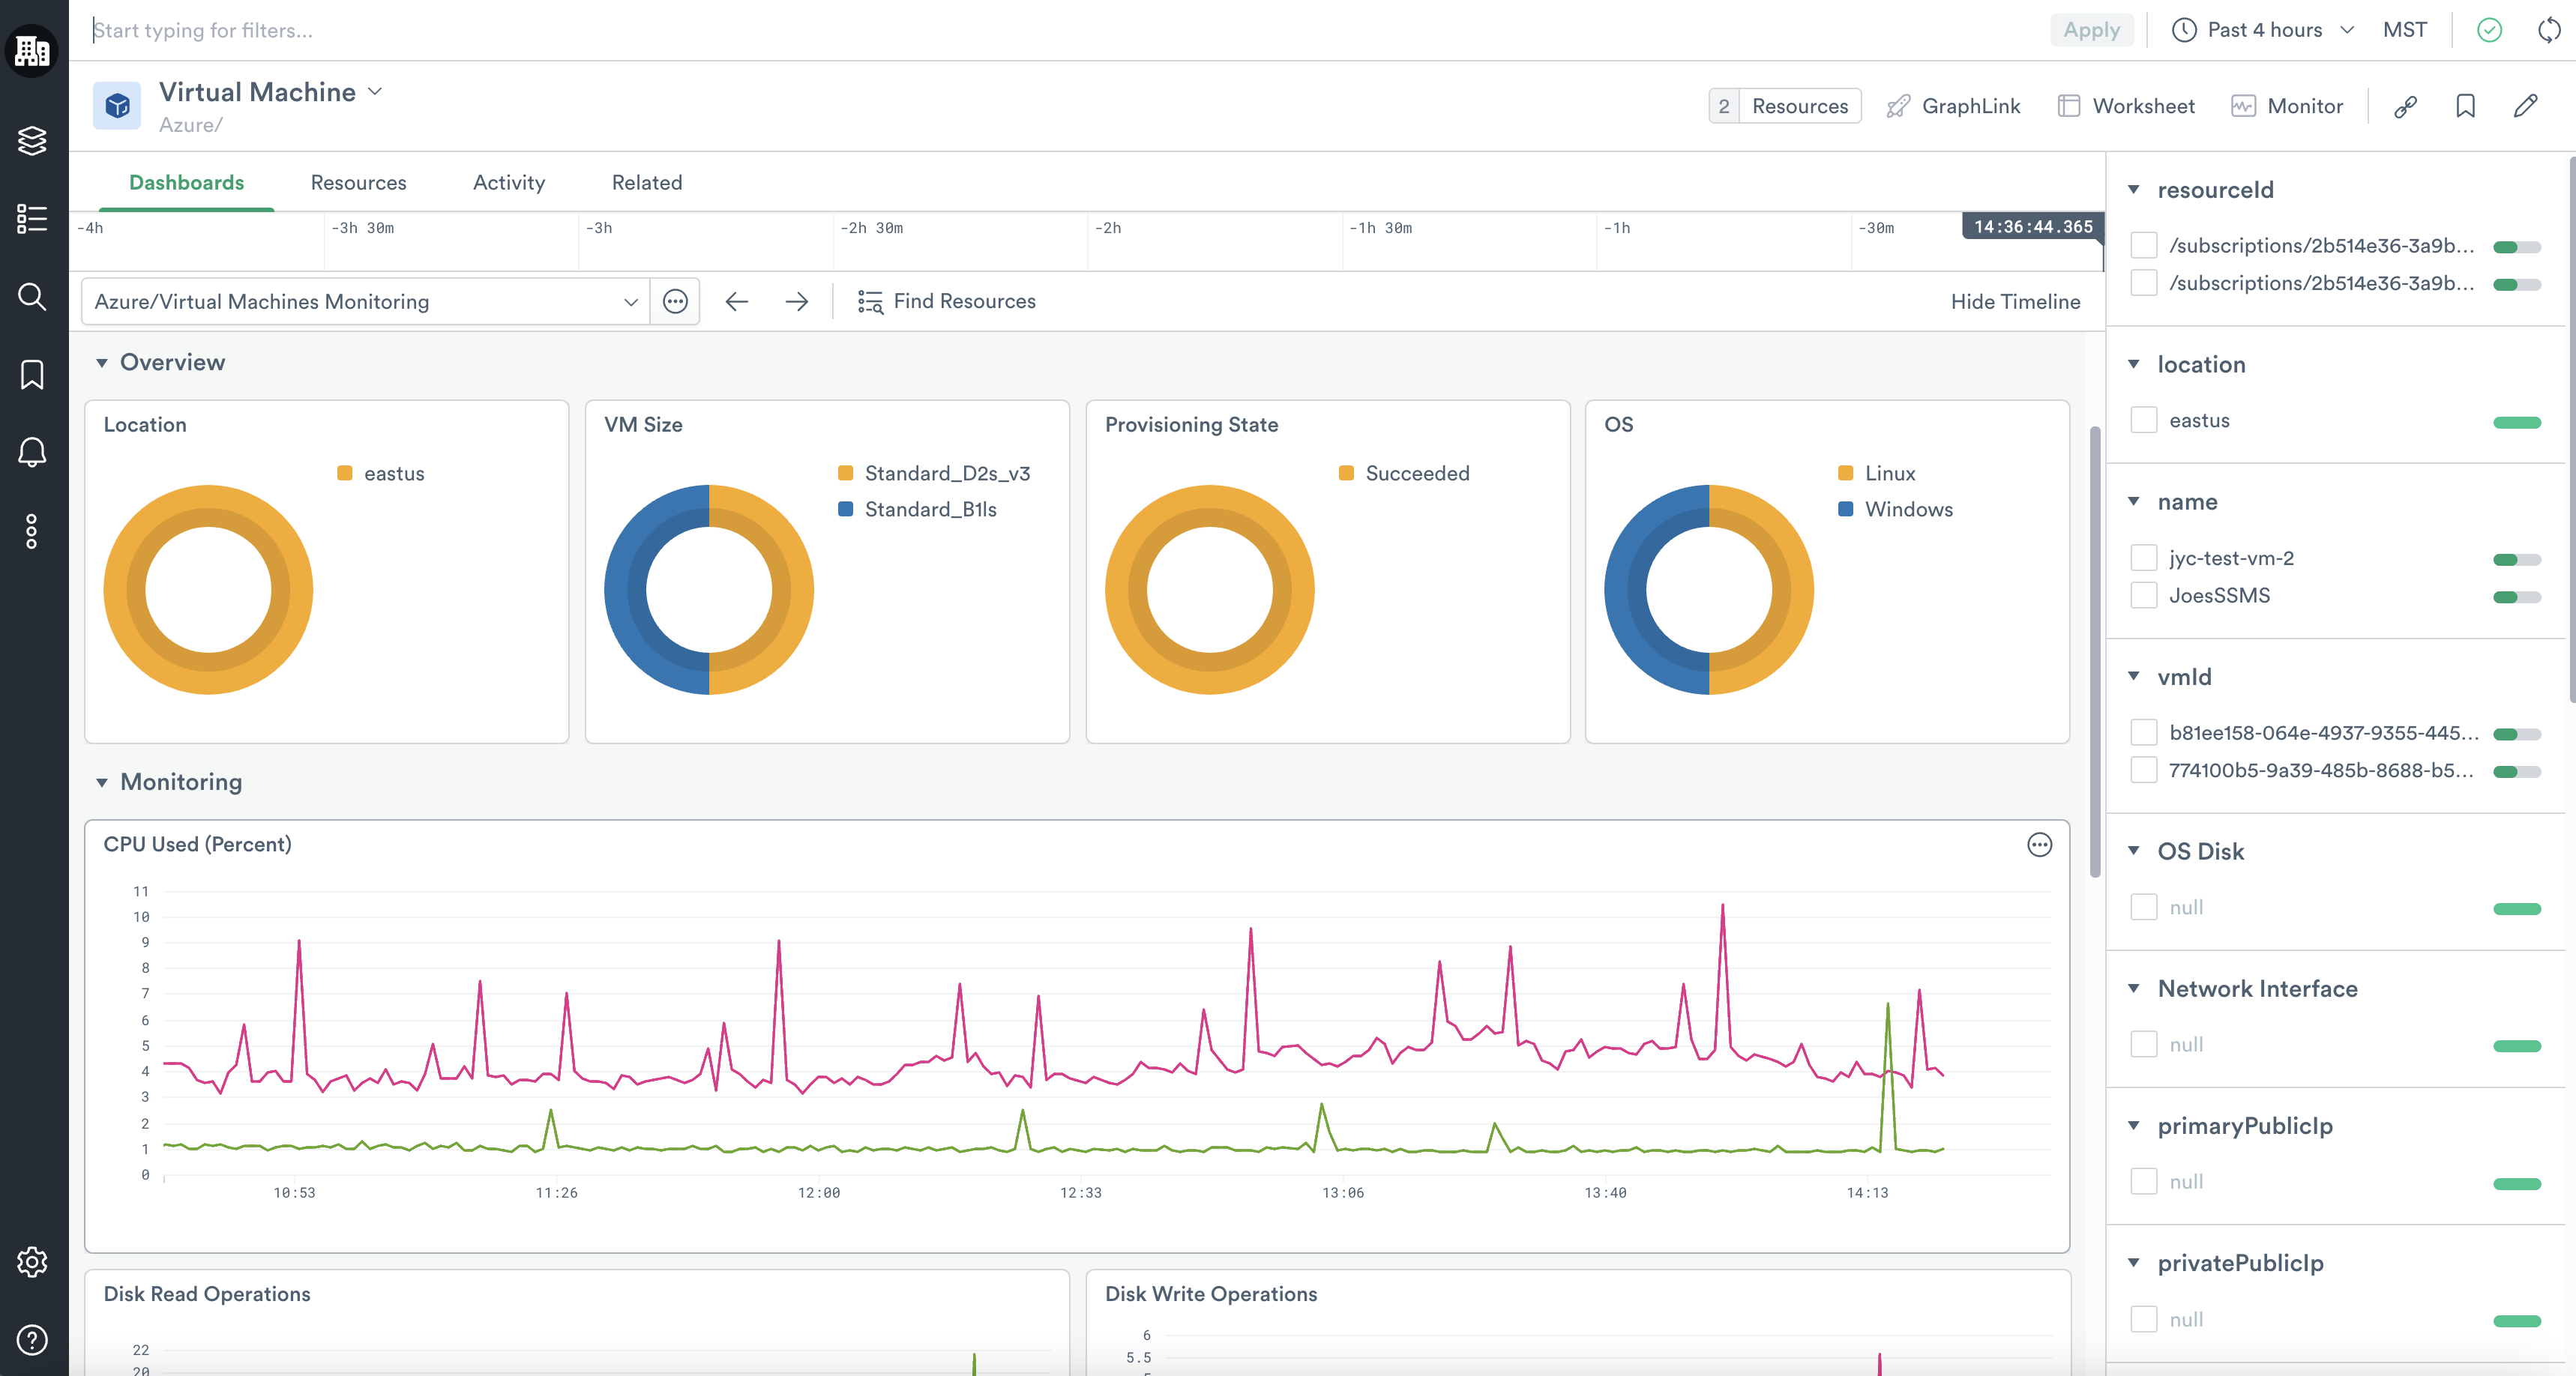
- Virtual Machines Monitoring - Summarizes Virtual Machine instances broken down by region, size, state, and operating system. Shows key stats over time, including CPU Used, Disk Read/Write Operations, and Network In/Out.
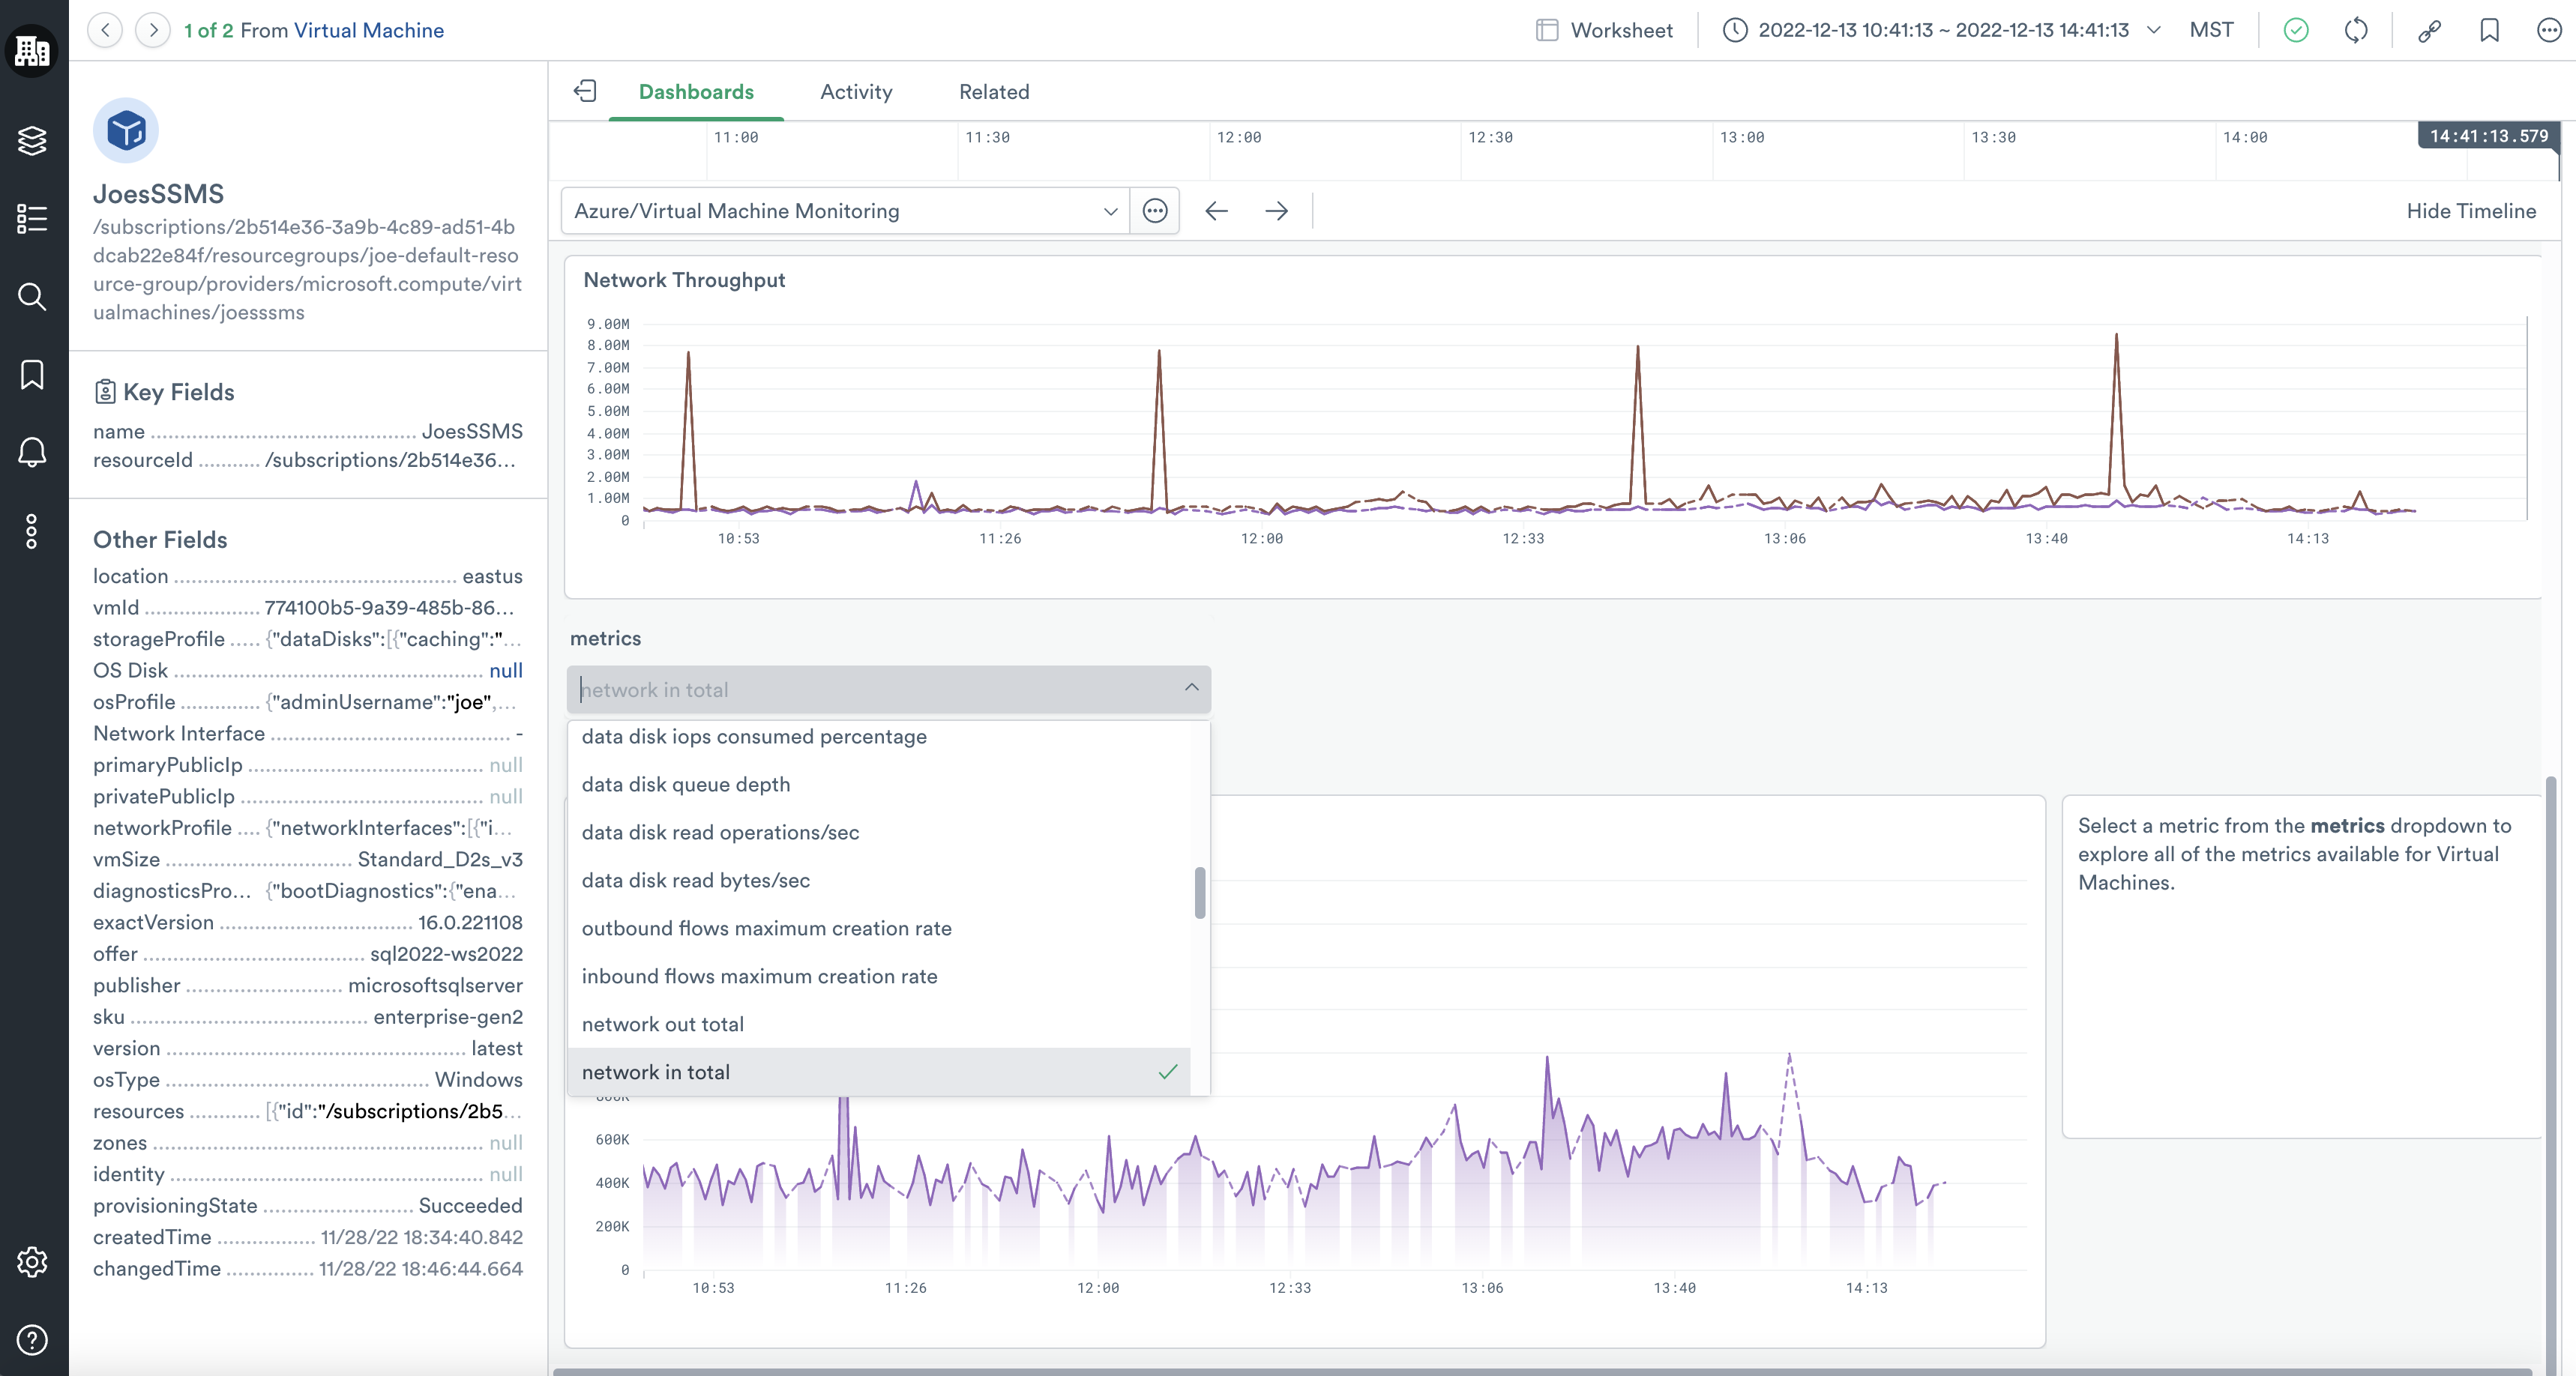
- Virtual Machine Instance dashboard also includes a Metrics Explorer, which allows you to plot any metric Azure generates for a given Virtual Machine over time.
Setup - Install Azure virtual machines
To start monitoring Azure Virtual Machines, first, install the Install and configure the Microsoft Azure app. The Azure Virtual Machines service is enabled by default with the enable_virtual_machines_service input toggle.
Updated 6 months ago