Kubernetes Resource Utilization

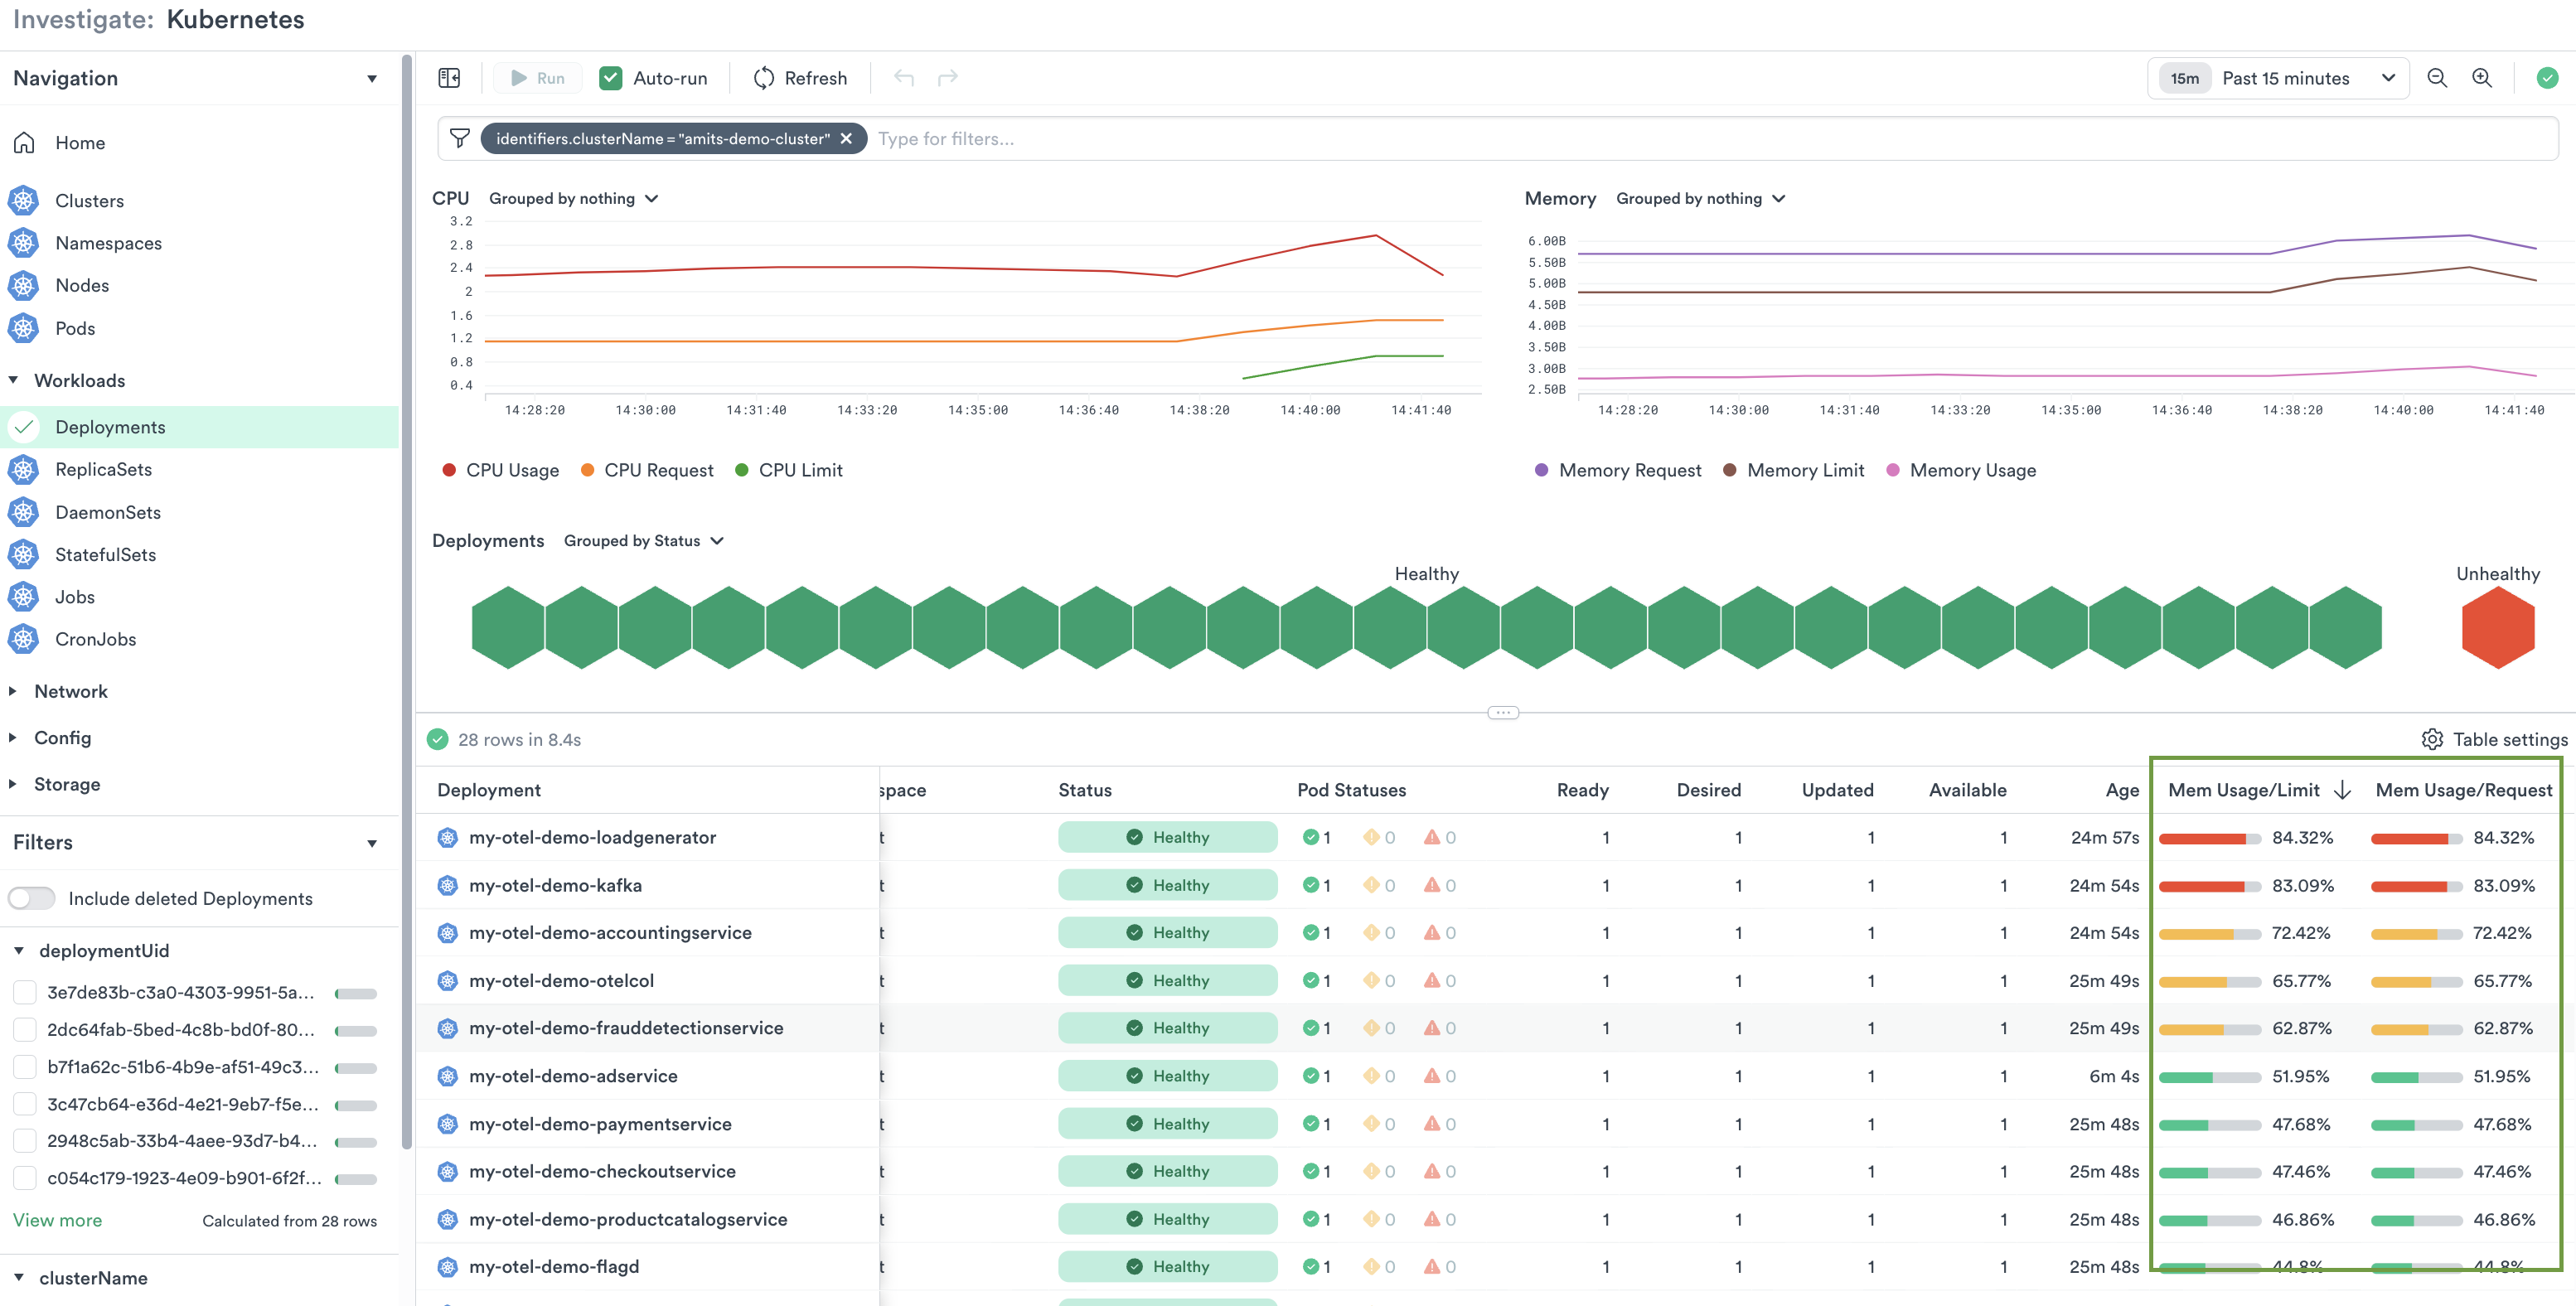
Kubernetes resource utilization view gives you visibility into how your Kubernetes workloads are using compute and memory resources across the infrastructure. This helps you to understand resource usage and make informed decisions about sizing and capacity planning, as well as reducing the amount of CPU or memory waste.
With historical and constantly updated current resource request and limits, you can understand usage patterns and rightsize bin packing to improve efficiencies.
Usage
In Kubernetes Explorer, select the component such as Deployments, Pods, etc. that you want to drill into. The data table lists CPU and memory utilization vs. requests and limits.
CPU Usage/Requests: Sum of usage divided by sum of requests, as a percentage.
CPU Usage/Limits: Sum of usage divided by sum of limits, as a percentage.
CPU Graph: A line graph displaying the evolution of usage, requests, and limits over time. You can pick the time window by setting it on the top right corner of the page.
You can drill down into CPU/Memory usage per container by clicking into Metrics tab in the Pod details page.
Memory Usage/Requests: Sum of usage divided by sum of requests, as a percentage.
Memory Usage/Limits: Sum of usage divided by sum of limits, as a percentage.
Memory Graph: A line graph displaying the evolution of usage, requests, and limits over time. You can pick the time window by setting it on the top right corner of the page.
You can drill down into CPU/Memory usage per container by clicking into Metrics tab in the Pod details page.
Rightsizing resources
Having idle CPU and memory is essential to allow your application to scale without pods being CPU throttled or terminated unexpectedly due to OOMKilled. However, excessive idle resources can lead to inflated costs, while insufficient reserves increase the risk of performance issues and reliability failures as demand rises.
To achieve the right balance, analyze usage data over an extended timeframe instead of relying solely on current activity when making resource allocation decisions. Pick time rage of over a month to review the usage trends over a period of time and validate your sizing hypothesis.
Note
Metrics are not shown for groups that include any pod with containers missing resource requests or limits, as we cannot calculate usage percentages without this information.