Acceleration Manager
Use the Acceleration Manager to diagnose and fine-tune Acceleration Credit consumption for Datasets and monitors in your Observe account.
Observe periodically pre-computes the latest contents of Datasets in order to make queries faster and more efficient than queries on the raw data ingested into Observe. Observe calls this process data acceleration.
The data acceleration process is tuned with a setting called a freshness goal. The freshness goal of a Dataset or monitor states the maximum time delay between the periodic updates that the platform makes to that Dataset or monitor. A tighter freshness goal asks the platform to perform these updates more frequently in order to keep data fresher and more up-to-date, and a looser freshness goal allows the platform to perform these updates on a slower schedule. In general, a tighter freshness goal generally results in a higher rate of Acceleration Credit consumption, and a looser freshness goal results in a lower rate of Acceleration Credit consumption. Thus, tuning the freshness goal allows you to make a trade-off between the freshness of data in these datasets and the cost of accelerating queries on them. The minimum dataset freshness goals and any downstream freshness goals dictate how often Observe executes acceleration of the data.
For example, if regular review of your Usage Dashboard reveals that the Dataset kubernetes/Pod Metrics consumes more credit than expected, you can change that in the Acceleration Manager. If a one (1) minute freshness goal consumes more credit than you intend, you might change this setting to five (5) minutes and thereby reduce your Acceleration Credit consumption.
To lower the freshness goal, navigate to Acceleration Manager and search for the kubernetes/Pod Metrics Dataset. Select the Settings icon, and then Edit Freshness Goal. Loosen the freshness goal), review if there are warnings produced, then click Apply. Your dataset now accelerates once every five minutes and decreases the number of consumed Acceleration Credits.
To understand more about data acceleration and the impact on your Datasets, see Queries and on-demand acceleration. For details on freshness goals for datasets, see Transform queries and Freshness goals.
Access the Acceleration Manager
You can access the Acceleration manager in any of the following ways:
- In the left navigation rail, select Data & integrations > Acceleration.
- In the left navigation rail, hover on your user name, then select Manage account, then click Acceleration manager.
- Use to the following URL, replacing
${observe_tenant}with your observe tenant ID:
https://${observe_tenant}.observeinc.com/settings/acceleration-managerOngoing acceleration jobs
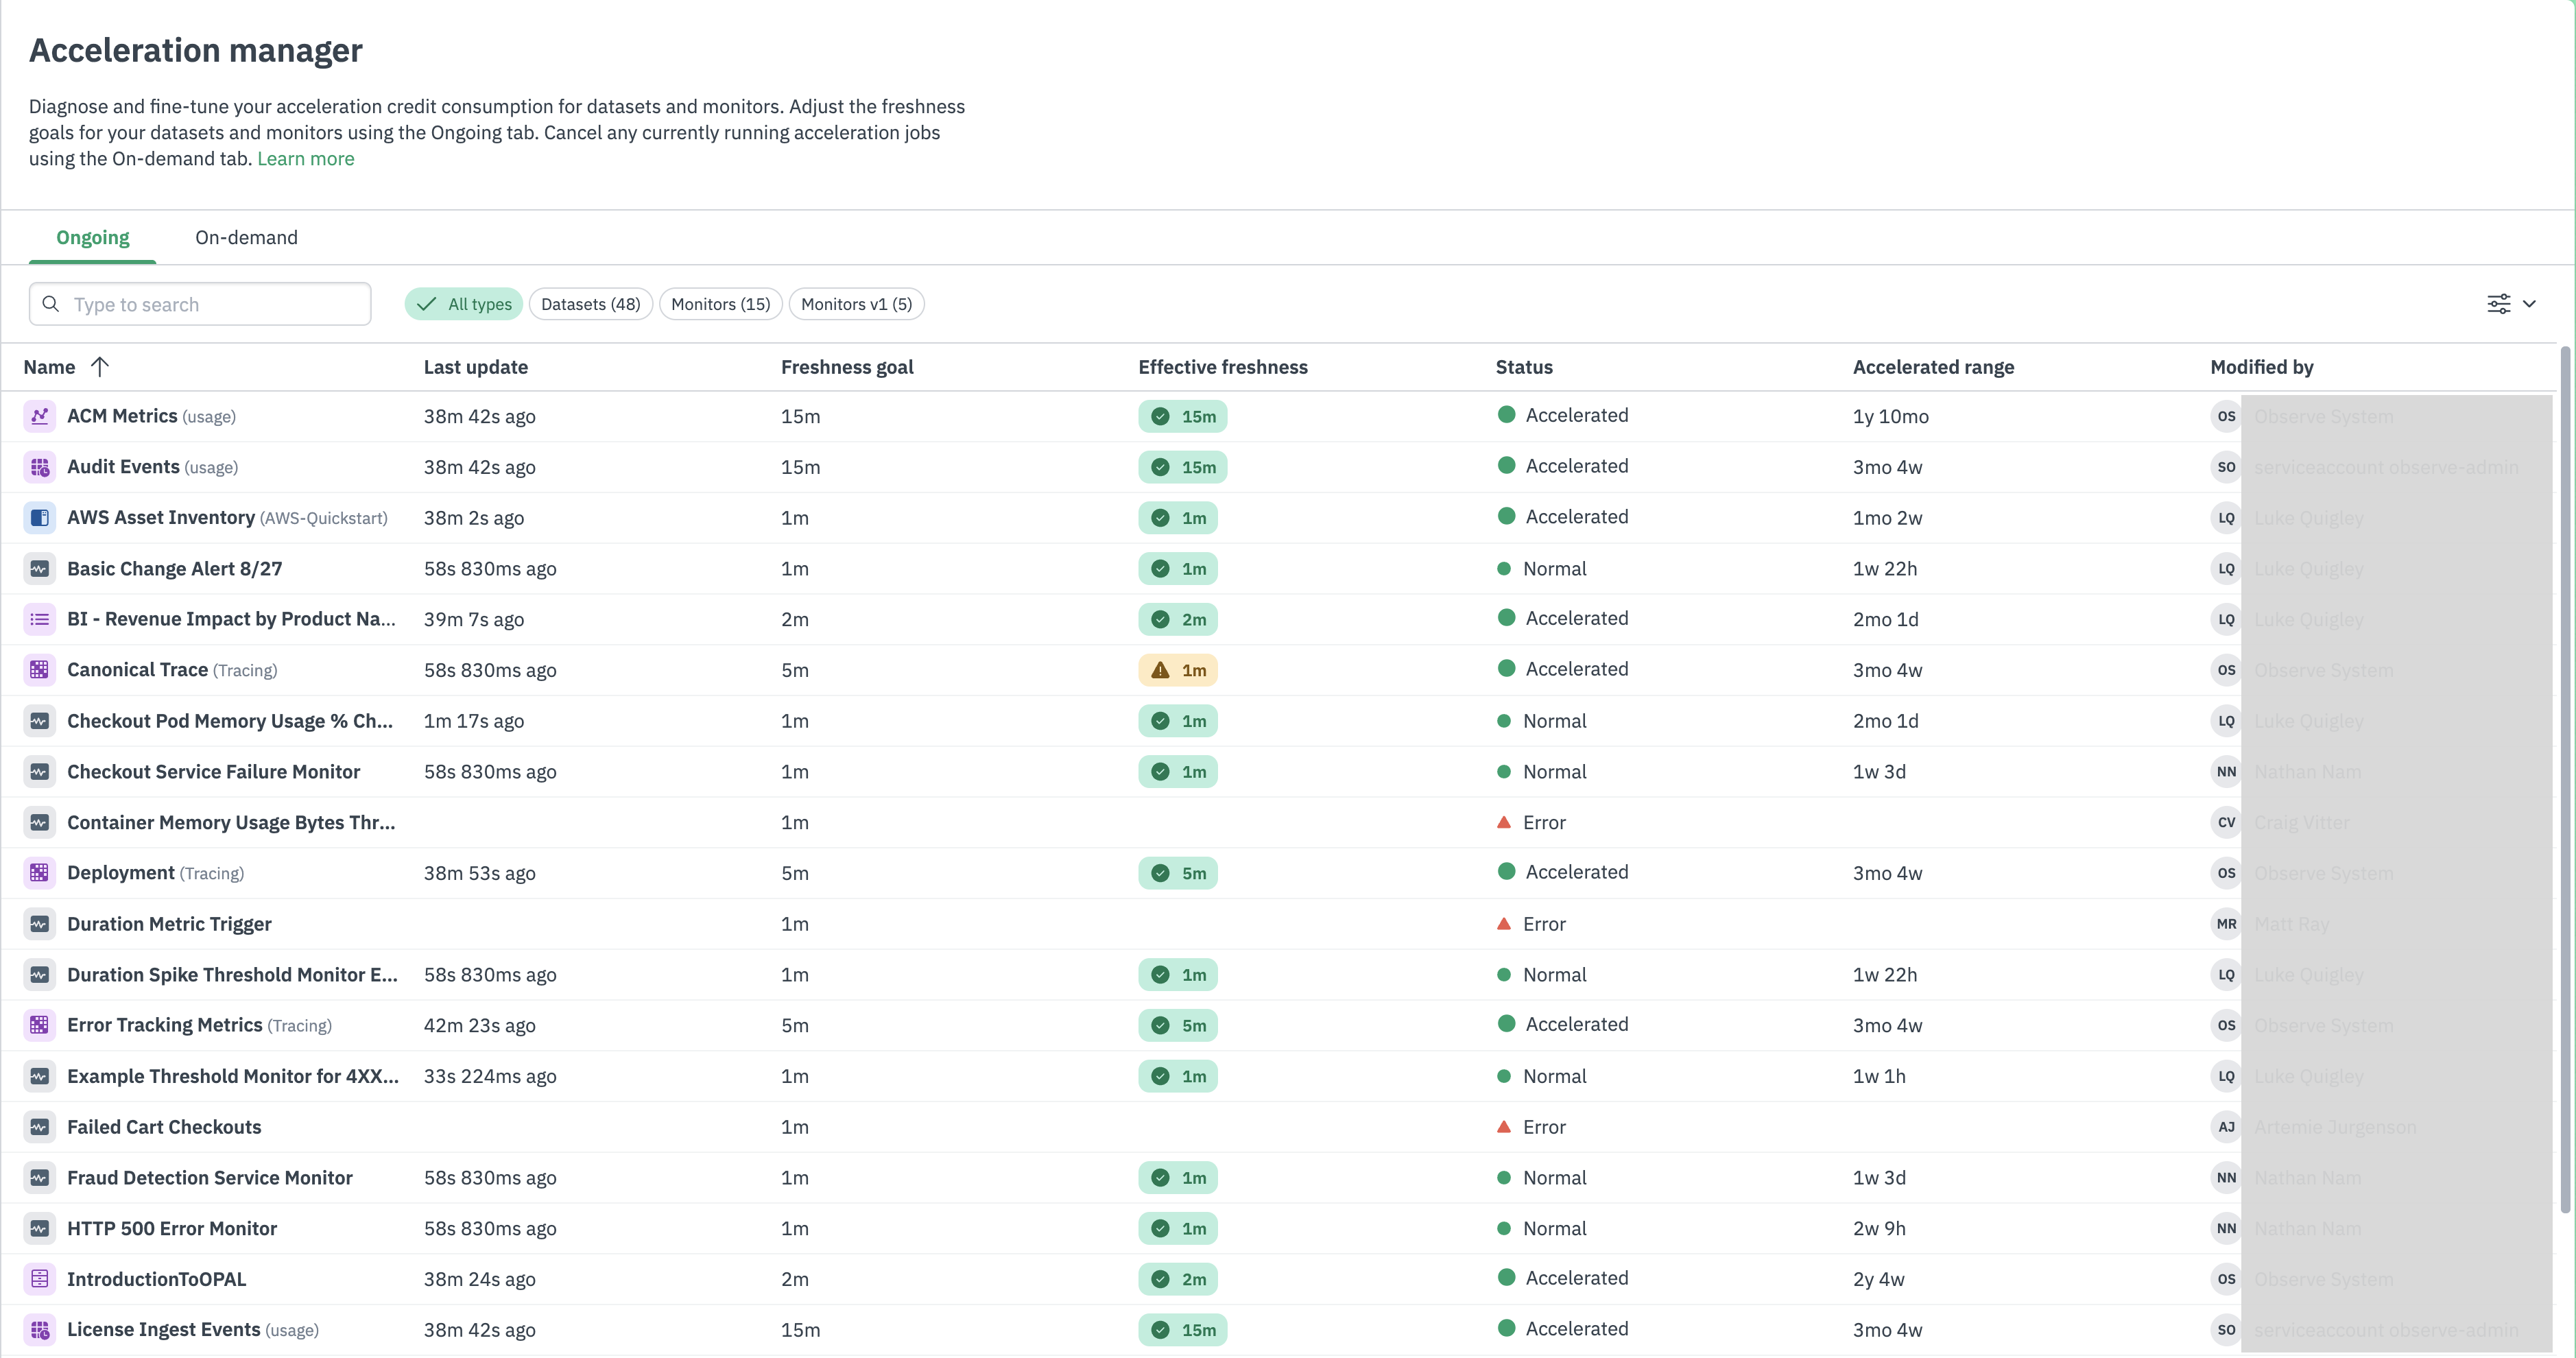
The Acceleration Manager page displays the following information about your Datasets and Monitors:
| Column | Description |
|---|---|
| Name | The name of the Dataset with an icon to indicate the Dataset type as Event Stream or Resource. |
| Last Update | The last time the Dataset was updated. |
| Freshness Goal | How often you want Observe to update the Dataset. Observe schedules Dataset acceleration jobs to satisfy the freshness goals of all Datasets. Longer freshness goals allow Observe to include more data in an acceleration job, providing more efficiency and less credit usage overall. |
| Effective Freshness | The current freshness of the Dataset. |
| Status | The current status of the Dataset such as Accelerated, Cannot Be Accelerated, or Backfill in progress. |
| Acceleration Range | The length of time to apply acceleration to the Dataset. This is the range of data currently accelerated. |
| Modified By | The name of the member who last modified the Dataset definition. |
Effective freshness
Effective Freshness shows the rate at which a dataset or monitor is actually being refreshed, after adjustments for the freshness goals of upstream and downstream datasets. For instance, in a dataset chain of foo (5 minute goal), bar (10 minute goal), and baz (1 minute goal), all three datasets have an effective freshness of 1 minute. Note that automatic freshness decay is not reflected in this column, but its effect can be seen in the Last update column.
You may see one of two icons displayed next to the Effective Freshness value:
- Yellow triangle - There is a downstream or upstream dataset or monitor that has a tighter freshness goal than this object, preventing the set goal from matching the effective goal. Alternatively, the freshness goal of this Dataset may be suppressed due to an Acceleration Credits limit in Credit Manager. In either case, data may be less fresh than you desire. See Credit Manager for more information on Acceleration Credits.
- Red triangle - There is a downstream Dataset or Monitor with a tighter freshness goal than this object, preventing the set goal from matching the effective goal.
Use these steps to change the freshness goal for a selected Dataset:
- Hover over a Dataset row to get the context menu on the right side, and click the Edit dataset freshness lightning icon to open the Freshness Goal modal.
- Set the Desired Freshness value. The Effective Freshness message displayed on the modal changes to let you know if this goal can be met. Click Apply to commit the change, or Cancel to abort.
If Desired Freshness of this dataset is affected by other upstream or downstream datasets or downstream monitors, they will be listed on the modal. Click the pencil icon on the affected object’s row to adjust the freshness goals of that datastream or monitor. Note that a back arrow icon is placed at the top left of the modal during this step, so you can return to your original position.
NoteIf you use Acceleration Credits limits in the Credit Manager feature to budget your accelerations, Observe will warn of accelerations breaching that limit in Effective Freshness.
Accelerated range
The Accelerated Range value shows how far back your data is accelerated in this dataset for the most recent schema applied as per the latest dataset definition. This is effectively since the dataset was first created or re-materialized after an edit.
For example if you update a Dataset with an Accelerated Range of 50 weeks, the new accelerated range will be 7 days, the default backfill. The older data is not lost, but a user will need to backfill to re-accelerate that data. This will happen automatically as users query the dataset, but with some delay to materialize the data on the fly. To prevent delay and re-accelerate all of the available data, open the dataset page or a Dashboard or Explorer that uses this dataset, click the Query Overview icon in the top right, and click “Accelerate Full Range.”
On-demand acceleration jobs
The On-Demand tab displays the status of Datasets currently undergoing acceleration from natural on-demand usage or the Accelerate Full Range button.
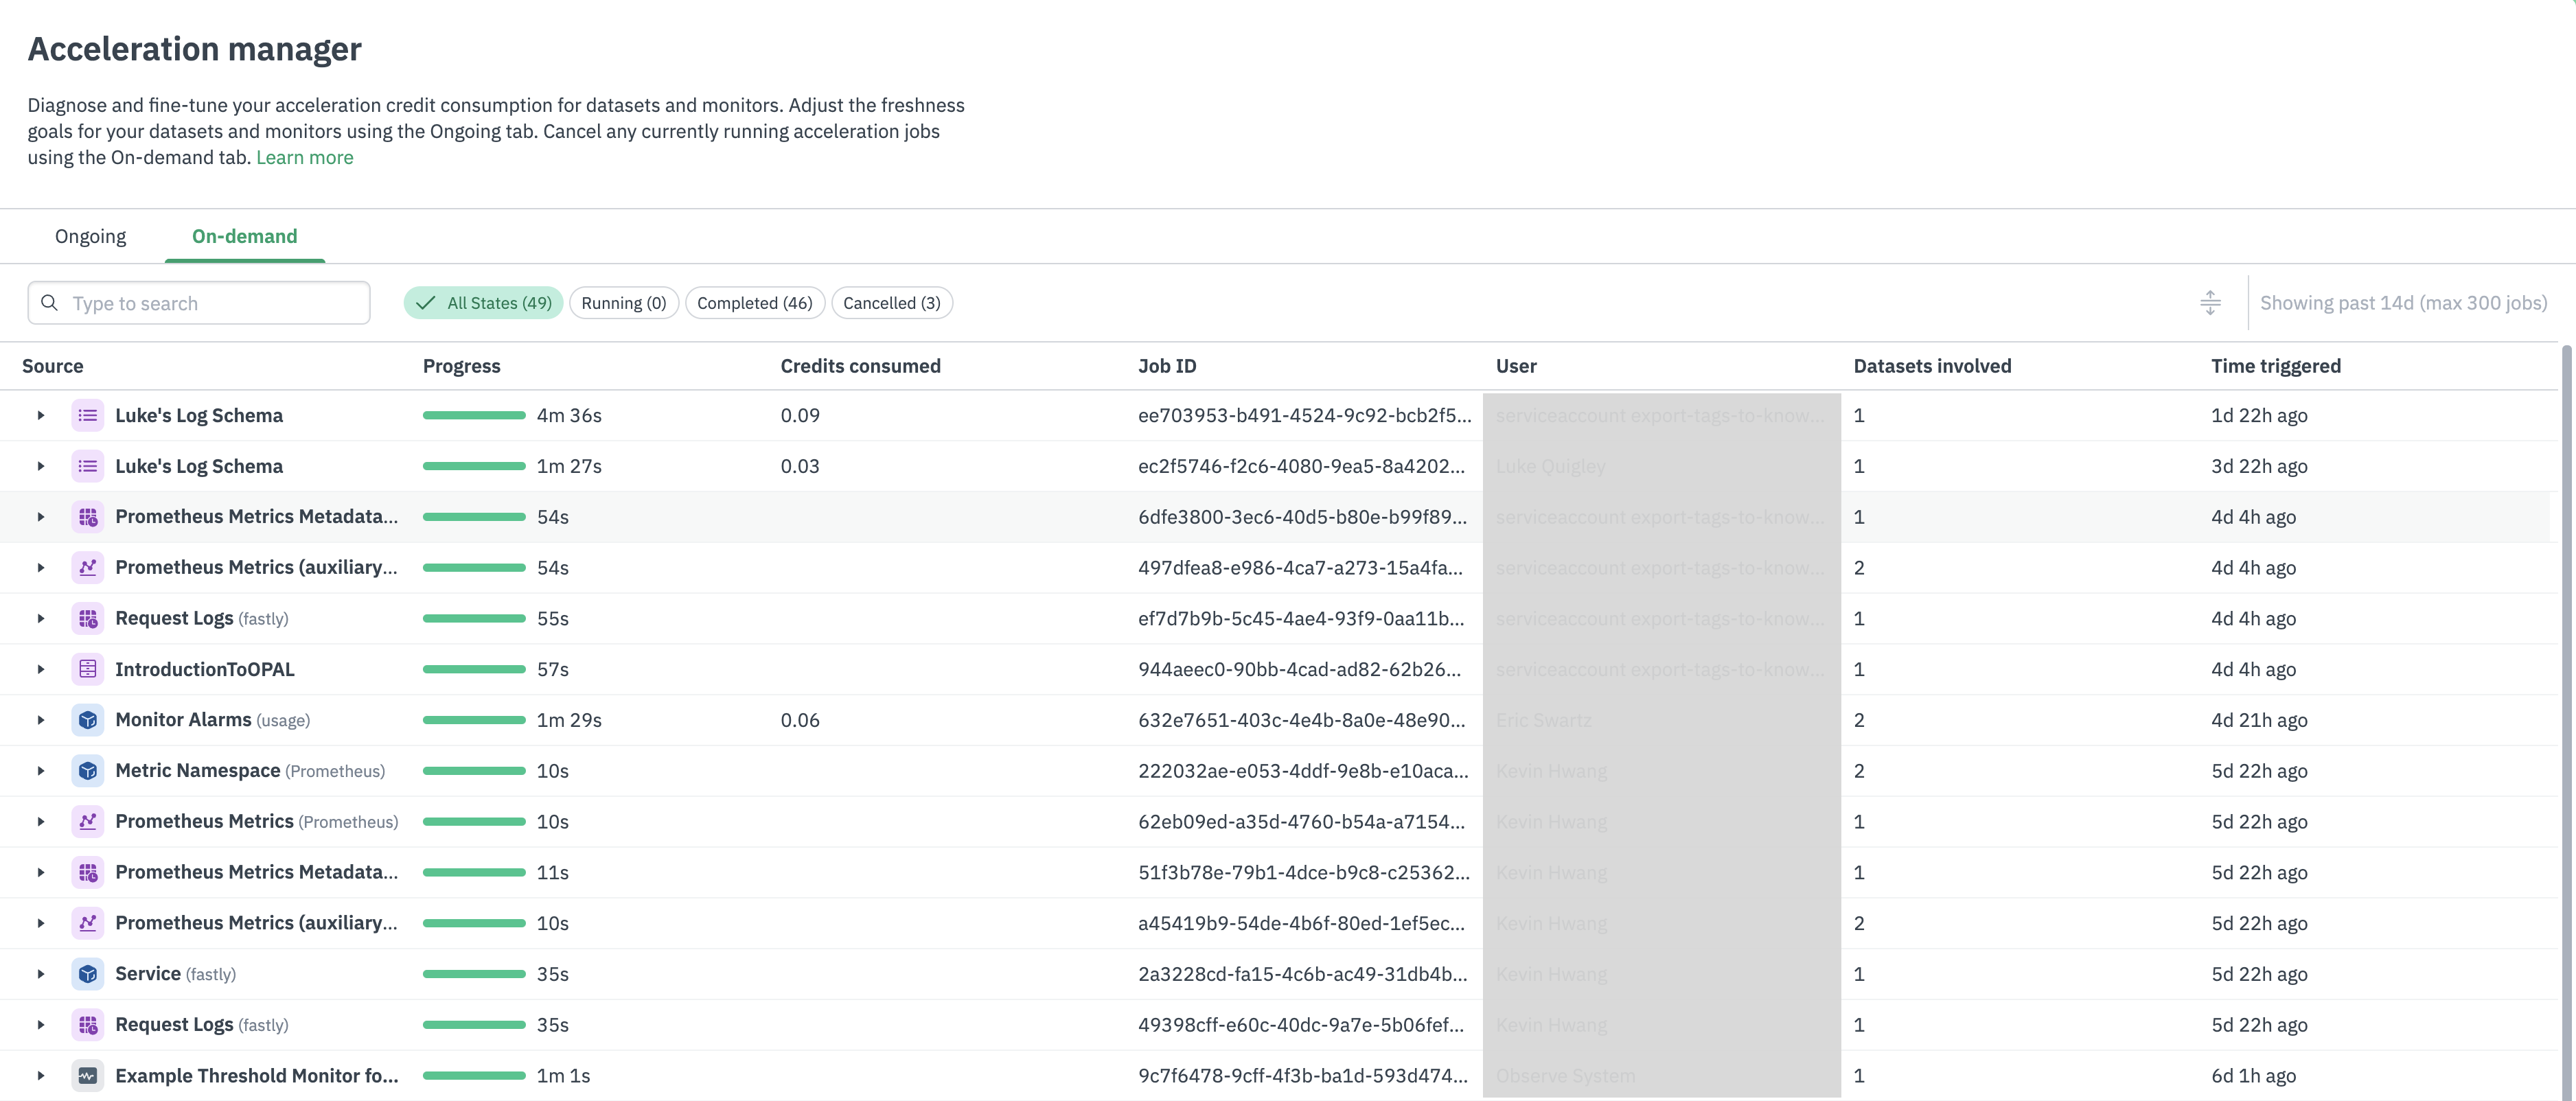
You can select to display them by the following types:
- All states - displays Acceleration Jobs in any state.
- Running - displays Acceleration Jobs currently undergoing the acceleration process.
- Completed - displays Acceleration Jobs that finished the acceleration process.
- Canceled - displays Acceleration Jobs canceled during the acceleration process.
On-Demand Acceleration Jobs also displays the following information:
| Column | Description |
|---|---|
| Source | The Dataset group. Click the caret () icon to expand any group and view the underlying Datasets. |
| Progress | The status of each acceleration job. |
| Credits Consumed | The amount of acceleration credits used by each acceleration job. |
| Job ID | The unique system ID of each accleration job. |
| User | The user who requested the acceleration job for the Dataset. |
| Datasets Involved | The number of Datasets accelerated. |
| Time Triggered | The time when the Acceleration Jobs was requested. |
Updated 6 months ago