Get Google Cloud data into Observe
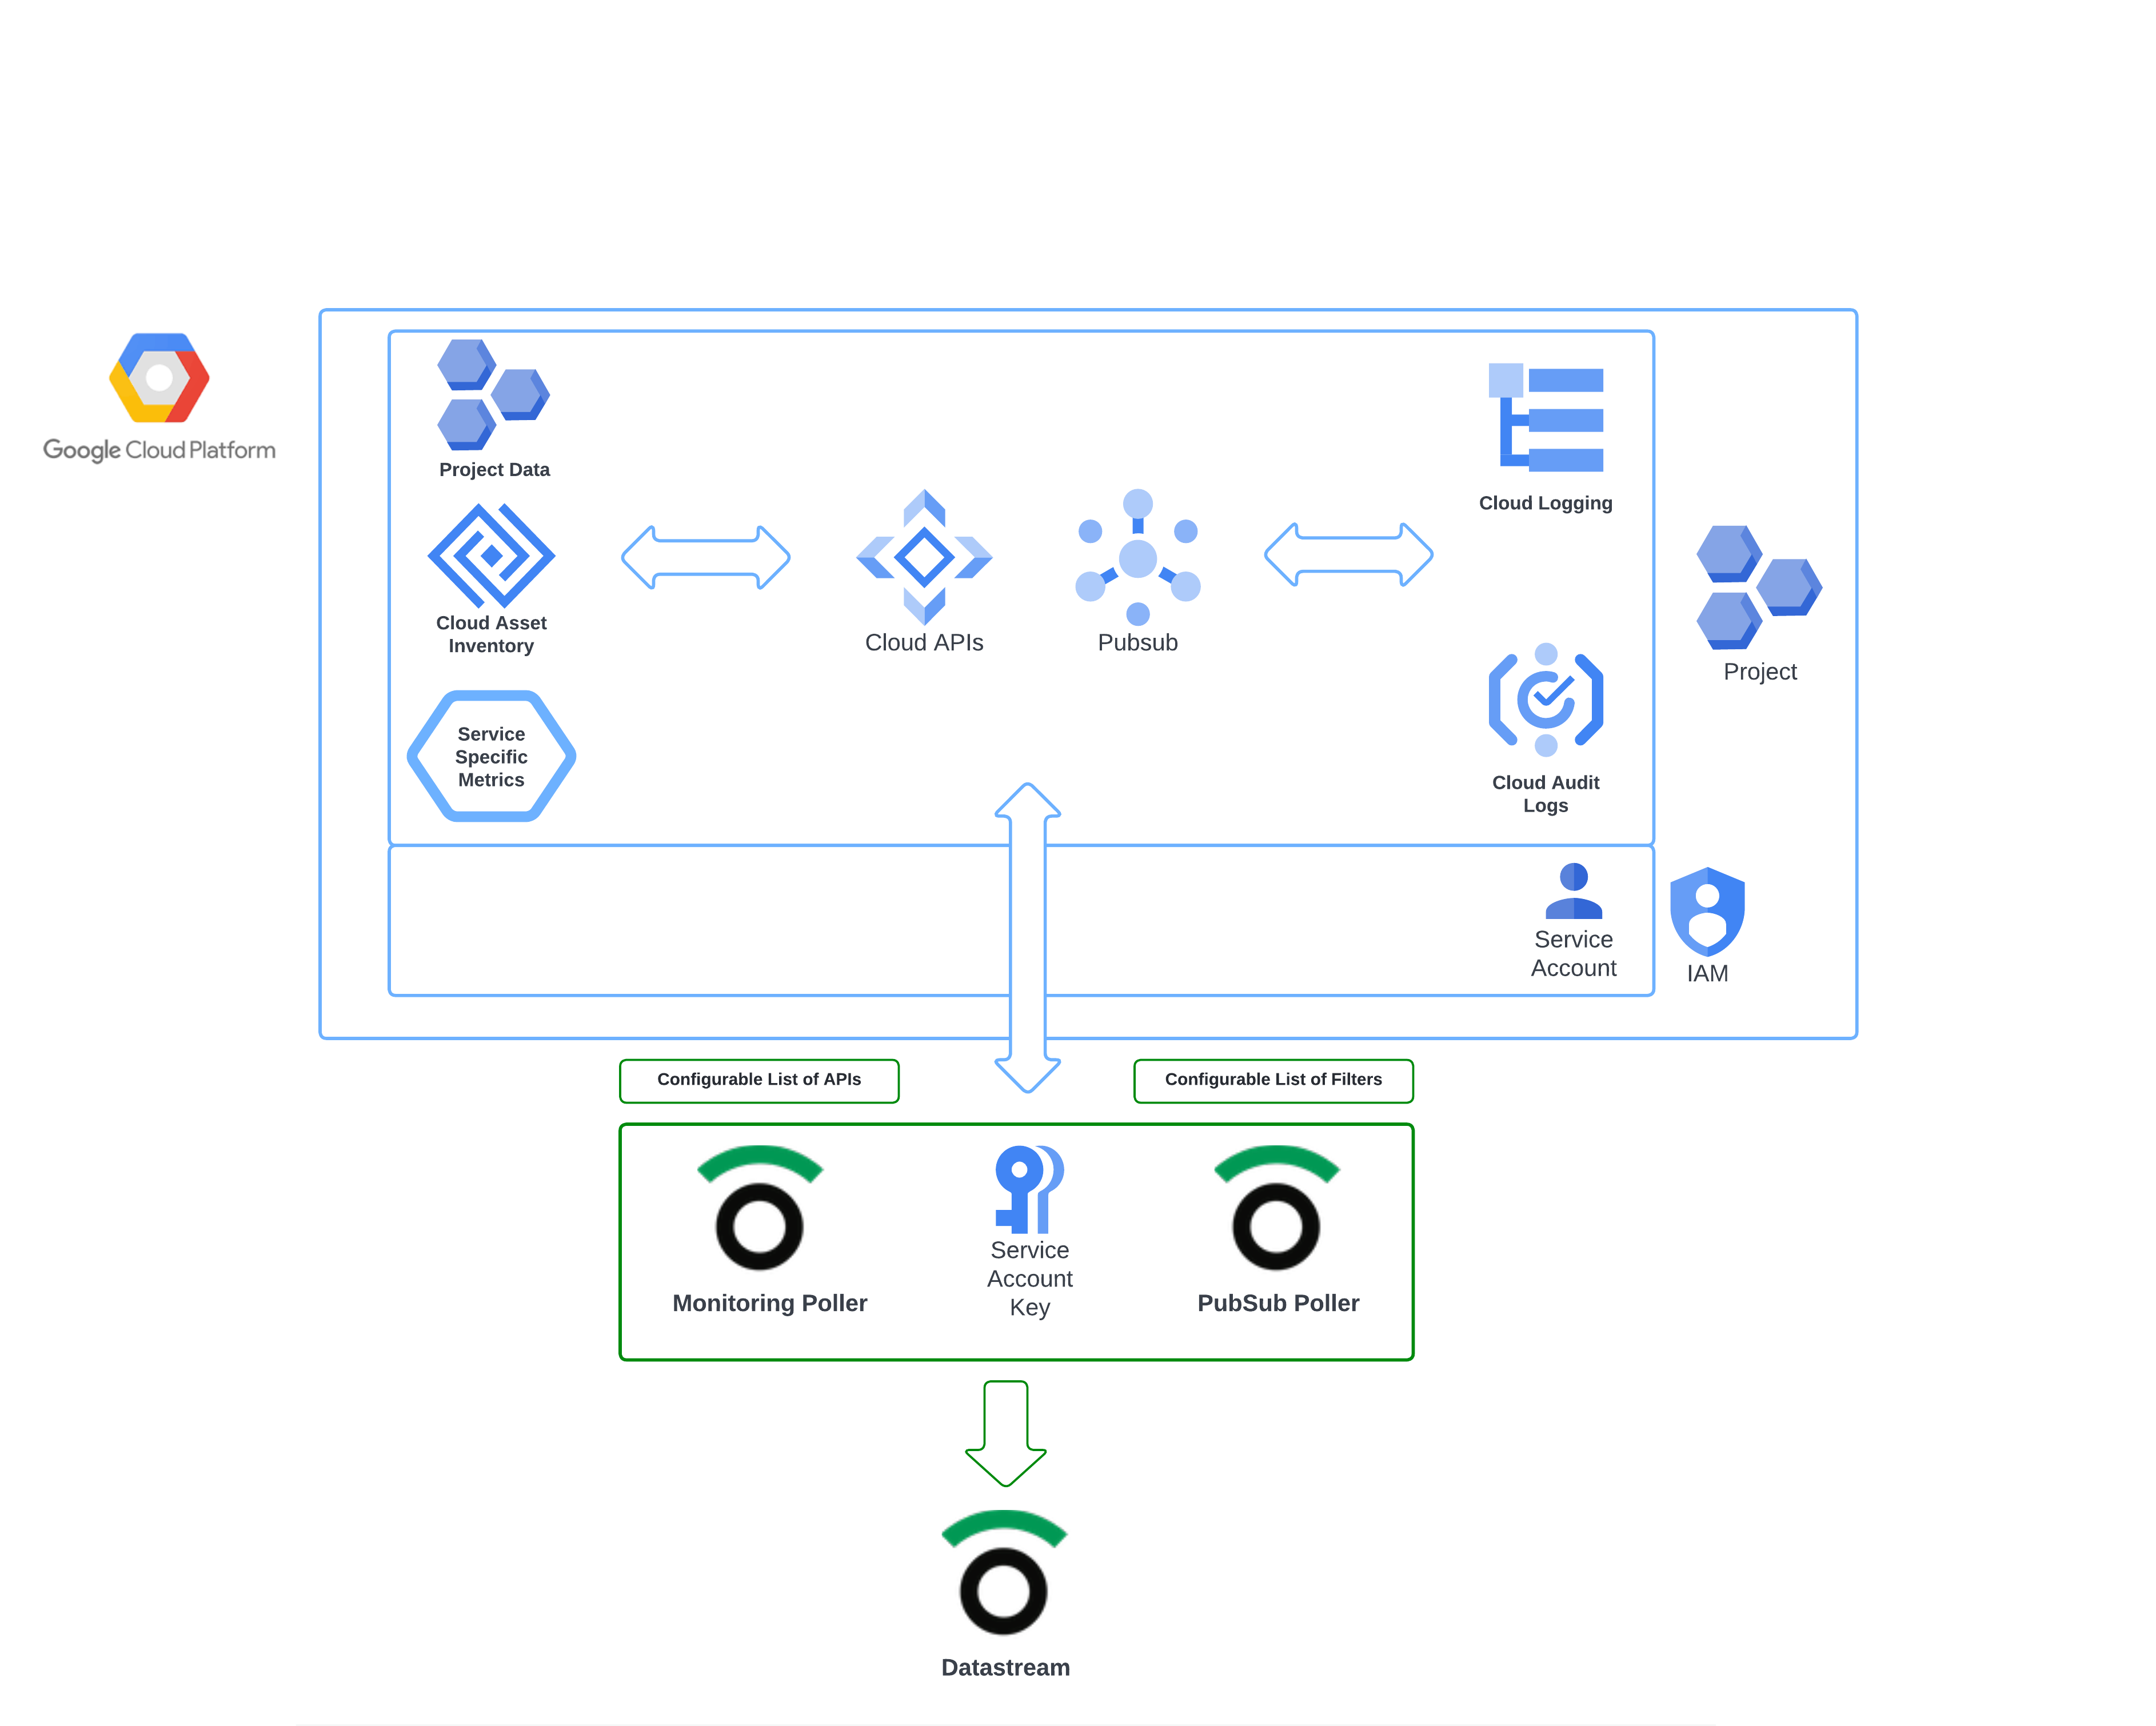
The Observe Google Cloud Platform (GCP) app streamlines the process of collecting data from GCP. A Pub/Sub topic makes logging and asset inventory information available and monitoring APIs expose metrics from several common GCP services at once. Observe pollers then ingest the data into your Observe environment.
What GCP data does Observe ingest?
The GCP collection automatically ingests the following types of data from a single project:
Asset inventory
GCP Asset Inventory maintains a five week history of asset metadata for your Google Cloud resources and policies. Observe ingests this data with a poller so you can track the state of your GCP assets and monitor changes over time.
Examples of metadata for Google Cloud assets include the following:
Resources:
- Compute Engine virtual machines (VMs)
- Cloud Storage buckets
- CloudSQL instances
Policies:
- IAM policy
- Organization Policy policy
- Access Context Manager policy
Logs
GCP Logging provides a managed service for logging data across GCP components. The service routes logs to other locations through a log sink. The Observe GCP app creates a sink that routes logs to a GCP Cloud Pub/Sub topic. Observe pollers periodically ingest this data from the topic. Configure your desired logs and polling frequency in the GCP app Connections tab.
Metrics
Observe ingests metrics from Google Cloud metrics API endpoints using an Observe poller. Each metric is associated with a metric type, a prefix identifying the category of the metric.
To ingest all available metrics of a particular type, add the metric prefix to your GCP app poller configuration. For example, to ingest Compute metrics:
- In the Google Cloud Platform Quickstart app, select the Connections tab.
- Under Existing connections, click Assets-Metrics poller to view poller details.
- Click Edit this poller to view its configuration.
- In Include Metric Type Prefixes, add
compute.googleapis.com/and click Update.
Setup overview
Observe provides a Terraform module that creates service accounts, log sink, and a Pub/Sub topic as well as the subscription needed by Observe pollers for your GCP Project. (Observe Google Collection GitHub repository). You can also follow the GCP console installation instructions in Configure your GCP project using the GCP console to provision those resources.
Observe pollers, using your created service account key, extract assets, logs, metrics, and project data and send it into your Observe account at a set interval.

Updated 2 months ago