Mustache template reference for Slack
Observe Monitors allow for extensive customization via the use of the Mustache specification. In addition to supporting the standard behaviors, we also support some additional Observe-specific extensions.
Extensions to the Mustache spec
Besides the base behavior given in the Mustache specification, the following extensions are added by Observe.
NoteThe special
#test_valueis not enabled at this time.
Custom function support
Observe added the ability to treat sections of rendered template as mutable by a function. A specific use case is to apply formatting or encoding to a single section of a template, but not the whole template. The real power is passing rendered sub-elements to the function as they may not be properly formatted for their context. The syntax is like:
{{~customize}}
This text will be {{presented}} for mutation by the `customize` function.
{{#subsection}}
This text will also be {{.}} mutated.
{{/subsection}}
{{/customize}}
The custom functions that Observe supports for monitoring include:
{{~urlpathescape}}: Used in the path part of a url to ensure it is encoded properly.{{~urlqueryescape}}: Used in the query parameters of a url to ensure it is encoded properly.
Array indexing
When a section is an array, each item in the array will be invoked to render the section. However, you can target a specific index using an integer identifier.
{{#array.1}}The item at index 1 is {{.}}{{//array.1}}This also means you can use this as a trick to render 0 or 1 times if an array has any elements or not.
{{#array.0}}This will only render if array has non-zero elements{{/array.0}}

{{#array}}This would render N times, one for each element{{/array}}
Fragments
This is not so much an extension, as a change in terminology worth mentioning. At the API level, we accept a JSON object of "fragments" which are the same concept as mustache "partials". These are accessed in the calling template using the partials syntax. So, if you add a fragment object like:
    "fragments": {
        "fruit": "<b>apple</b>",
        "vegetable": "{{veggie}}"
    }
Then you can access them in your template like:
Today, I really want to eat {{>fruit}} and skip eating {{>vegetable}}You may note that the fruit fragment is allowed to contain formatting and will not be escaped and you may also note that the vegetable is still a full featured template itself and will attempt lookups and rendering on the fly using the same options as the main template.
Iteration
A mustache section is rendered N times when the referenced field is an array of values. When the field is an array, a few additional fields will be added to the element to aid in iteration. These can be especially helpful if you are rendering things like JSON templates where "danging/trailing commas" are not permitted.
For example, to render a JSON array of the names in the captured values of an alert. Using the isFirst check, an array item can be prepended with a ", " for all but the first item in the array.
{{#alert.values}}
[{{^isFirst}}, {{/isFirst}}{{name}}]
{{/alert.values}}
Top-level objects
Monitors have two top-level objects you can access for templating:
{{monitor}}: Items about the monitor{{alert}}: Items about the alert
For all of the following examples, they are shown with the full path to the object, and all of the sub fields of that section.
{{monitor}} section
{{monitor}} section{{name}}: The monitor name{{description}}: The description saved with the monitor{{id}}: The Observe object ID for this monitor.{{type}}: One of "Count", "Promote", or "Threshold"{{icon}}: The icon saved with the monitor{{url}}: The link to the monitor in the Observe console.{{variables}}: Pre-rendered templates defined in the monitor's custom variables.
{{monitor.variables}} section
{{monitor.variables}} sectionThe Observe UI supports title and message variables that can be referenced in inline and shared actions. These variables are similar to Fragments/Partials in that they can reference the rest of the variables in this document. Because they are variables, they will be encoded at the place they are used, so you can use plain text in the variable and depending on how it is used in your action, it will be appropriately encoded.
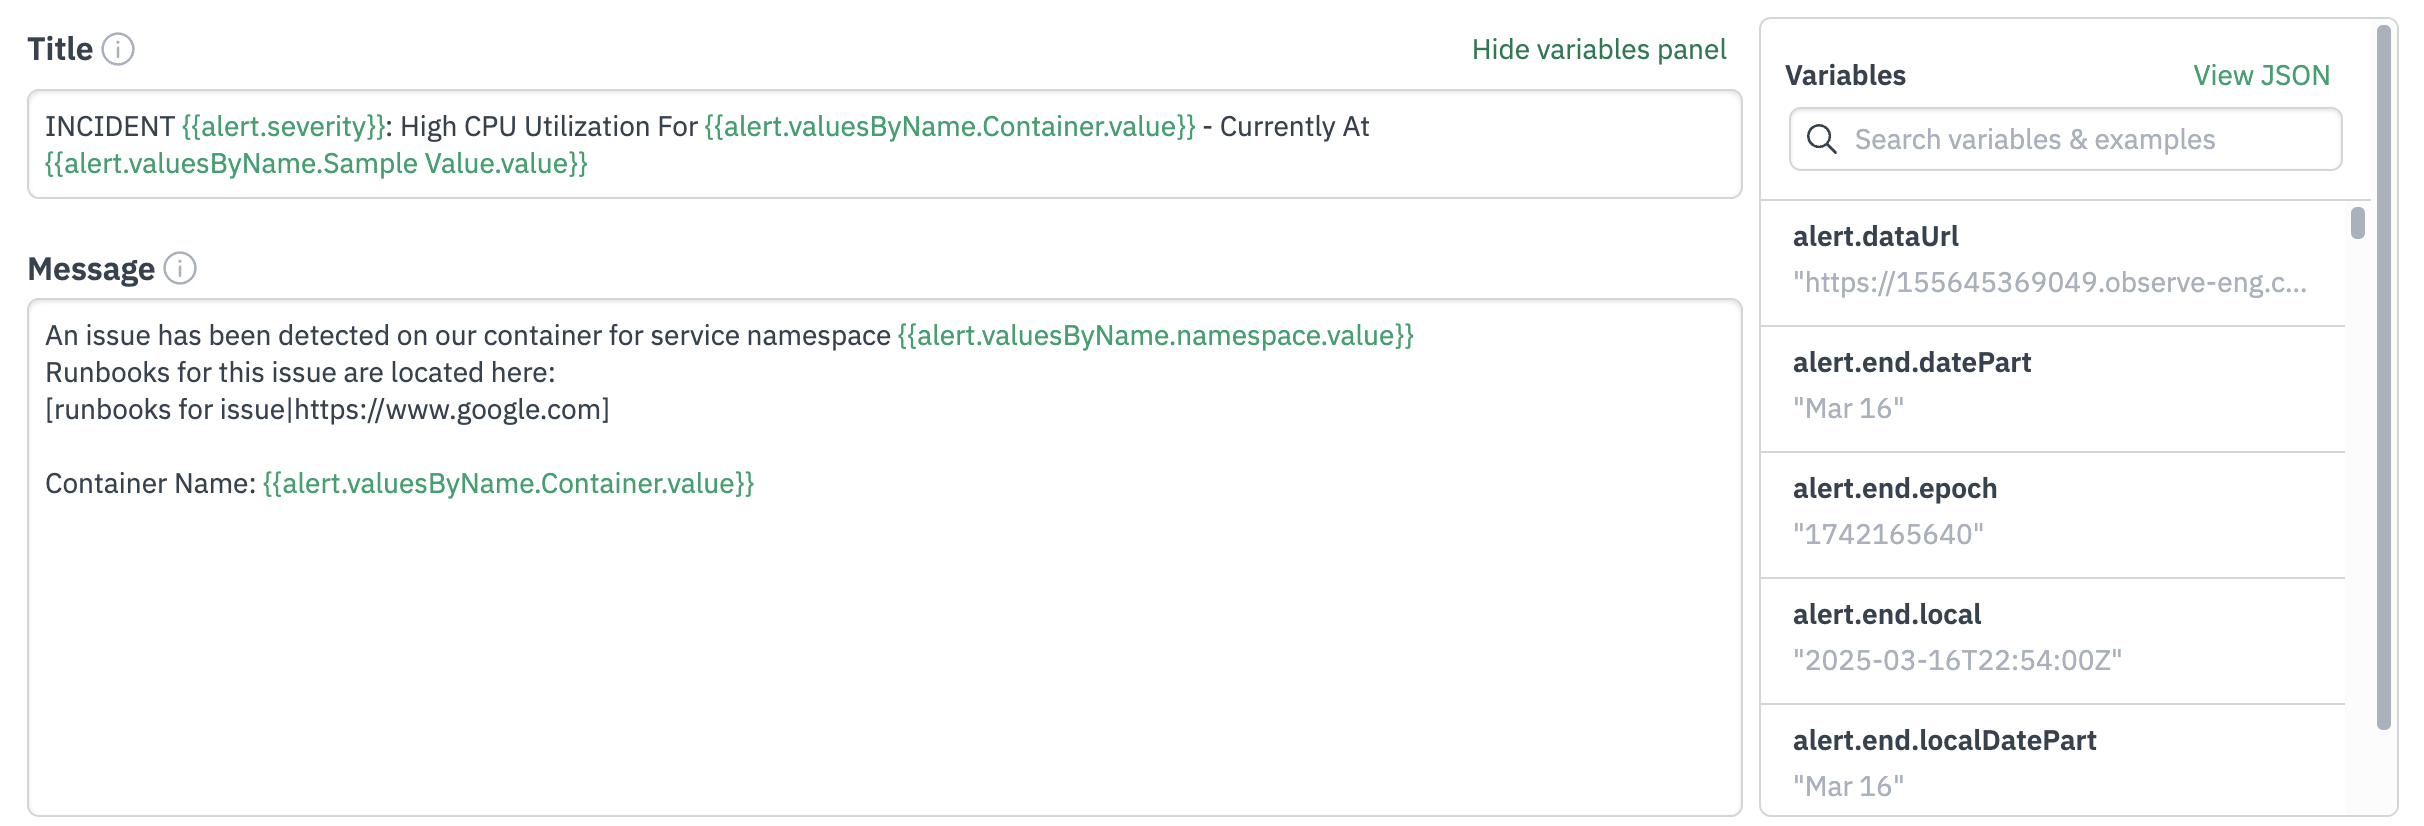
For example lets take a threshold monitor that monitors container CPU utilization, and has the following content for the {{monitor.variables.title}} and {{monitor.variables.message}} sections respectively.
Title:
INCIDENT {{alert.severity}}: High CPU Utilization For {{alert.valuesByName.Container.value}} - Currently At {{alert.valuesByName.Sample Value.value}}Message (formatting examples provided for Slack and JIRA):
An issue has been detected on our container for service namespace {{alert.valuesByName.namespace.value}}
Runbooks for this issue are located here:
[runbooks for issue|https://www.google.com]

Container Name: {{alert.valuesByName.Container.value}}
An issue has been detected on our container for service namespace {{alert.valuesByName.namespace.value}}
Runbooks for this issue are located here:
[runbooks for issue](https://www.google.com)
Container Name: {{alert.valuesByName.Container.value}}You can then reference the above as variables in an action. To continue with our example, we will add a webhook shared action with the following JSON payload.
{"fields": {
        "summary": "{{monitor.variables.title}}",
        "issuetype": {
            "id": "10002"
        },
        "project": {
            "key": "SCRUM"
        },
        "description": {
            "type": "doc",
            "version": 1,
            "content": [
                {
                "type": "paragraph",
                "content": [
                    {
                    "text": "{{monitor.variables.message}}",
                    "type": "text"
                    }
                ]
                }
            ]
        }
    }
}
The resulting preview in your monitor will look similar to the following (formatting examples provided for Slack and JIRA):
{"fields": {
        "summary": "INCIDENT Error: High CPU Utilization For fluent-bit - Currently At 10.6752",
        "issuetype": {
            "id": "10002"
        },
        "project": {
            "key": "SCRUM"
        },
        "description": {
            "type": "doc",
            "version": 1,
            "content": [
                {
                "type": "paragraph",
                "content": [
                    {
                    "text": "An issue has been detected on our container for service namespace observe-110491371772\nRunbooks for this issue are located here:\n[runbooks for issue|https://www.google.com]\n\nContainer Name: fluent-bit",
                    "type": "text"
                    }
                ]
                }
            ]
        }
    }
}
{"fields": {
"summary": "INCIDENT Error: High CPU Utilization For fluent-bit - Currently At 10.6752",
"issuetype": {
"id": "10002"
},
"project": {
"key": "SCRUM"
},
"description": {
"type": "doc",
"version": 1,
"content": [
{
"type": "paragraph",
"content": [
{
"text": "An issue has been detected on our container for service namespace observe-110491371772\nRunbooks for this issue are located here:\n[runbooks for issue](https://www.google.com)\n\nContainer Name: fluent-bit",
"type": "text"
}
]
}
]
}
}
}In this example, you can expect that your message will have newlines and quotes escaped for use in the text field of this JSON document.
{{alert}} section
{{alert}} section{{timestamp}}: The time the match was seen. Same as{{timestamp.rfc3339}}{{start}}: The time the match condition started. Same as{{start.rfc3339}}{{end}}: The time the match condition ended. This will only be set if isActive is false. Same as{{end.rfc3339}}{{isActive}}: Indicates if the matching condition is still triggering.{{url}}: A link to the Observe console for this alert.{{id}}: The Observe object ID for this alert.{{severity}}: The severity of the alert. Same as{{severity.level}}{{type}}: The event type that created this notification. Same as{{type.friendly}}.{{values}}: The values captured from the monitor match.{{dataUrl}}: A link to the Observe console to explore the data and filtered context that generated this alert.{{resources}}: An array of all the resources linked to this match.{{resourcesByLink}}: The same resources asresourcesbut you can index by the known resource type.
{{alert.start}} section
{{alert.start}} sectionThis variable can be rendered directly, which prints the rfc3339 value or using one of the sub fields.
{{rfc3339}}: The RFC3339 Format (like 2024-06-01T12:34:56Z){{timePart}}: Just minutes and seconds (like 12:34 UTC){{datePart}}: Just the date without the year (like Jun 01){{epoch}}: The unix seconds since epoch in UTC (like 1717244636){{local}}: Similar torfc3339, but in the configured local timezone.{{timezone}}: The IANA timezone string.{{localTimePart}}: Similar totimePart, but in the configured local timezone (like 12:34 EDT).{{localDatePart}}: Similar todatePart, but in the configured local timezone.
The local fields are a best-guess for cases where your notification does not have built-in timestamp localization support. For example, some webhooks can use a RFC3339 (or ISO8601) timestamp or a unix epoch value and will format to the user's application dynamically. Some destinations, like email, do not have this ability so a best-guess local time is generated. The ordering of this best-guess is as follows:
- The configured timezone of the monitor creator if this user is active and a timezone has been saved to their settings.
- The configured timezone for your organization in Observe
- UTC
{{alert.end}} section
{{alert.end}} sectionSame as {{alert.start}}
{{alert.timestamp}} section
{{alert.timestamp}} sectionSame as {{alert.start}}
{{alert.severity}} section
{{alert.severity}} sectionThis variable can be rendered directly, which prints the same as level or using the sub fields below.
{{level}}: One of "Critical", "Error", "Informational", or "Warning"{{isCritical}}: Indicates if the level is critical{{isError}}: Indicates if the level is error{{isWarning}}: Indicates if the level is warning{{isInformational}}: Indicates if the level is info
{{alert.type}} section
{{alert.type}} sectionThis variable can be rendered directly, which prints the same as friendly or using the sub fields below.
{{eventType}}: One of "NewAlarm", "Reminder", "AlarmEnded"{{friendly}}: A more user-friendly version of eventType{{isNewAlarm}}: Indicates if the event type is NewAlarm{{isReminder}}: Indicates if the event type is Reminder{{isAlarmEnded}}: Indicates if the event type is AlarmEnded
{{alert.values}} section
{{alert.values}} sectionThis variable can be enumerated as a section and contains all values captured from the monitor match. You can filter by the type, which allows you to, for example, only print only the group-by values. Not all columns of a monitor match are captured. Values that are used to link to resources, to define the grouping, are part of the aggregation (like count), or are part of a promote monitor are captured.
{{#alert.values}}
Each Column Name: {{name}}
{{/alert.values}}

{{#alert.values}}
    {{type.isGroupBy}}Grouped By {{name}} : {{value}}{{/type.isGroupBy}}
{{/alert.values}}{{type}}: The type contains sub fields you can use to test why the value was captured. A value can be multiple types.{{name}}: A rendered name for the captured column value{{value}}: The captured value in string form{{isFirst}}: Indicates if this is the first in the iteration{{isLast}}: Indicates if this is the last in the iteration
{{alert.values.type}} section
{{alert.values.type}} sectionThis subtype that has "is*" flags for each of the types a value can be. These are not necessarily exclusive.
{{isGroupBy}}: The value is used in the grouping.{{isAggregation}}: The value is part of the aggregation calculation.
{{alert.valuesByName}} section
{{alert.valuesByName}} sectionYou can access the same elements as {{alerts.values}}, but using a lookup by their unique name. All of the same fields exist except for the iteration fields isFirst and isLast.
This would produce the same output in the previous example where {{alert.values.name}} is equal to value captured from "Flavor" column.
{{#alert.valuesByName.Flavor}}
My favorite ice cream flavor is {{value}}
{{/alert.valuesByName.Flavor}}
{{alert.resources}} section
{{alert.resources}} sectionThis variable can be enumerated as a section for each resource. Each resource contains:
{{label}}: The label or name of the resource{{value}}: The label value dereferenced from the resource{{url}}: A link in Observe to the resource dashboard{{explorerUrl}}: A link in Observe to the resource explorer for this resource{{isFirst}}: Indicates if this is the first in the iteration{{isLast}}: Indicates if this is the last in the iteration
In order to render only by a known link type, you can use resourcesByLink instead.
{{alert.resourcesByLink}} section
{{alert.resourcesByLink}} sectionYou can access the unique resource specified by the link label. This has all the same fields except the iteration context fields isFirst and isLast.
{{#alert.resourcesByLink.User}}
Render this for user {{value}}
{{/alert.resourcesByLink.User}}
Updated 16 days ago