Prometheus Node Exporter
The Prometheus Node Exporter exposes a wide variety of hardware and kernel-related metrics that give visibility into important health and performance metrics related to CPU, Memory, Network, Disk Space, System Load, and more.
Use the Observe Node Exporter app to gain insight into your node health through those metrics. With this app, you can answer questions such as the following:
- Which nodes have usage spikes in the CPU?
- Are some of my nodes running out of memory or disk space?
- What is the network performance for my nodes?
View node performance in Observe
To see the health and performance of your nodes, after installing the app, go to the Instance dataset in Observe. This dataset models the nodes that are running the Node exporter in your environment, whether in a Kubernetes cluster or as a service on a standalone host. From this resource, you can filter to any number of node instances and use the following dashboards to get insight into their health and status.
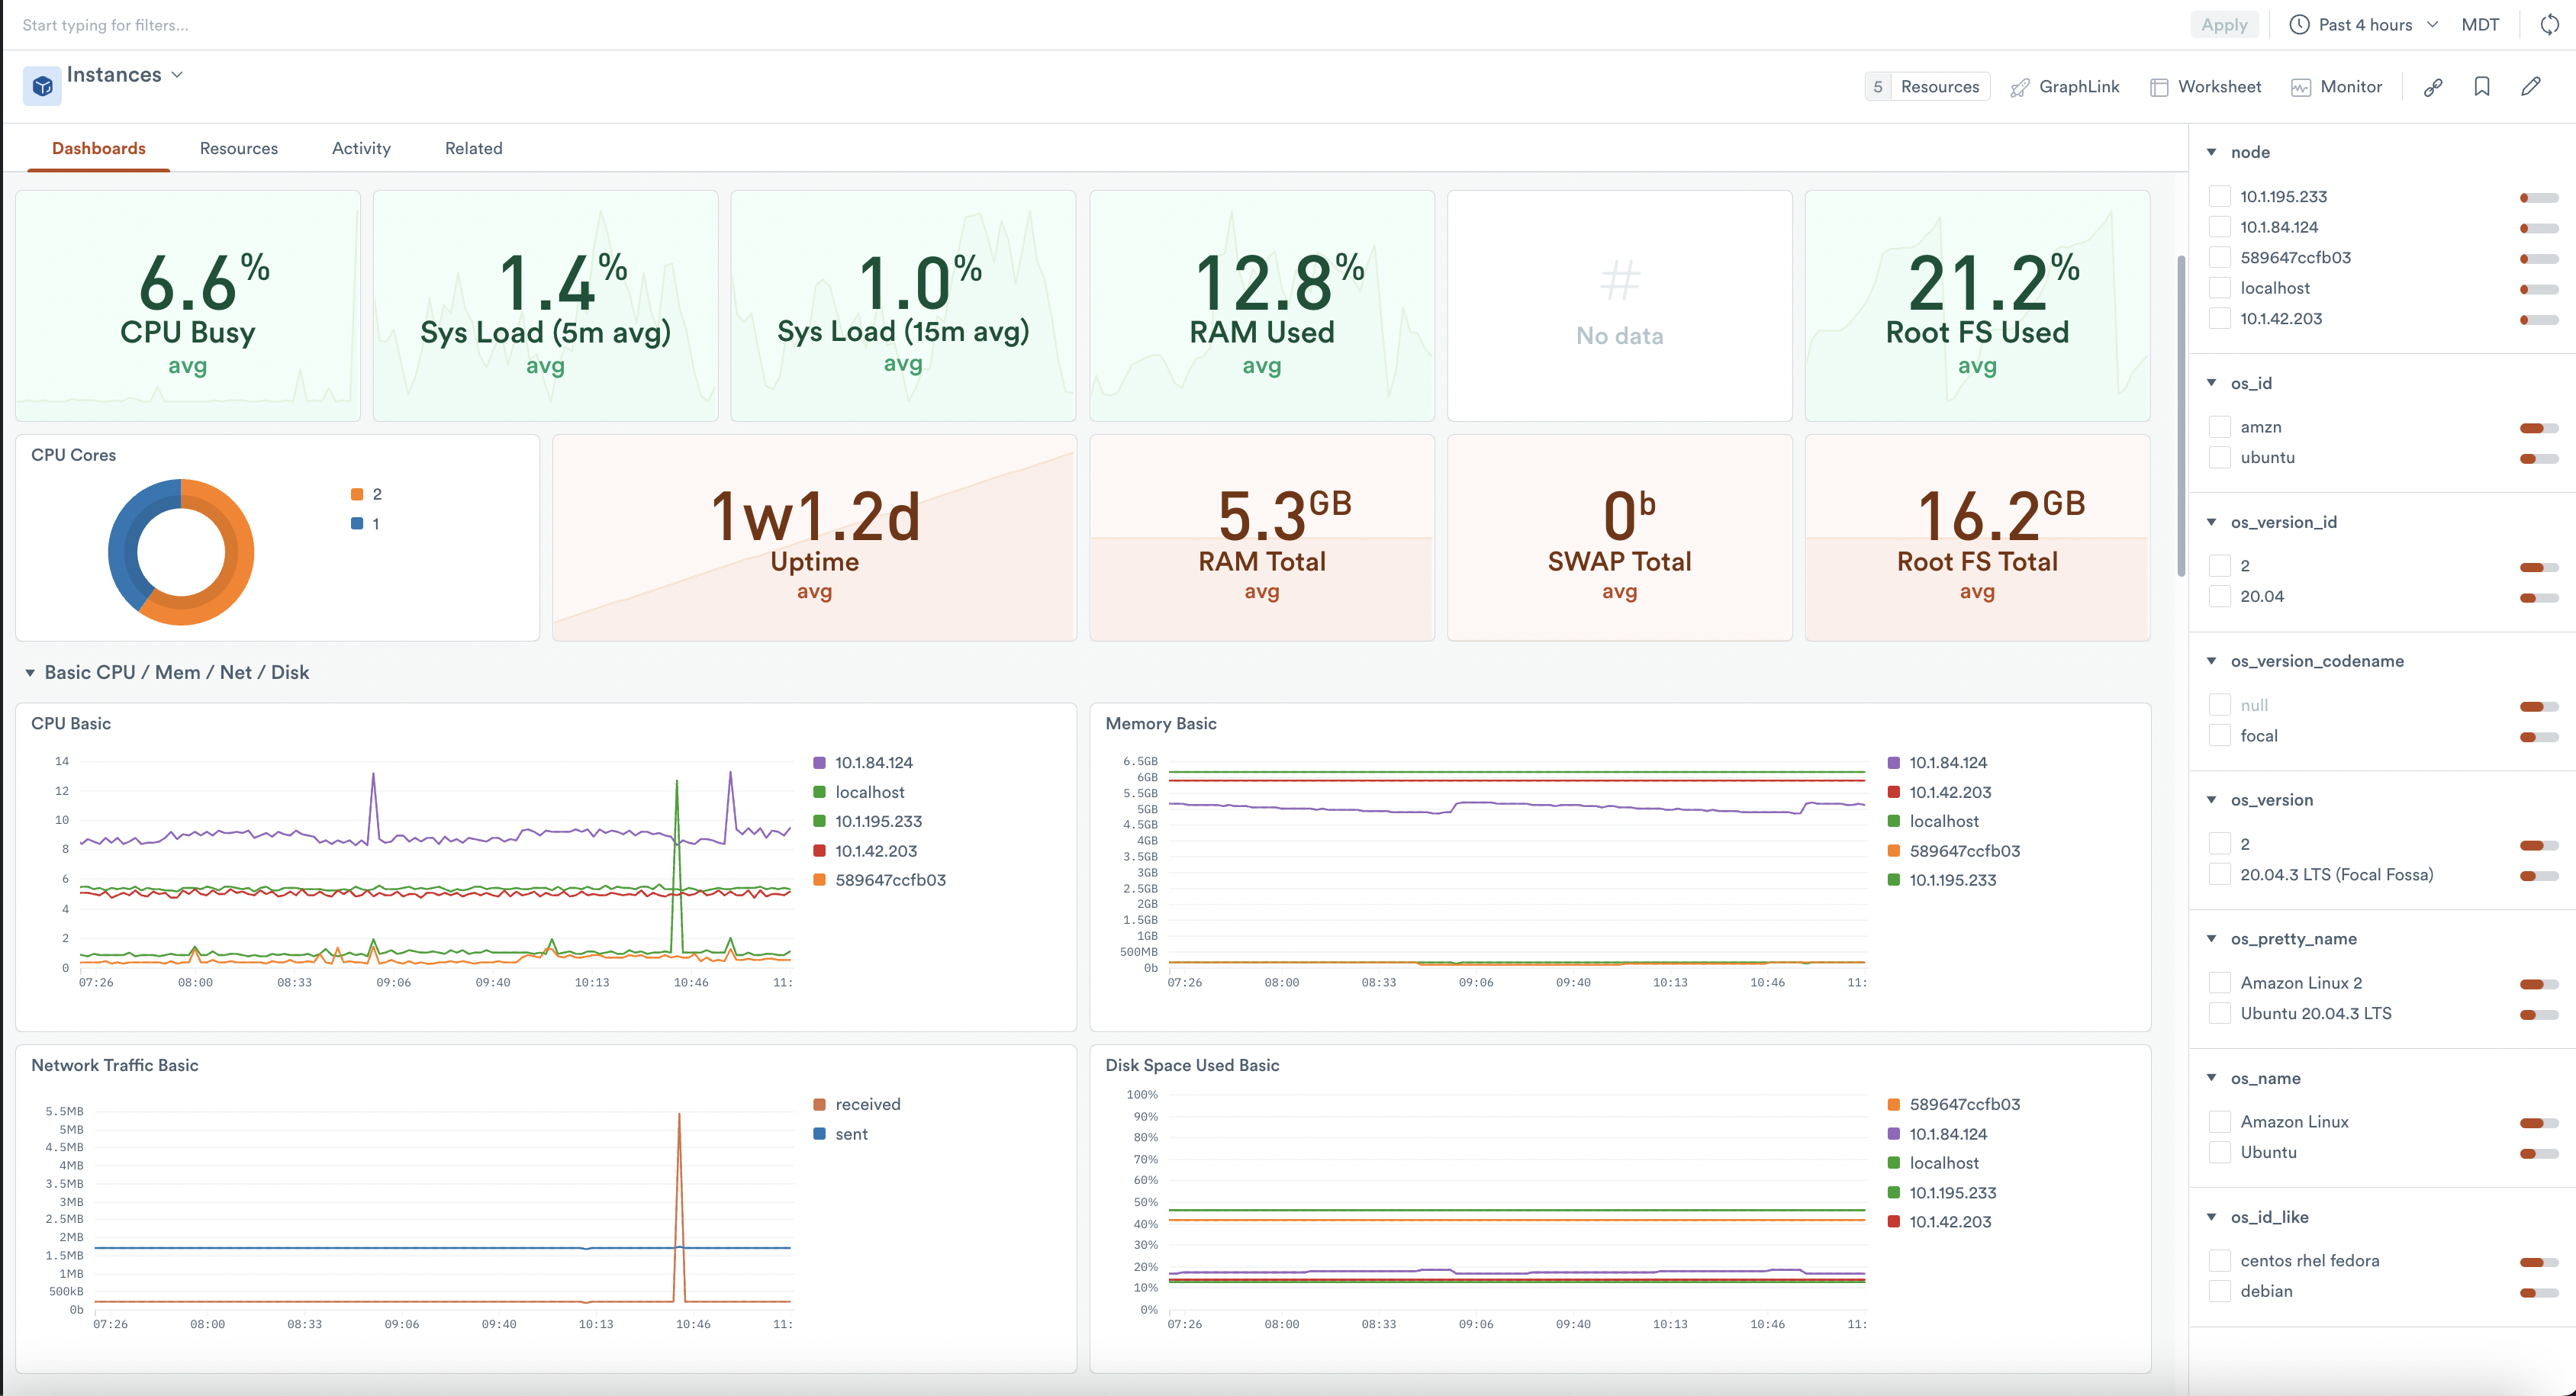
CPU / Mem / Net / Disk Overview dashboard
The CPU / Mem / Net / Disk Overview dashboard displays a high-level summary of the fundamental resources of your nodes, followed by two tiers of more detailed information. While you can select more than one node, each graph provides an aggregation of the nodes' data. When you filter to a specific node, the graphs provide more detailed information specific to the selected node.
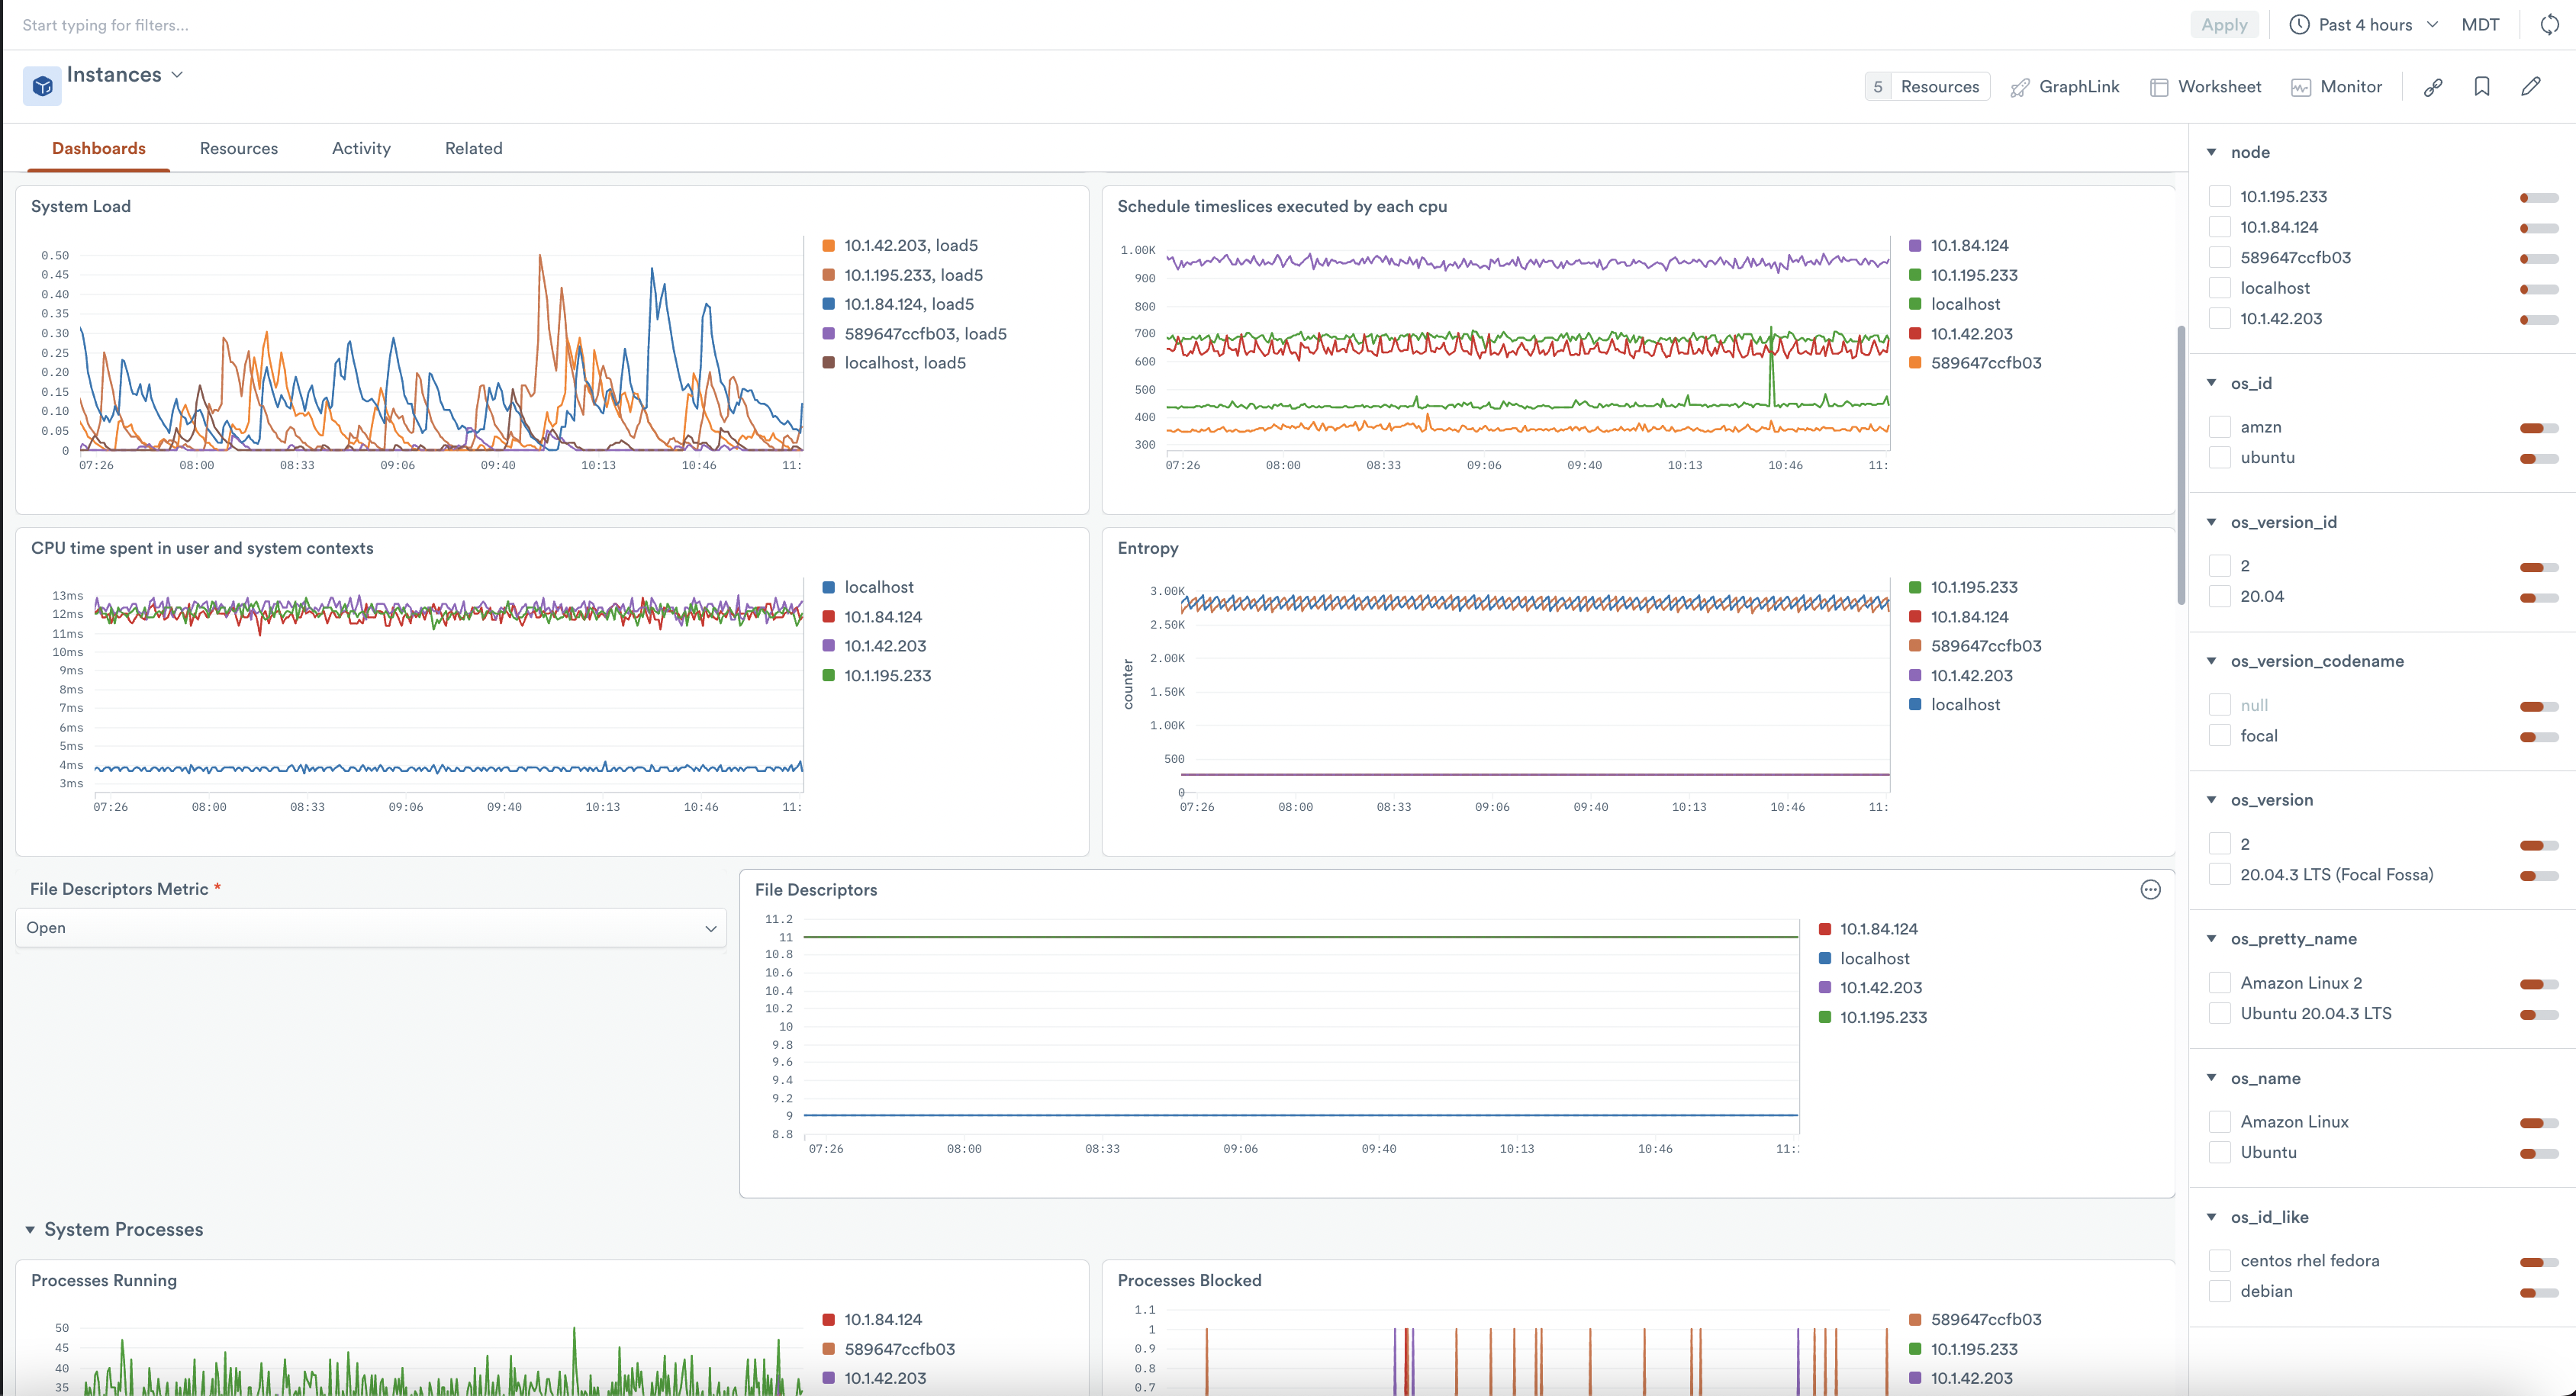
System Overview dashboard
The System Overview dashboard visualizes several groups of system-related metrics, including the following types:
- System Load
- Context switches, interrupts
- File descriptor counts and availability
- Count of system processes by state, thread-count, etc.
- Systemd sockets and unit states
- System timesync offsets
View an aggregation of this data across many nodes, or more detailed views when you filter to an individual node.
Setup
Configure Node Exporter
Use either the Prometheus Node Exporter or the Grafana Node Exporter integration to generate your Node Exporter metrics. The Observe app uses many of the metrics generated by the Node Exporter default collector configurations. The –collector.systemd and –collector.processes collectors are optional, but recommended, since a few graphs also use their metrics.
Push data to Observe
Whether you use the Prometheus or the Grafana agent, configure your remote-write to point to your Observe instance with the following configurations:
Prometheus prometheus.yml
prometheus.ymlremote_write:
- url: https://${OBSERVE_CUSTOMER?}.collect.${OBSERVE_DOMAIN?}/v1/prometheus
bearer_token: ${OBSERVE_TOKEN?}
remote_timeout: "30s"
queue_config:
min_backoff: "1s"
max_backoff: "30s"
max_shards: 20
max_samples_per_send: 5000
capacity: 15000
retry_on_http_429: trueFor more information about collecting Prometheus metrics in your Observe account, see the Prometheus Forwarder docs .
Grafana agent.yaml
agent.yamlremote_write:
- url: https://${OBSERVE_CUSTOMER?}.collect.${OBSERVE_DOMAIN?}/v1/prometheus
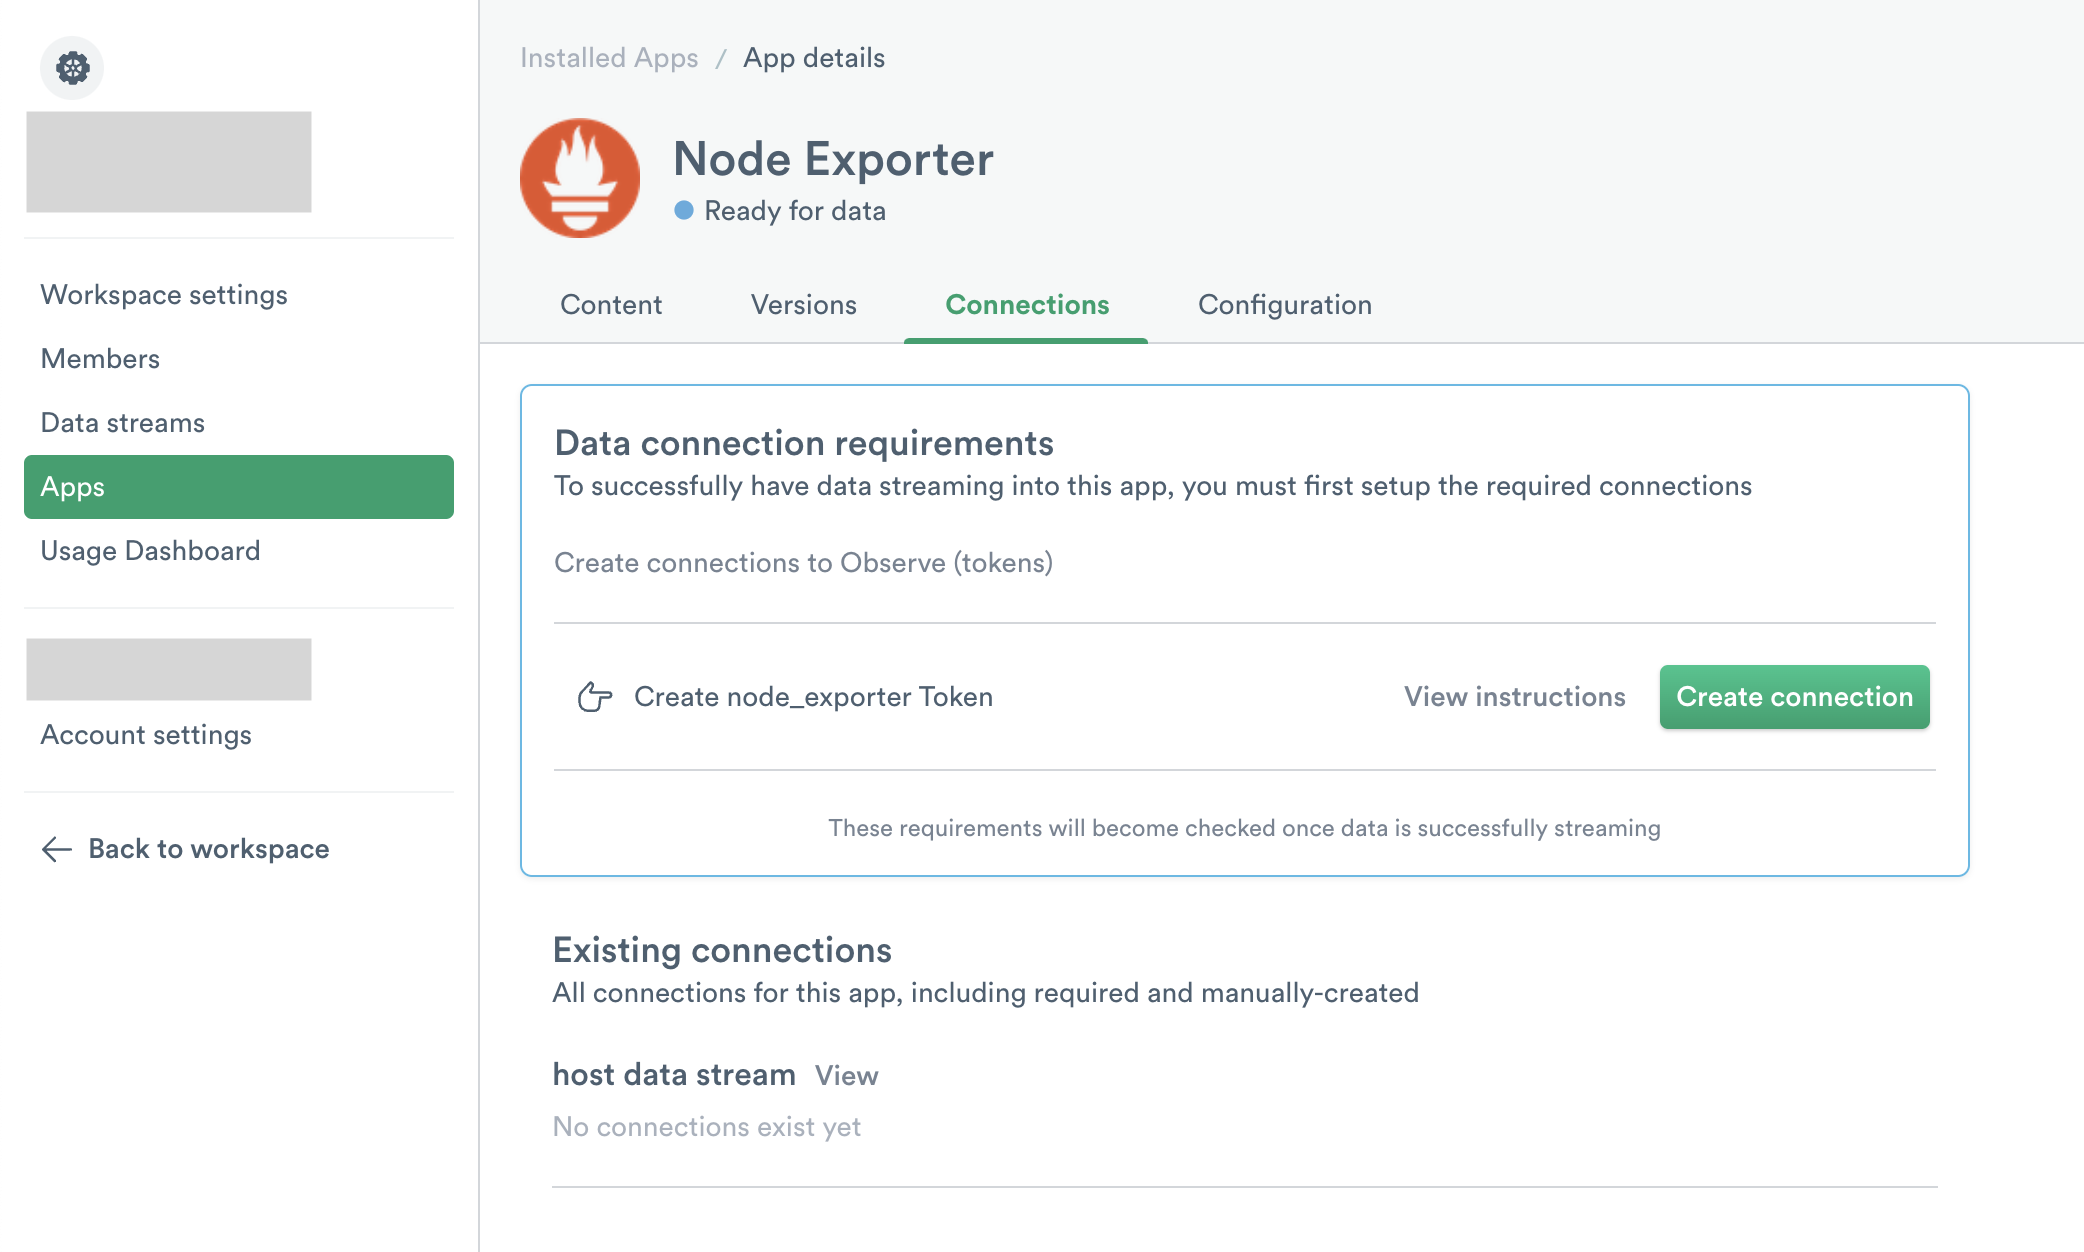
bearer_token: ${OBSERVE_TOKEN?}Install the Observe App for Node Exporter
NoteThis setup follows the same procedure as creating a data connection in the Node Exporter app. If you have already created a data connection in the app, you do not need to perform these steps again.
Follow the instructions in Observe apps to install the Node Explorer app.
The default configuration settings of the app may be sufficient for your team needs, but you should consider overwriting the defaults for the following options:
- Datastream - select the datastream receiving your Node Exporter metrics
- Jobs - By default, the installation includes both "node" and "integrations/node_exporter", because Prometheus and Grafana set their node exporter job values by default. But your node exporter job(s) differ, you can overwrite this list with the values appropriate for your environment.
- Name Format - The default value of
prometheus/%splaces your Node Exporter resources within theprometheusfolder, but you may want to place them in a different folder.
Uninstall Node Exporter
Uninstall the Node Exporter App
Follow the instructions in Observe apps to uninstall the Node Explorer app.
Delete the associated Observe token as well.
Uninstall the Node Exporter collector
To uninstall the collector for your Prometheus agent, simply remove the following in your Prometheus configuration YAML file. You may have to restart Prometheus for changes to take effect, depending on your configuration.
Prometheus prometheus.yml
prometheus.ymlremote_write:
- url: https://${OBSERVE_CUSTOMER?}.collect.${OBSERVE_DOMAIN?}/v1/prometheus
bearer_token: ${OBSERVE_TOKEN?}
remote_timeout: "30s"
queue_config:
min_backoff: "1s"
max_backoff: "30s"
max_shards: 20
max_samples_per_send: 5000
capacity: 15000
retry_on_http_429: trueTo uninstall the Grafana agent collector, remove the following from your Grafana configuration YAML file. You may have to restart Grafana for changes to take effect, depending on your configuration.
Grafana agent.yaml
agent.yamlremote_write:
- url: https://${OBSERVE_CUSTOMER?}.collect.${OBSERVE_DOMAIN?}/v1/prometheus
bearer_token: ${OBSERVE_TOKEN?}Updated 6 months ago