Send Ruby application data to Observe
This page describes how to install the Observe Agent, then instrument your Ruby applications to send data to Observe.
To view the list of auto-instrumented libraries and compatible versions, see opentelemetry-instrumentation-all.gemspec in the OpenTelemetry documentation on GitHub.
To manually instrument custom logic, see Instrumentation for Ruby in the OpenTelemetry documentation.
Get the Observe Agent
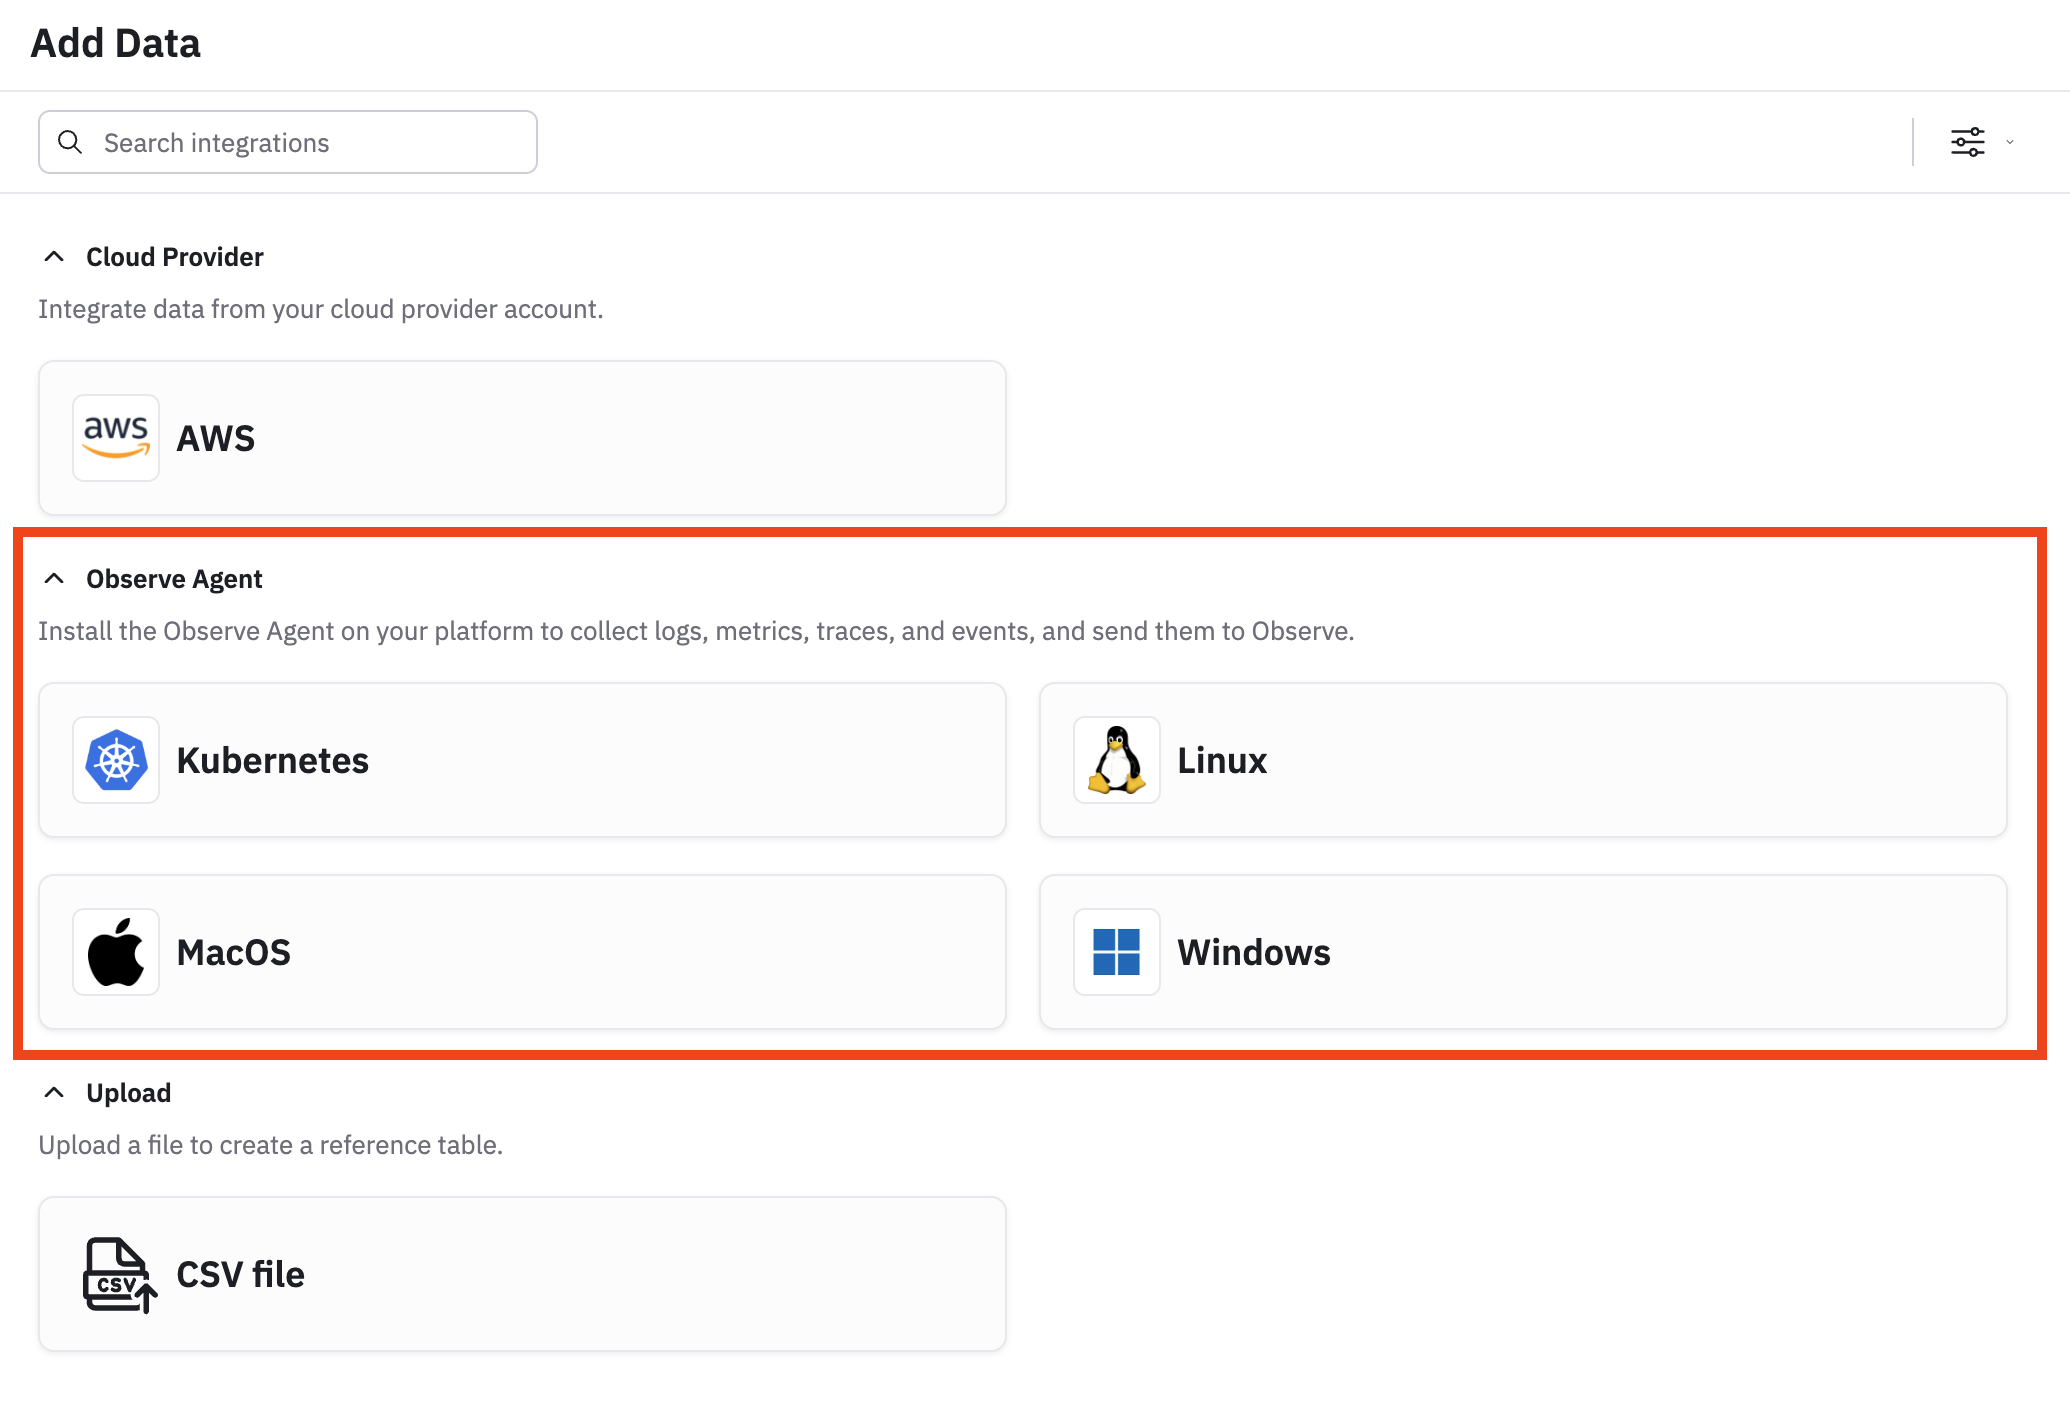
Use the Add Data portal in the product to get the Observe Agent installed in your environment.
- From the left navigation rail, select Data & integrations > Add data.
- In the Observe Agent section, pick your environment, then follow the instructions to create a data ingest token and install the Observe Agent.
Add the OpenTelemetry auto-instrumentation for Ruby
First, acquire the dependencies:
bundle add opentelemetry-sdk \
opentelemetry-instrumentation-all \
opentelemetry-exporter-otlp
Now initialize the instrumentation. For a Rails application, create a file named config/initializers/opentelemetry.rb with the following code:
# config/initializers/opentelemetry.rb
require 'opentelemetry/sdk'
require 'opentelemetry/instrumentation/all'
require 'opentelemetry-exporter-otlp'
OpenTelemetry::SDK.configure do |c|
  c.use_all() # enables all instrumentation!
end
For other types of Ruby services (not Rails), perform this initialization as early as possible in the start-up process.
Configure the Ruby instrumentation
Set the following environment variables. Replace the placeholders such as ${YOUR_SERVICE_NAME} with the actual information from your environment.
OTEL_SERVICE_NAME=${YOUR_SERVICE_NAME}
OTEL_RESOURCE_ATTRIBUTES=deployment.environment=${YOUR_APP_ENVIRONMENT}
OTEL_EXPORTER_OTLP_ENDPOINT=http://${YOUR_OBSERVE_AGENT_ENDPOINT}:4318
(Optional) Name GraphQL endpoints by operation
By default, the instrumentation discovers a single GraphQL endpoint, named GraphqlController#execute.
If you're using GraphQL and Rack with Ruby, want more detailed GraphQL endpoint names, use this during initialization of the OpenTelemetry SDK:
c.use_all('OpenTelemetry::Instrumentation::GraphQL' => {
    enable_platform_field: true,
    enable_platform_authorized: true,
    enable_platform_resolve_type: true,
    legacy_platform_span_names:true,
    legacy_tracing: true
    })
Then add this code in your Rack controller:
rack_span = OpenTelemetry::Trace.current_span
rack_span.name = <your preferred span name>
Example code to name the span according to the GraphQL operation:
def transaction_name(query)
selected_op = query.selected_operation
txn_name = if selected_op
    op_type = selected_op.operation_type
    op_name = selected_op.name || fallback_transaction_name(query.context) || "anonymous"
    "#{op_type}.#{op_name}"
else
    "query.anonymous"
end
"GraphQL/#{txn_name}"
end
(Optional) Name Sidekiq endpoints by class
By default, the instrumentation names Sidekiq endpoints by operation name and destination.
To instead identify Sidekiq endpoints by job class, use this during initialization of the OpenTelemetry SDK:
c.use_all('OpenTelemetry::Instrumentation::Sidekiq' => {
    span_naming: :job_class
    })
Run your instrumented app
Run the following command:
rails server -p 8080Next steps
Navigate to Traces in your Observe tenant to view traces from your application.
- Use Trace Explorer to find traces in your environment.
- Use service management to view your services and their dependencies.
- Monitor and track new deployments on your service.
- View logs associated with a trace.
- Use the APM reference to see what data is collected by APM.
Updated about 2 months ago