Service Level Objectives (SLO)
Service Level Objectives (SLOs) provide targets for key Service Level Indicators (SLIs) that measure the health of your services in critical ways. SLOs provide a framework that allows you to define clear targets around application performance and helps you provide a consistent experience for your customers.
Use the Observe SLO app to get out-of-the-box insight into the overall uptime of all your SLOs. This app helps you answer questions such as:
- What is the average SLO value for all or some of my SLOs over time?
- How many of my SLOs are failing for a given SLO target?
- For a given SLO target, what kind of error budget do I have available for my SLOs before they fail?
The SLO app installs the following datasets by default:
- Monitor SLO Resource Dataset
- Monitor SLO Metrics
The SLO app also installs two Monitor templates to help you get started with monitoring:
- (TEMPLATE) SLO/99.5% SLO Budget minutes are low - sends alerts when your SLO budget minutes run low.
- (TEMPLATE) SLO/SLO Failure - sends alerts when your SLO fails.
Install the Service Level Objectives (SLO) app
Follow the instructions in Observe apps to install the Service Level Objectives (SLO) app.
The default configuration settings of the Service Level Objectives (SLO) app may be sufficient for your needs, but you should consider overwriting the defaults for the following options:
- Name Format - The default value of
SLO/%splaces your SLO resources within theSLOfolder, but you may want to put them in a different folder. - SLO Timeframe Days - The number of days over which to calculate your SLOs, e.g, '7', '15', 30', etc. You can add multiple timeframes, although more timeframes increase the usage-based cost of the app.
- Default SLO Target - The default value to use in dashboards and monitor templates for your SLO target. This can always be updated in individual dashboards as you create monitors. This is a float number between 0 and 100 that represents the target uptime percentage for your SLOs.
Create new SLOs
Once you install the SLO app, and you want to add new SLOs, simply create a new monitor. Within an hour, you then see the new SLO appear in your SLO Summary and Status Dashboards, and you can graph the monitor_slo metric for your new SLO in the Metric Explorer and custom Dashboards.
The SLO app uses the notification data from Observe Monitors, so you do not need to take additional steps beyond creating monitors.
View your SLO performance in Observe
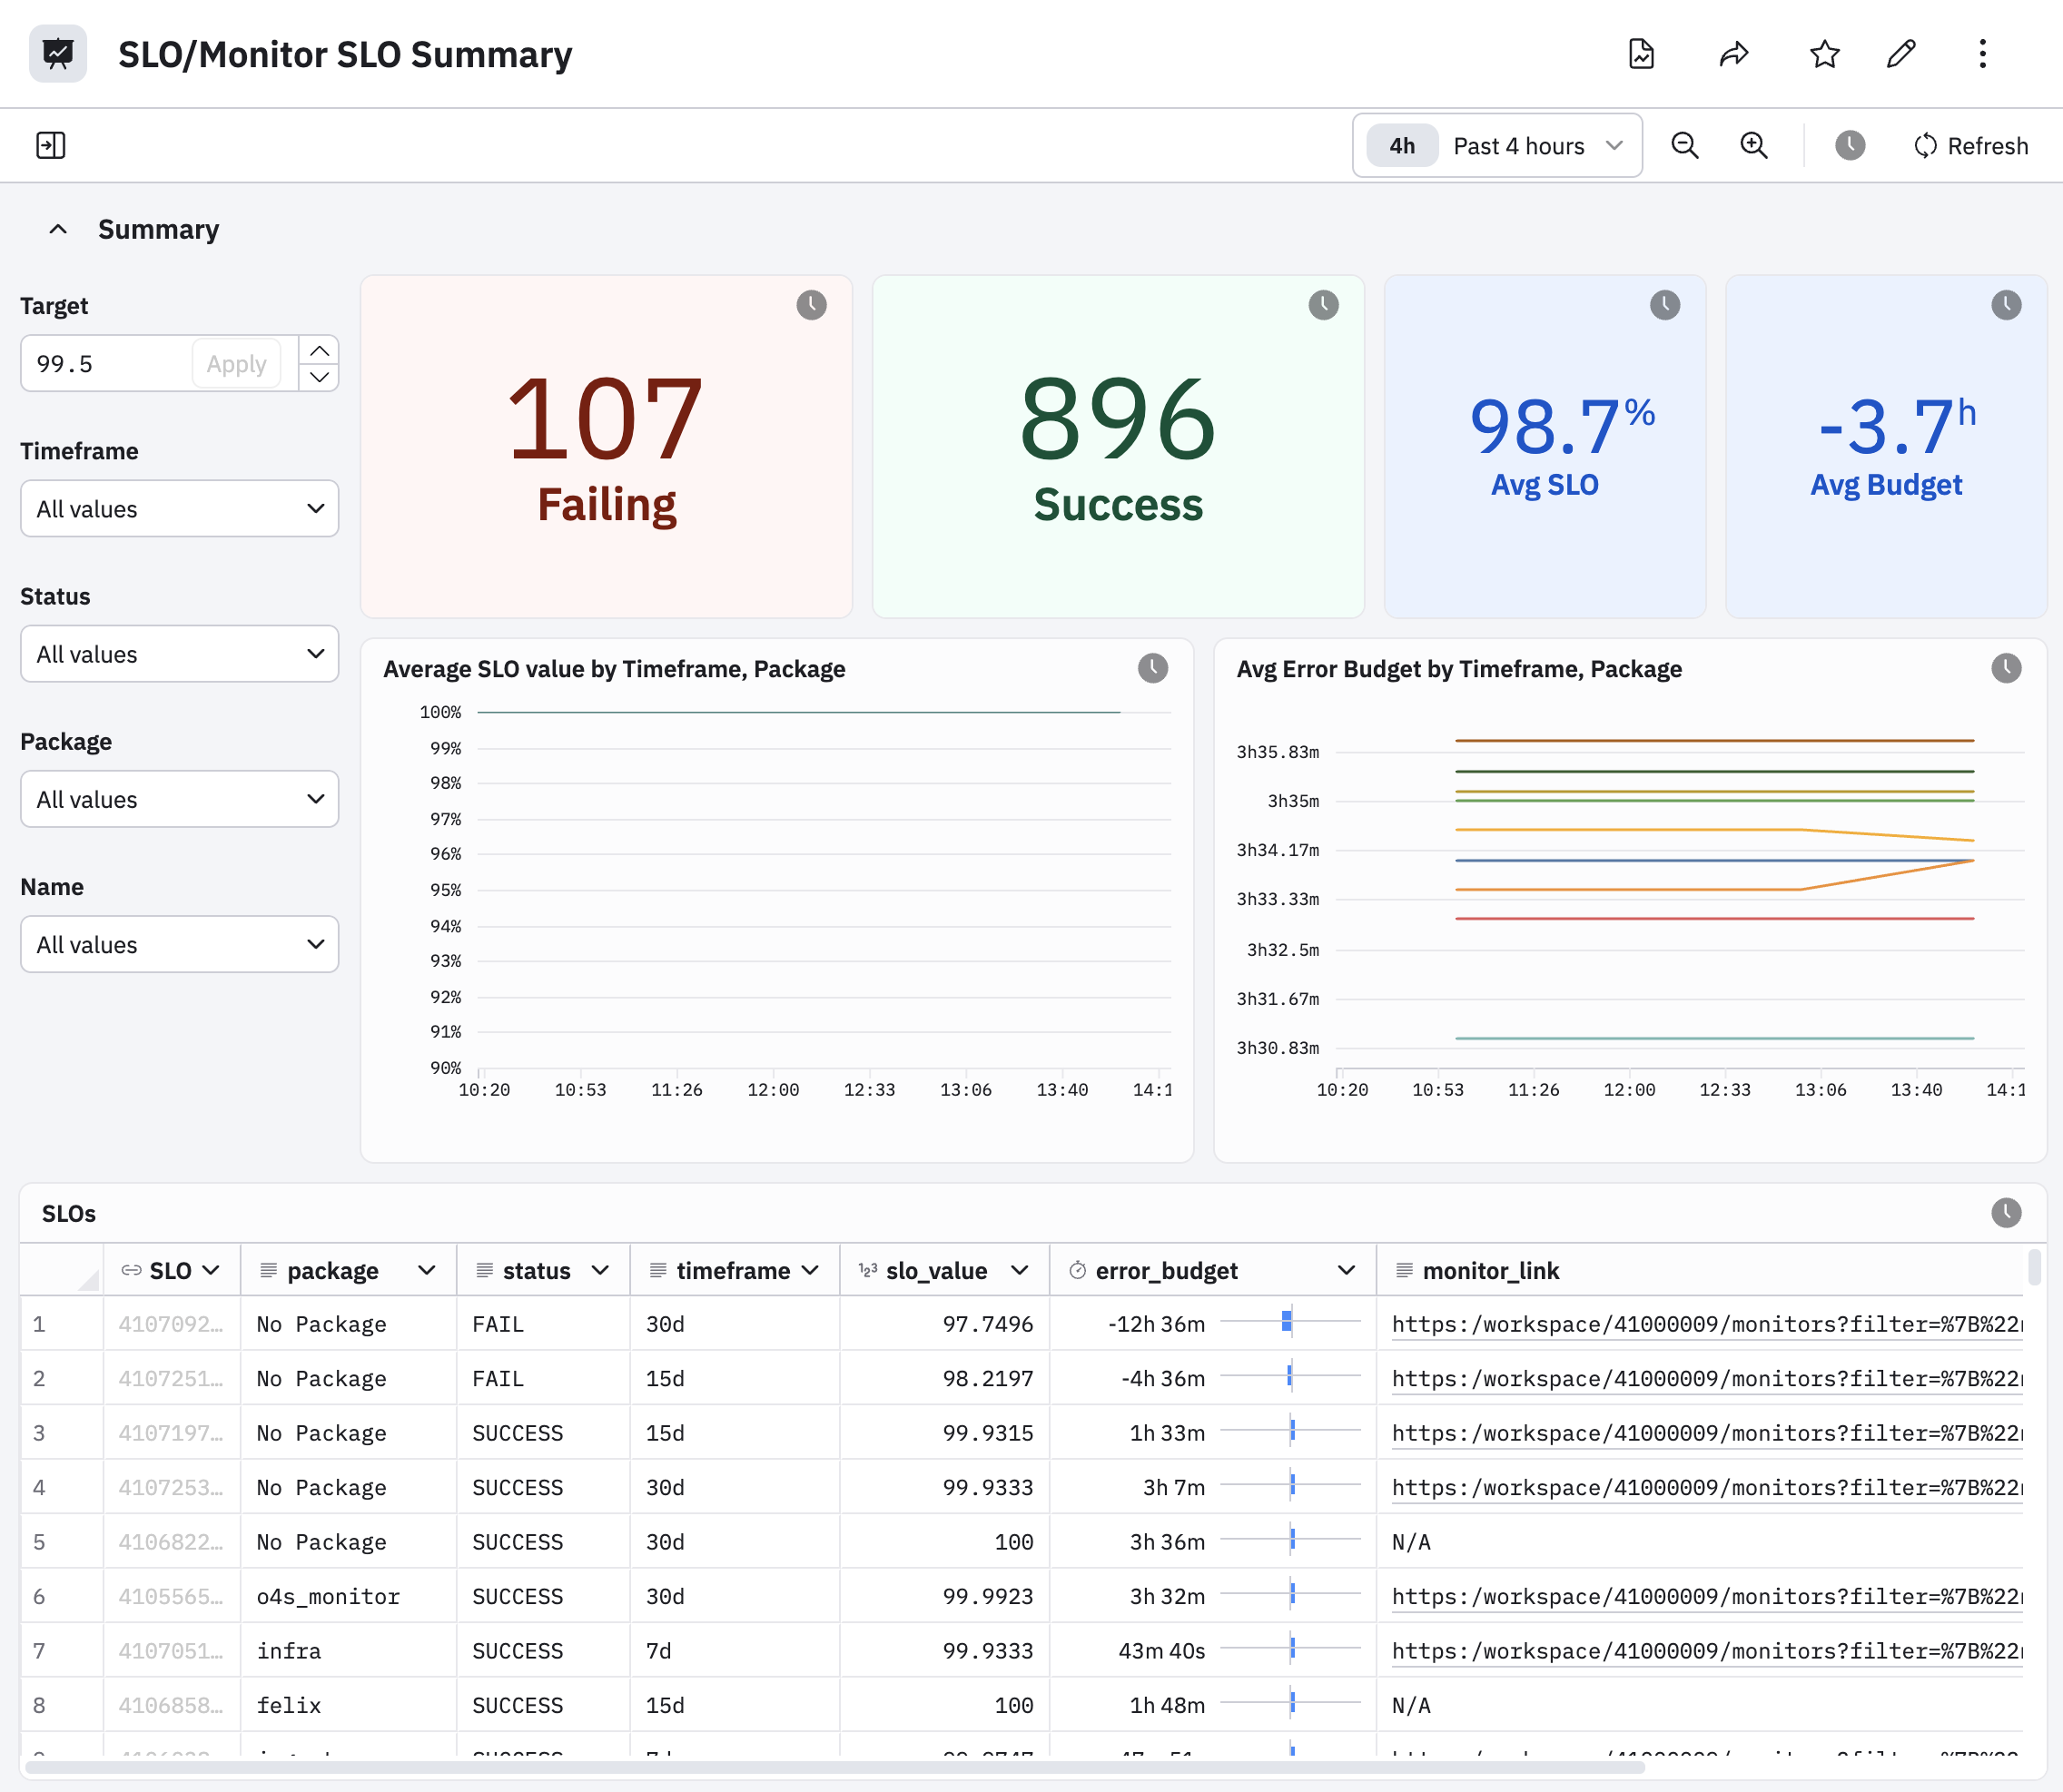
SLO Summary Dashboard
After installing the app, view a summary of the health of all your SLOs by going to the SLO Summary dashboard in Observe. This dashboard summarizes the average SLO value and error budget across all your SLOs, grouped by timeframe and by package, as well as lists out your SLOs and their current status. Use this dashboard to track the count of SLOs failing on a given SLO target, and to jump to the SLO Status dashboard of specific SLO instances.
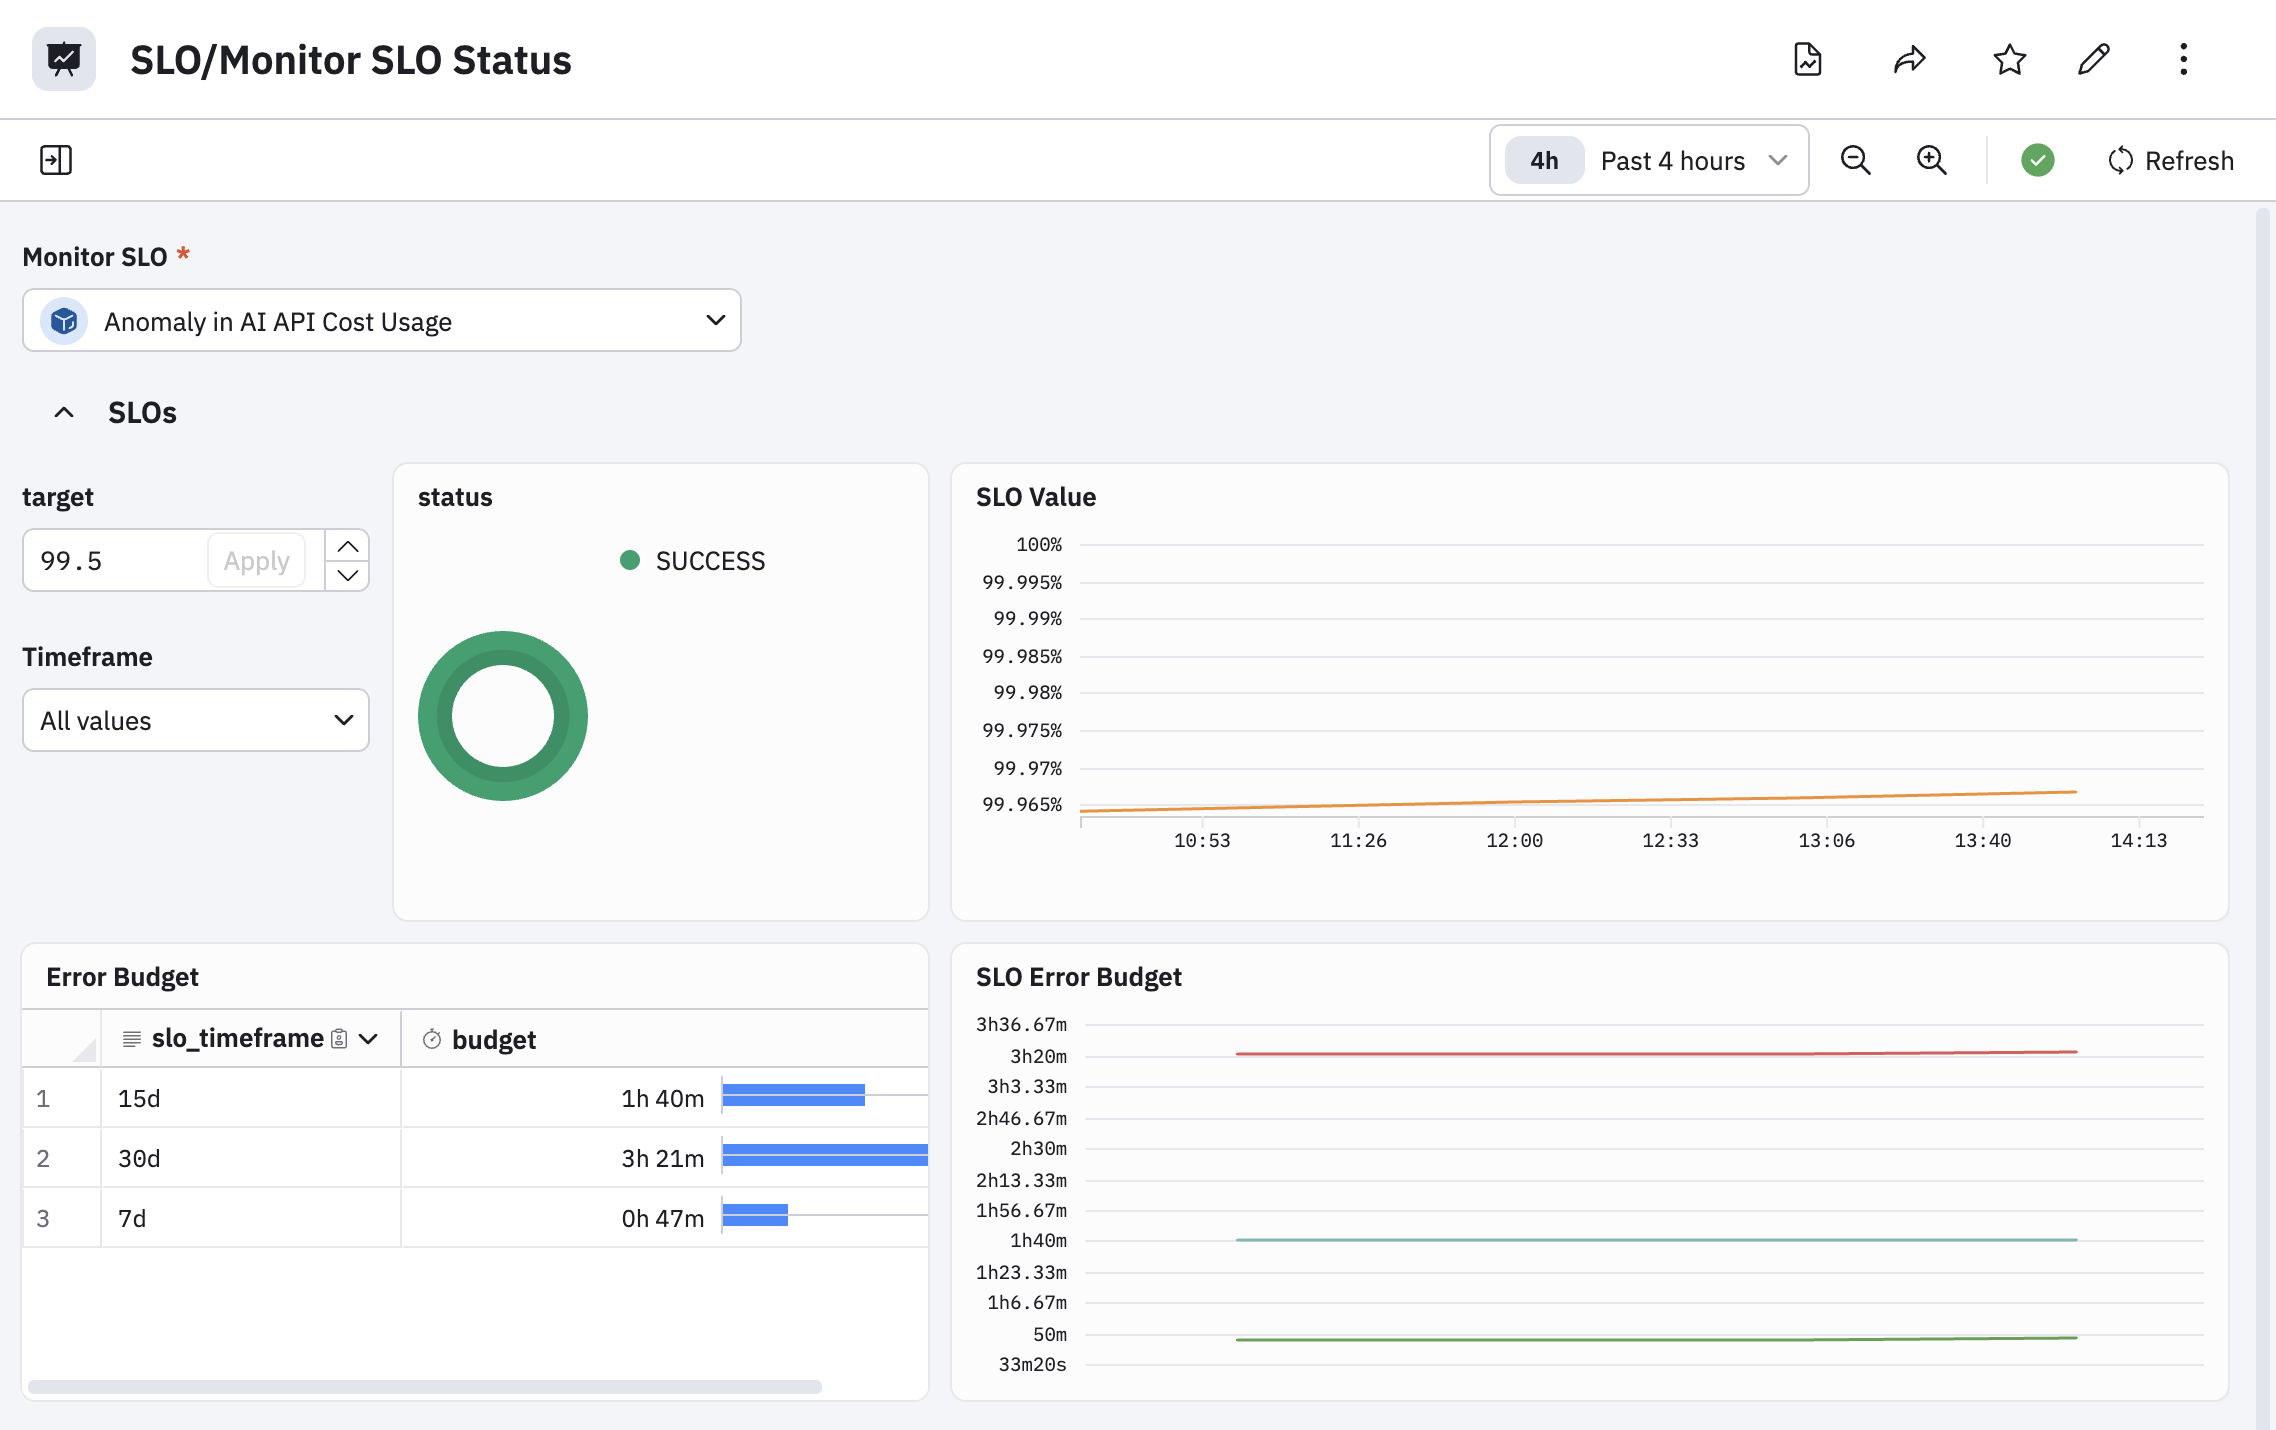
SLO Status Dashboard
The SLO Status dashboard shows you the Status, SLO Value, and Error Budget for a specific SLO and each timeframe. From that Dashboard, you can also view the alert notification intervals that reduced the SLO value, and you can follow links to the Observe Monitor for the SLO.
Alerting on SLO performance in Observe
After installing the app, you can receive alerts from Observe when any SLO value drops below a given threshold by using the SLO Failure monitor template. When using this template, Observe recommends the following:
- Filter to the subset of SLOs you want to receive alerts by
name,package,slo_timeframe, or all three. - Set the threshold of the monitor as the SLO target you wish to alert on.
You can receive alerts by Observe when any SLO error budget falls below a given number of minutes by using the SLO Budget minutes are low monitor template. When using this template, Observe recommends the following:
- Filter to the subset of SLOs you want to receive alerts by
name,package,slo_timeframe, or all three. - Update the monitor
targetcolumn with the SLO target you want to budget. - Set a threshold for how many minutes of remaining budget you want to receive alerts.
Calculating SLOs
The Observe SLO app calculates an SLO by checking the health of the underlying monitor in roughly 10,000 intervals over the course of the SLO timeframe. The SLO value consists of the ratio of successful intervals over total intervals in the SLO timeframe. For 7 day SLO timeframes, the health-check interval occurs every 1 minute. For SLOs with larger timeframes, the health-check interval grows proportionally to the SLO timeframe, For instance, 14 day SLOs have a health-check interval of 2 minutes, 28 day SLOs have intervals of 3 minutes, and so forth.
NoteYou can force your SLO metrics to use a 1m interval regardless of how large their timeframe by adding the
force_1m_intervalfeature flag to your Observe SLO App. However, this makes the datasets and dashboards of the SLO App more expensive.
Updated about 2 months ago