Tune service resource requests and limits
When deploying the Observe Agent using the Helm chart, you can customize the CPU and memory resources allocated to each component. This allows you to optimize resource usage based on your cluster's capacity and the specific needs of your environment.
Identify current usage
By default, the services instantiated by the Observe Agent Helm Chart are provisioned to fit expected workflows: up to 300m of CPU and 512Mi of memory for some pods but less for others (see the default values below). These are the minimum default values that we recommend. Since estimating resource consumption is difficult and varies widely based on the properties of your Kubernetes cluster and applications instrumented, it's recommended to instead first install the Helm chart and then examine the current resource consumption and tune based on that. To find your current usage, you can utilize the K8s Explorer. To do so, navigate to the corresponding Workload page for each of the deployments and daemonsets created by the Observe Agent Helm Chart. Specifically, the services to look at are:
Daemonsets:
observe-node-logs-metrics-agentobserve-forwarder-agent
Deployments:
observe-cluster-eventsobserve-cluster-metricsobserve-agent-gatewayobserve-prometheus-scraperobserve-agent-monitor
For each of the services, select a pod to examine that has the highest CPU and memory utilization. Using the charts on the Pod page, determine the peak current CPU and memory utilization over the last week. Based on those values, we recommend the following settings.
resources:
  requests:
    cpu: 1.25 * ${MAX_CPU_USAGE}
    memory: 1.25 * ${MAX_MEMORY_USAGE}
  limits:
    memory: 1.25 * ${MAX_MEMORY_USAGE}
Example pod resource utilization
Let's take a look at a real world example of a pod in the K8s Explorer Pod view and how we can use that to determine the appropriate resource requests and limits.
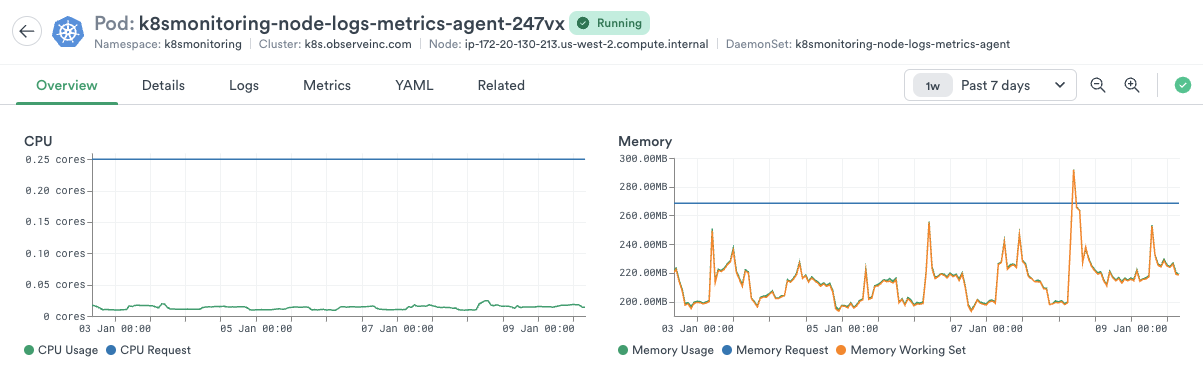
For the example pod above, we can see that the CPU utilization averages around 20m. Since this is below the minimum value of 250m, we'll keep that as the value for the CPU request. For memory, we can see that the memory utilization averages around 220Mi but spikes up to 300Mi. In order for us to provide a healthy overhead, we'll set the memory request limit to 375Mi. So, our new values based on the above pod view would be
resources:
  requests:
    cpu: 250m
    memory: 375Mi
  limits:
    memory: 375Mi
Estimate resource requirements by data rate
We performed benchmarking tests to arrive at resource recommendations based on data ingest rates. All recommendations below are based off of testing performed on a 10 node kubernetes cluster. All data rates are at the cluster-wide level.
NoteIn the following tables, the † icon means the resources necessary for cluster metrics can vary greatly based on your applications' various uses of Prometheus metrics. We recommend that sizing for this deployment be verified and tuned to your individual usage patterns if your pods are exposing large amounts of Prometheus metrics.
100 DPS
This scenario is based on ingesting 100 logs per second (each 1KiB), 100 instrumented app metrics per second, 100 spans per second, and an application with around 25 active pods.
| Service | CPU Request | Memory Request | Memory Limit |
|---|---|---|---|
cluster-events | 100m | 128Mi | 128Mi |
cluster-metrics | 100m | 128Mi | 128Mi |
prometheus-scraper† | 100m | 128Mi | 128Mi |
forwarder | 100m | 128Mi | 128Mi |
gateway | 100m | 256Mi | 256Mi |
monitor | 100m | 128Mi | 128Mi |
node-logs-metrics | 100m | 128Mi | 128Mi |
1,000 DPS
This scenario is based on ingesting 1000 logs per second (each 1KiB), 1000 instrumented app metrics per second, 1000 spans per second, and an application with around 250 active pods.
| Service | CPU Request | Memory Request | Memory Limit |
|---|---|---|---|
cluster-events | 100m | 128Mi | 128Mi |
cluster-metrics | 100m | 128Mi | 128Mi |
prometheus-scraper | 100m | 128Mi | 128Mi |
forwarder | 100m | 128Mi | 128Mi |
gateway | 100m | 256Mi | 256Mi |
monitor | 100m | 128Mi | 128Mi |
node-logs-metrics | 100m | 384Mi | 384Mi |
10,000 DPS
This scenario is based on ingesting 10k logs per second (each 1KiB), 10k instrumented app metrics per second, 10k spans per second, and an application with around 500 active pods.
These are the default values in our Helm chart.
| Service | CPU Request | Memory Request | Memory Limit |
|---|---|---|---|
cluster-events | 100m | 128Mi | 128Mi |
cluster-metrics | 100m | 256Mi | 256Mi |
prometheus-scraper | 100m | 256Mi | 256Mi |
forwarder | 300m | 512Mi | 512Mi |
gateway | 300m | 768Mi | 768Mi |
monitor | 100m | 128Mi | 128Mi |
node-logs-metrics | 200m | 512Mi | 512Mi |
Modify resource allocations
If the calculated values are lower than the default of 250m for CPU and 256Mi for memory, then use the default values. The resource requests and limits might be different for each of the services and should be tuned individually. These can be set in the values.yaml file for each of the services.
| Service | SERVICE_NAME |
|---|---|
observe-node-logs-metrics-agent | node-logs-metrics |
observe-forwarder-agent | forwarder |
observe-cluster-events | cluster-events |
observe-cluster-metrics | cluster-metrics |
observe-prometheus-scraper | prometheus-scraper |
observe-agent-monitor | monitor |
${SERVICE_NAME}:
  resources:
    requests:
      cpu: 250m
      memory: 256Mi
    limits:
      memory: 256Mi
Apply the new resource configurations
- Run the following command to redeploy the Observe Agent in the
observenamespace with the new resource configuration.helm upgrade --reset-values observe-agent observe/agent -n observe --values values.yaml - Run the following commands to restart the pods with the updated configuration.
kubectl rollout restart deployment -n observe kubectl rollout restart daemonset -n observe - Run the following command to make sure the Observe Agent has been redeployed successfully.
kubectl get pods -o wide -n observe
Updated 4 months ago