How do I measure drift in a metric over time?
Using the timeshift OPAL verb, you can calculate the deltas between points in time for use in anomaly detection. See How can I make a standard deviation anomaly detection monitor?
Here's an example of making a metric from a series of service requests and comparing week-over-week values:
Open the resulting metric in Metrics Explorer and use the expression builder to compare ajax_web-request_count against ajax_web_request_baseline.
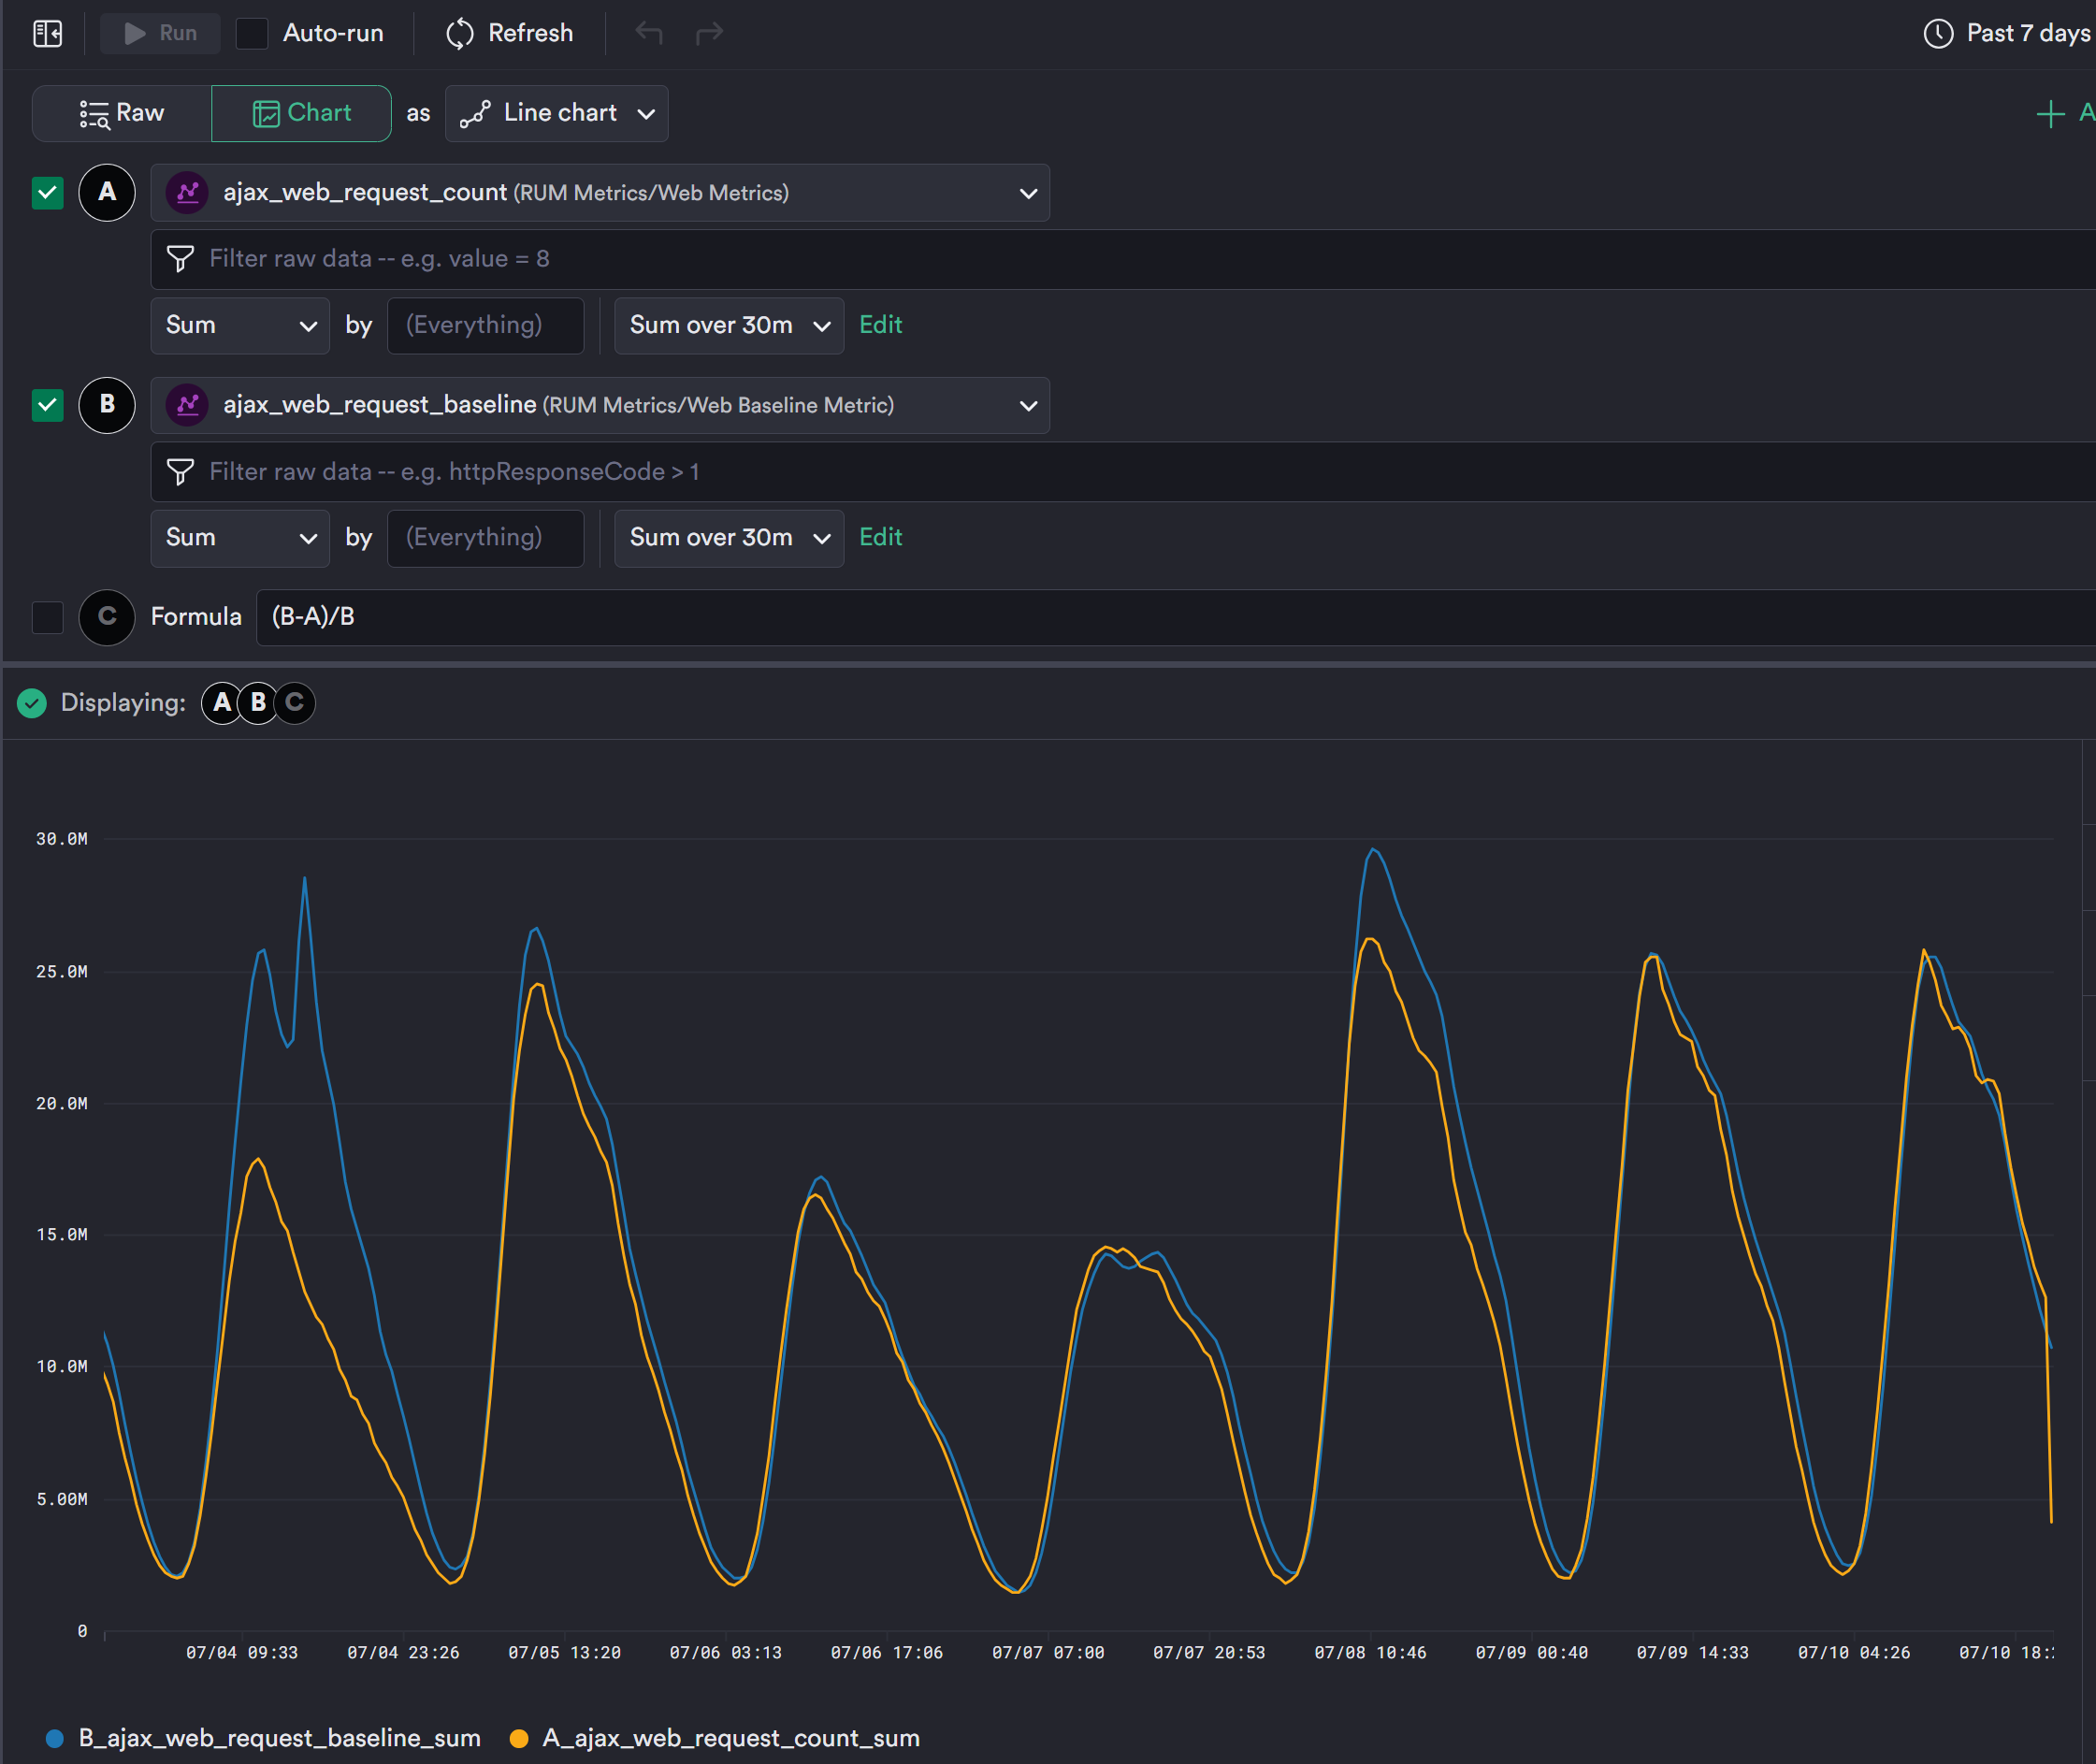
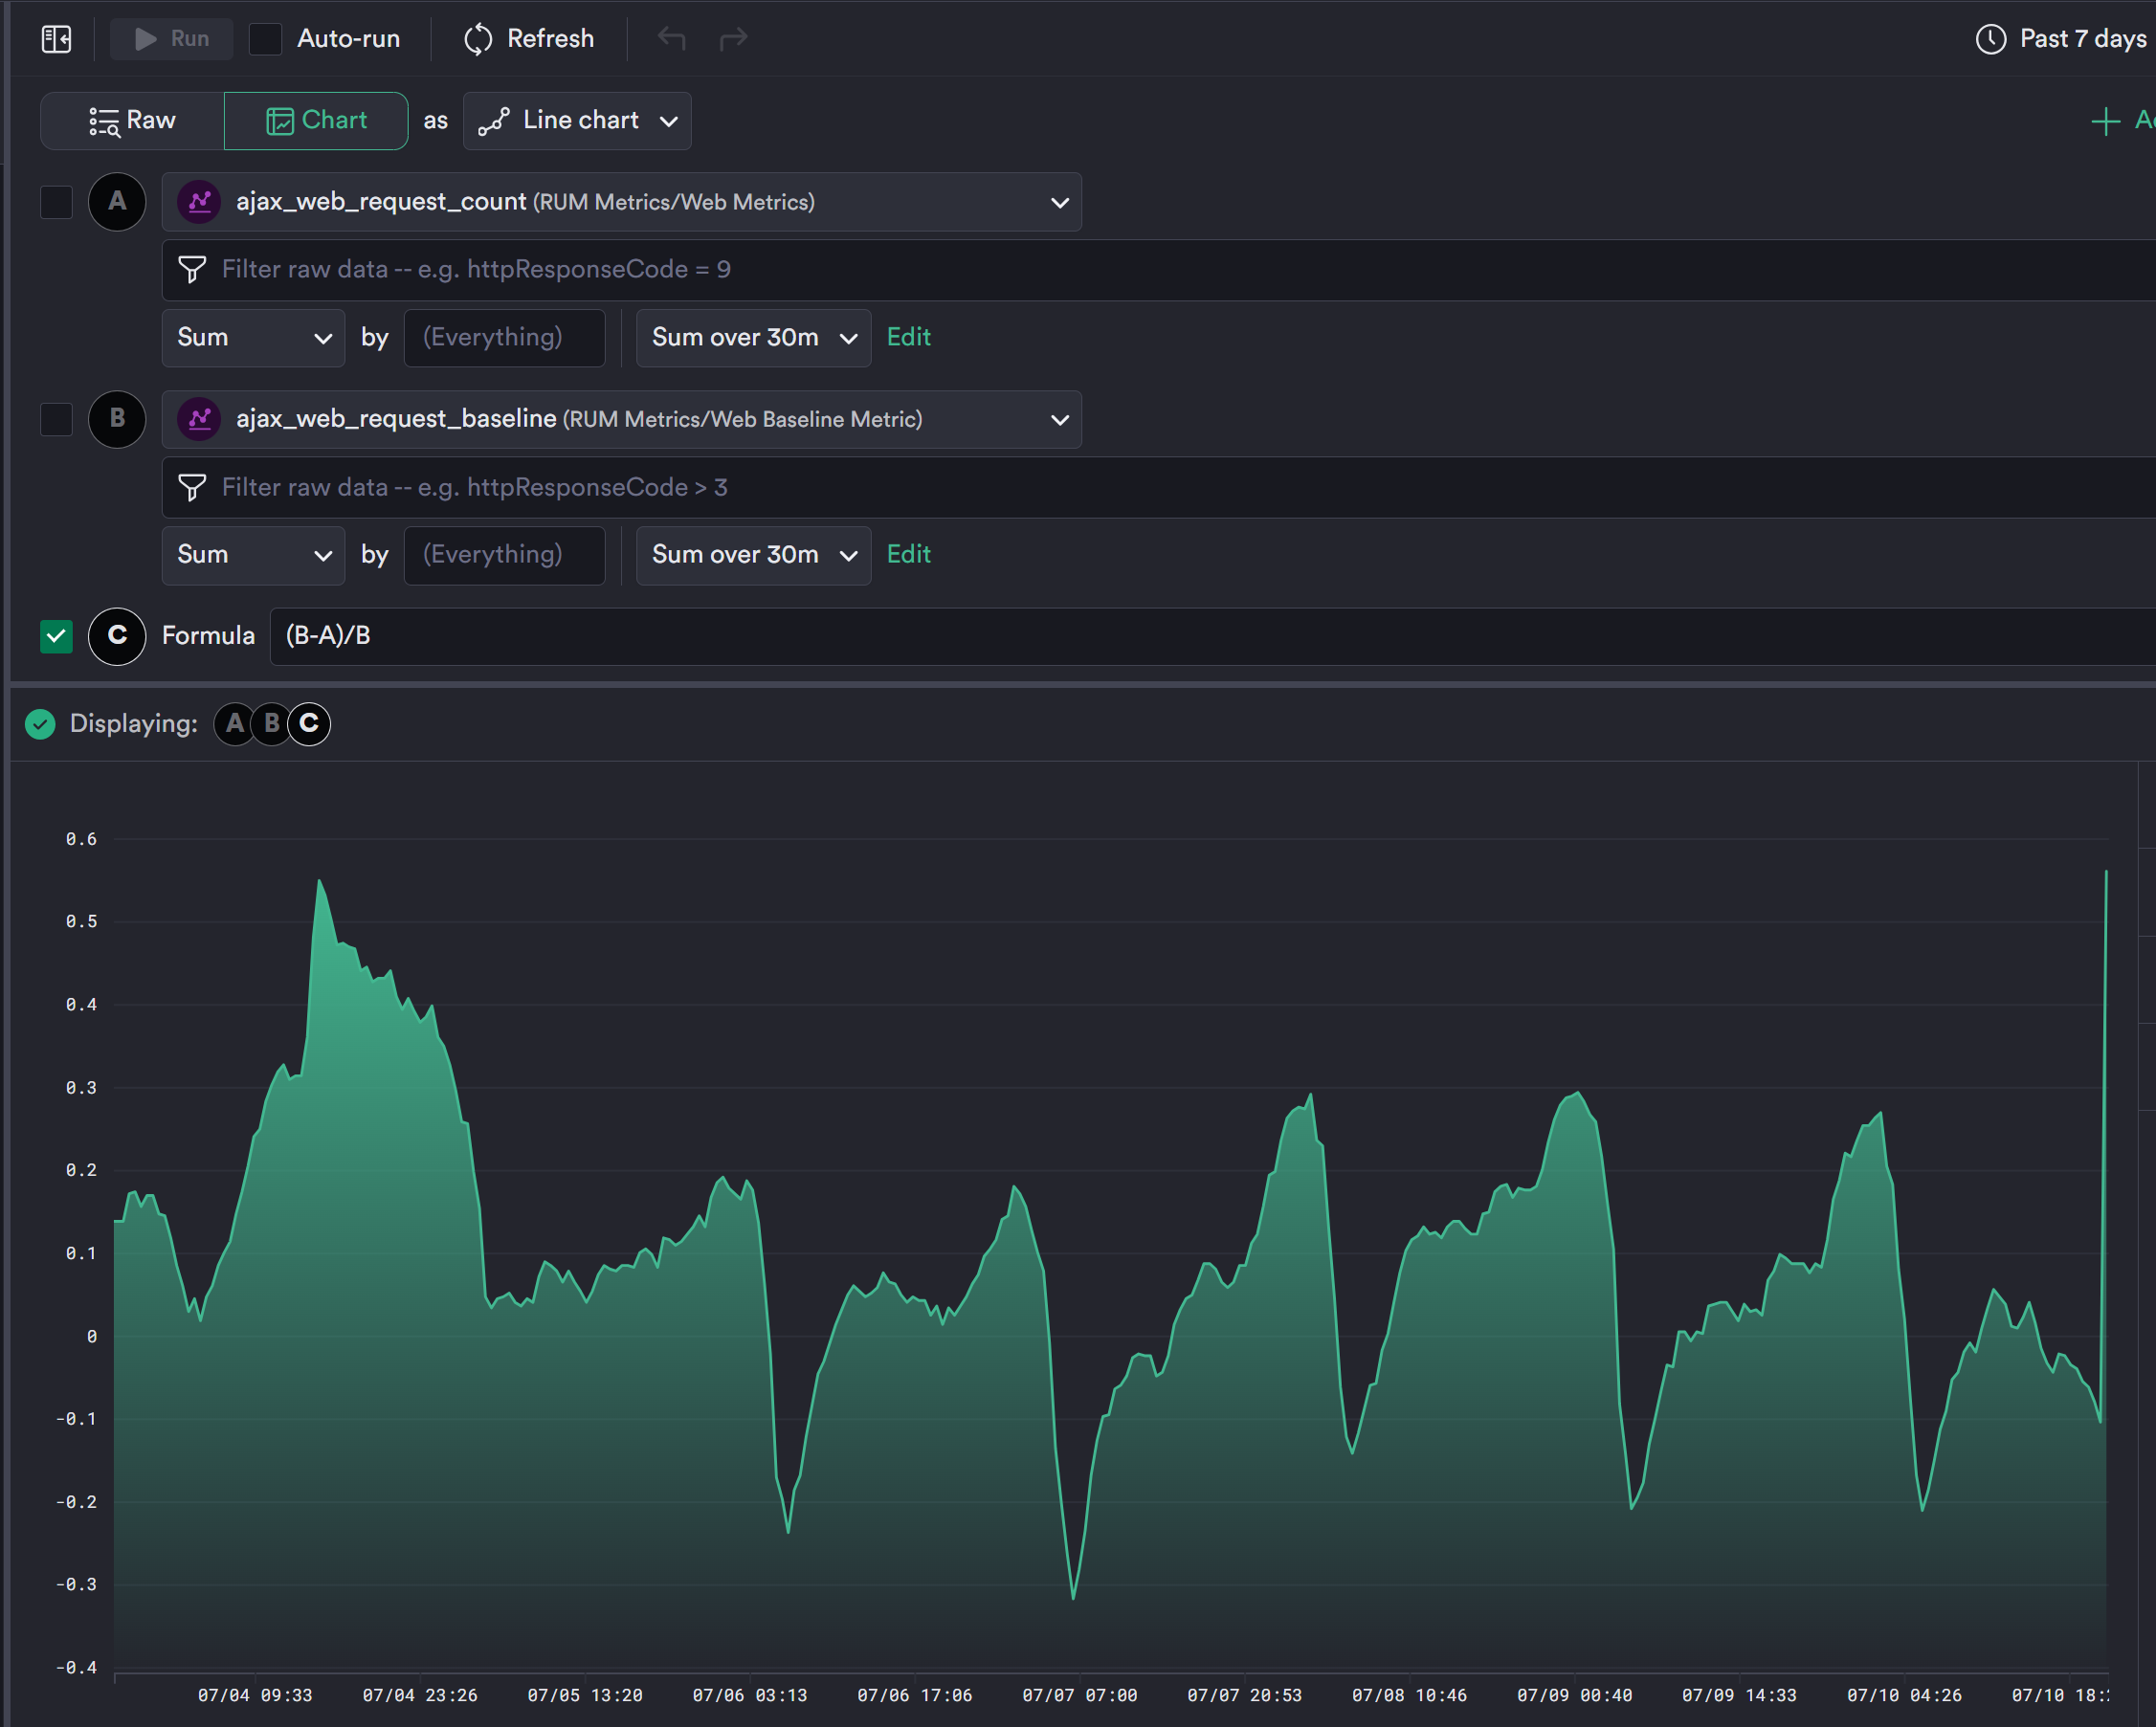
Then add a formula to represent any drift as a percentage.
Updated 5 months ago