Create a count monitor
Use a Count Monitor to monitor the count of matching events. For instance, the number of rejected messages or duplicated records are good subjects for a Count Monitor. Count Monitors can also be useful for negative monitoring.
Create a count monitor from a Worksheet
Start with a scenario that you want to alert on. For instance, you might have a more complex query for S3 Access Logs that also performs lookups to your service map, customer names, and Basic Threat Intel. To create a Count Monitor, click the ellipses button the top right of the active stage on the left side of the screen, click Create a monitor and Count monitor to open the Monitor creation form with a preconfigured input.
NoteWhile Monitors v2 is in preview, only single-stage worksheets can be used for Monitors. Collapse multiple stages to a single stage before proceeding.
See Create monitors and alerts for more details on alerting rules and actions.
Create a count monitor from a Dataset
The number of rows in dataset can be important to monitor. For instance, an unexpected change in the number of Accounts reported by the Observe for Snowflake app could indicate a number of interesting problems. To create a Count Monitor from this dataset, click the Create Monitor button at the top right of the dataset screen and select Count monitor. This will open the Monitor creation form with a preconfigured input. Note that if you want to send the details of the new accounts to your destination, Create a promote monitor.
Create a count monitor from the monitors list
Click New Monitor on the top right, then Count. Select a dataset to proceed.

Monitor name
Name the monitor before proceeding. Monitors must have a unique name within the instance. You can prepend a name with an App name and a slash for organizational purposes.
Monitor query
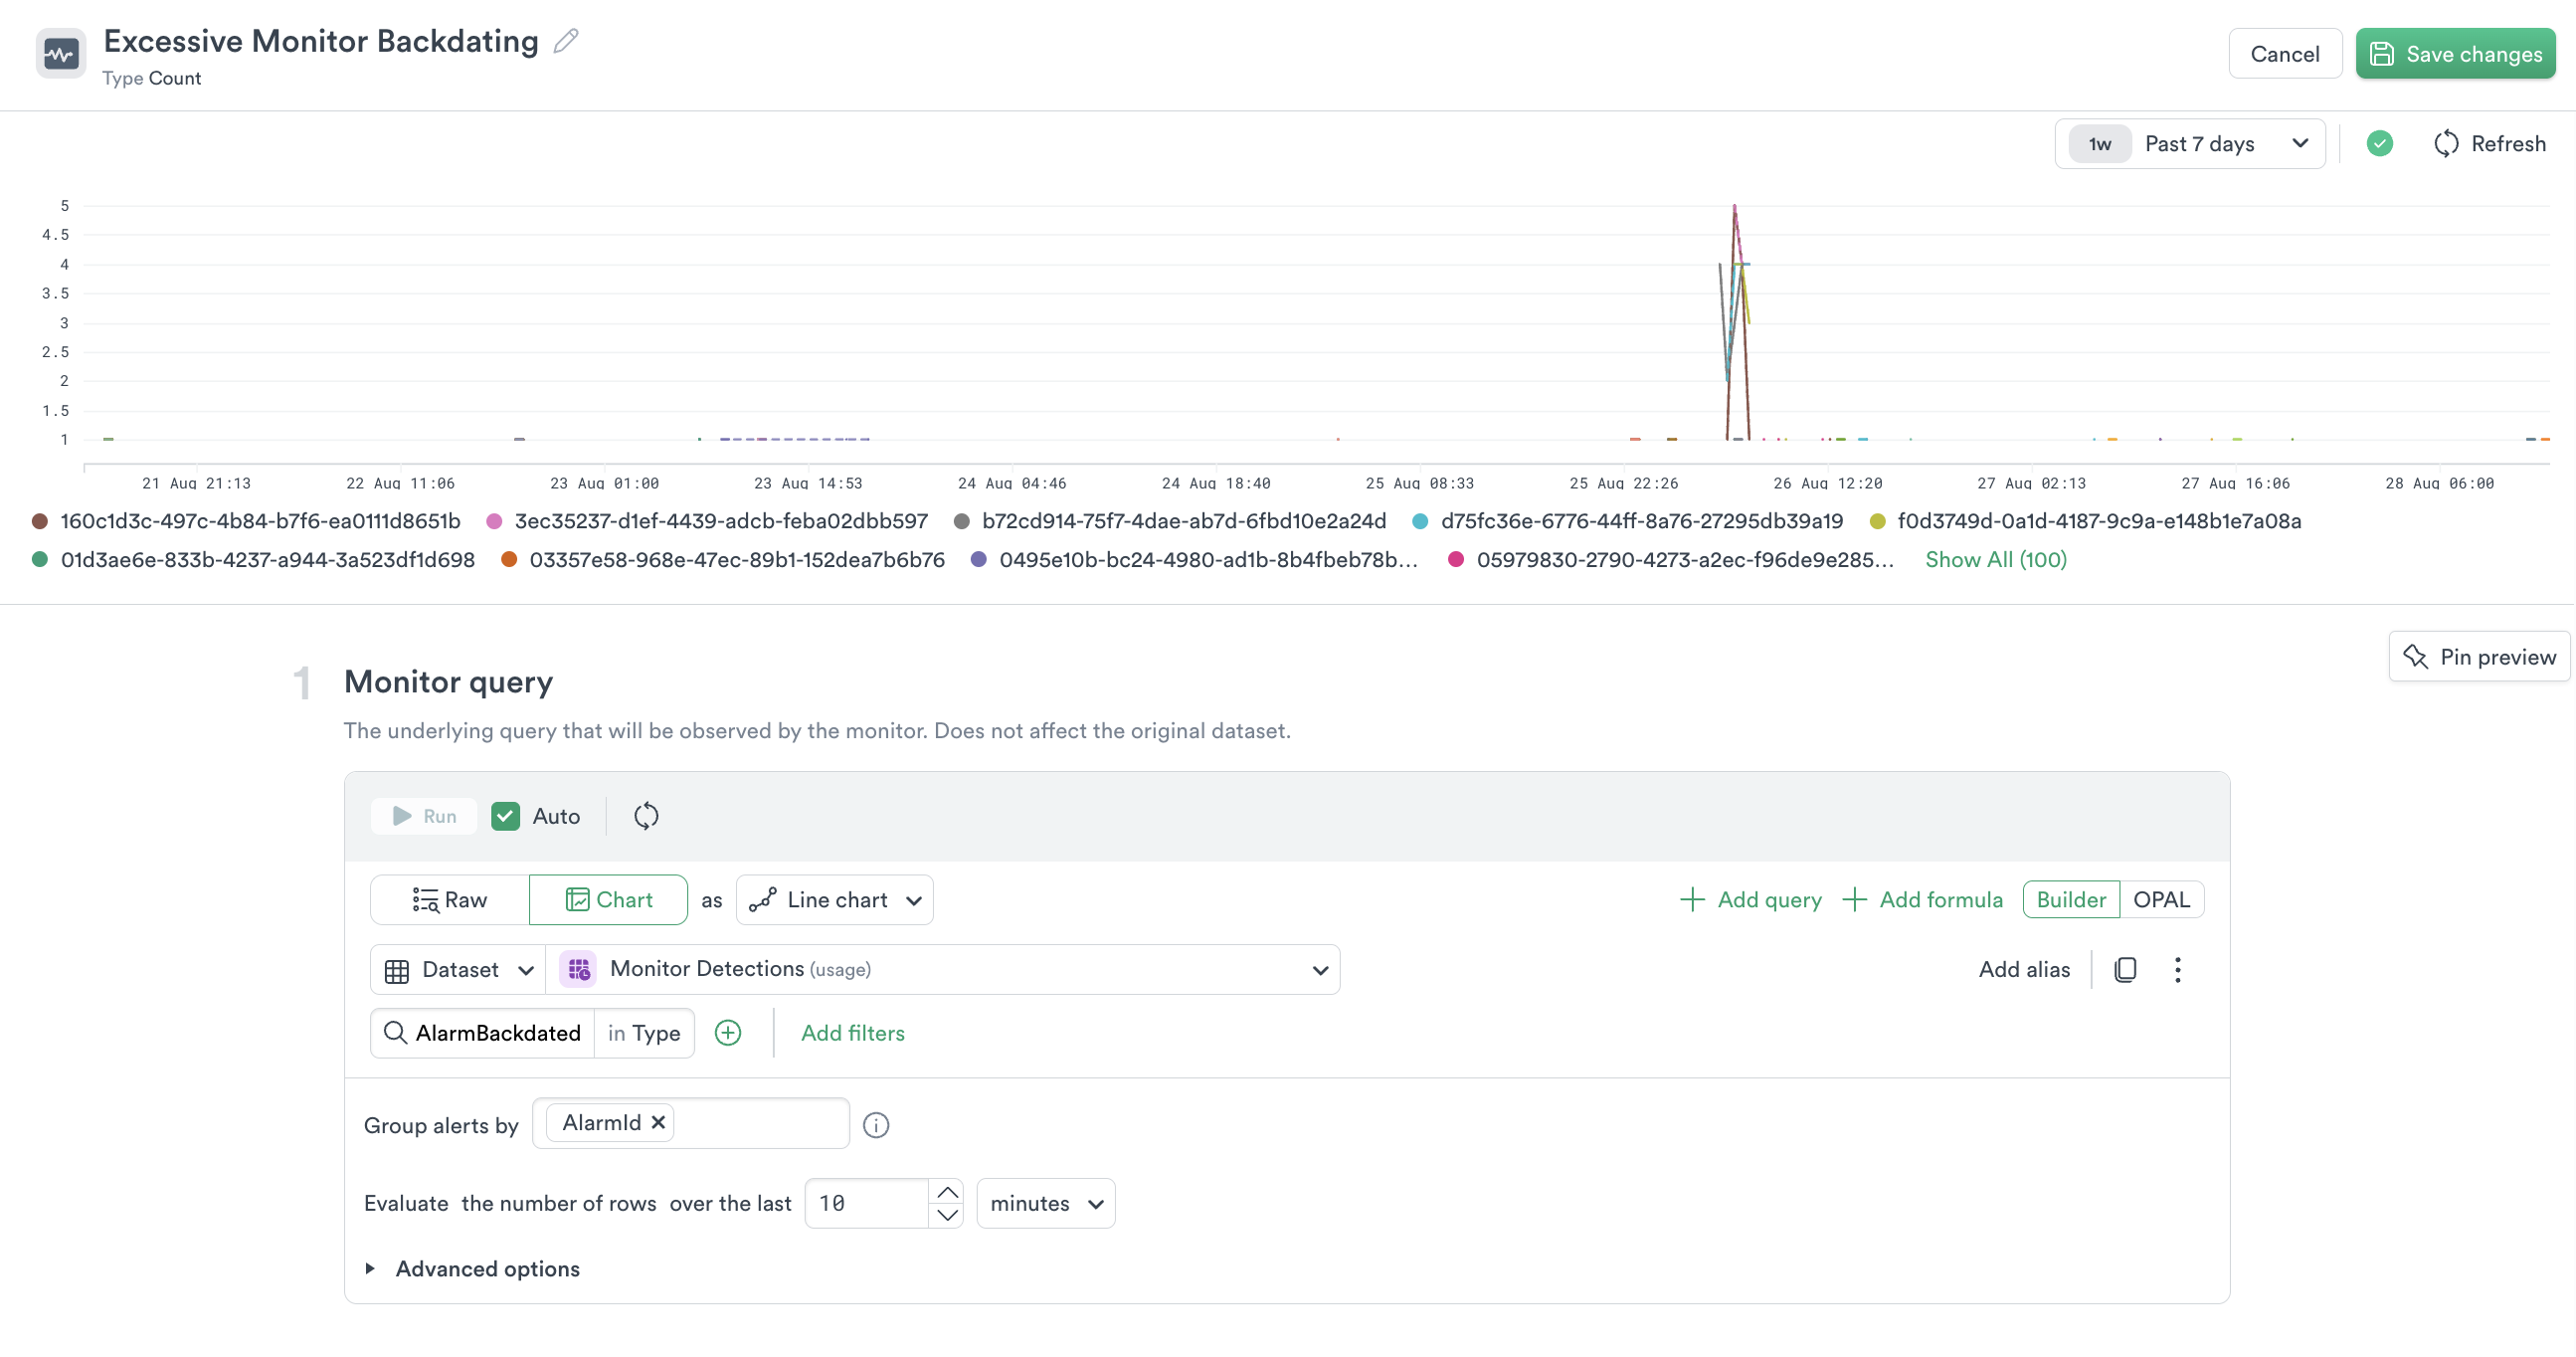
No matter how you've started a Count monitor, the flow is the same to proceed. First, review the Monitor query to ensure that it is gathering the data that you intend to monitor. Use the time selector at the top right of the preview panel. You have access to the entire set of Observe data manipulation tools: click Chart to organize the data, use filters to trim it, and add queries or formulas to enrich the monitor.
Queries and time
A monitor applies to a sliding window of time. As new data arrives and triggers an evaluation, the monitor query will:
- Start at the time set by the stabilization delay, if configured. See Monitor query, Advanced options, Delay monitor evaluation to review or change.
- Look back the amount of time set by the evaluation period. See Monitor query, Evaluate the number of rows over the last time period to review or change. For instance, a Count monitor that has a stabilization delay of 5 minutes and a lookback of 10 minutes will continuously monitor a sliding window from 15 minutes ago to 5 minutes ago. A Count monitor with no stabilization delay and a lookback of 120 seconds will monitor from now to two minutes ago.
Rules

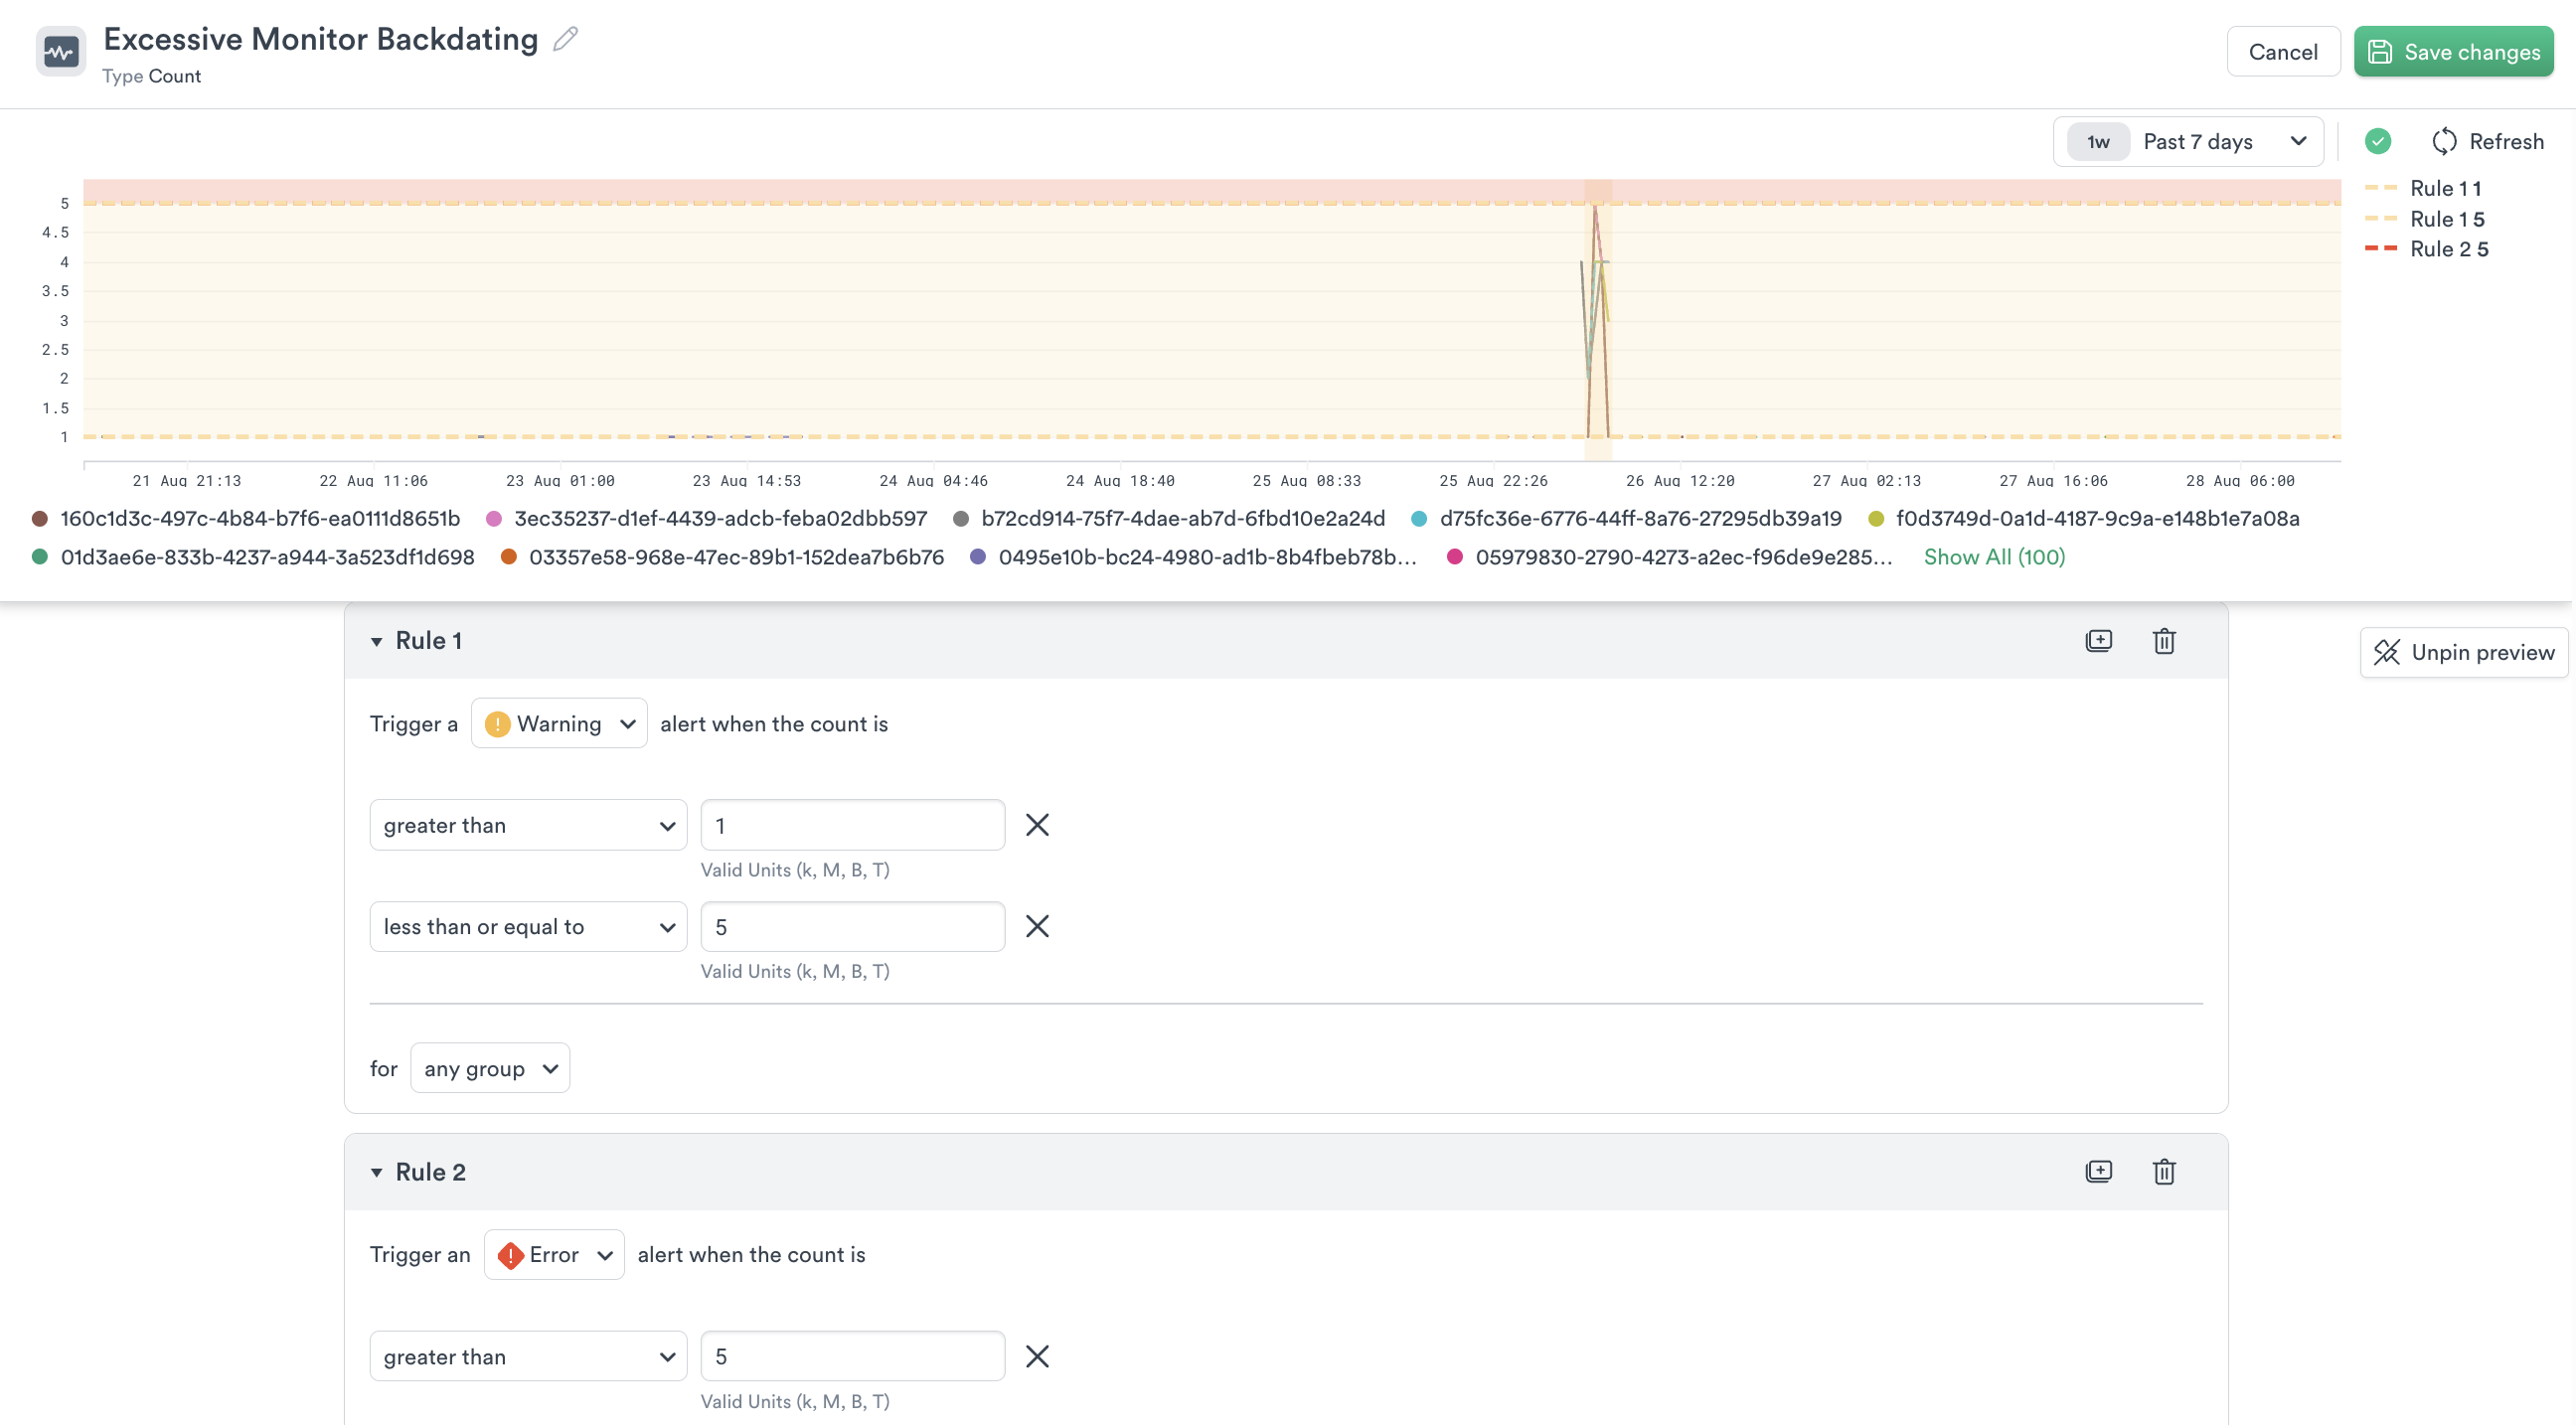
You can construct multiple rules in a monitor, using conditional tests from the data to set a severity level. The preview panel will update in real time so you can review where your rules are matching.
Count monitors accept rules based on the count of rows within the sliding evaluation window. Given a ten minute window, if the count matches the condition in a rule at any point the rule will trigger and an alert will be created.
To further constrain matches or set severity by grouped values in your data, click "For any group" and select a grouped value. For instance if you are grouping by an Alarm ID, select "Alarm ID", choose "equal to" or "not equal to", and enter an Alarm ID.
Description
Use the Monitor description field as a free form text entry to inform users, link runbooks, or tag monitors. You can search Monitors or alerts by the contents of this field.
Notification actions
Once an alert is created, notifications can happen. If no notification is configured, the alert will still be visible in monitoring logs and Alert Explorer.
Observe supports Email, Slack, PagerDuty, and generic Webhook actions. For each action, use the Conditions area to select the matching severities that will trigger this action. For instance, you might use Slack for a Warning, but PagerDuty for a Critical.
All actions can use Observe's extended Mustache formatting to refer to data. See Customize alert messages for details.
Actions can send reminders on a periodic basis; this can be useful for Slack or Email to larger teams. Click Send Reminders beneath the action to select a time frame, such as "1 day". Mustache variables can be used to control these alternate behaviors.
Actions can send end notifications, which is frequently used to close a ticket in a receiving system such as PagerDuty or OpsGenie. Click Send an update when the monitor has stopped triggering beneath the action to enable this. Mustache variables can be used to control these alternate behaviors.
Once configured, an action can be shared with your team members as a Saved Action, by clicking Share action with team in the title row. See Configure shared actions for more information.
Updated about 19 hours ago