Install Observe Agent on Amazon ECS (EC2)

These steps guide you through building a custom Docker image of the Observe Agent with a configuration file, pushing that image to Amazon ECR, creating an ECS task definition that uses it, and finally running it as a service to collect container logs, metrics and traces from your ECS Cluster.

Prerequisites

  • AWS CLI installed and configured

  • Access to an ECS cluster running on EC2

  • Permissions to create and manage Amazon ECR repositories and CloudWatch log groups

  • Proper IAM roles for ECS tasks and execution (including permissions for CloudWatch Logs and ECR)
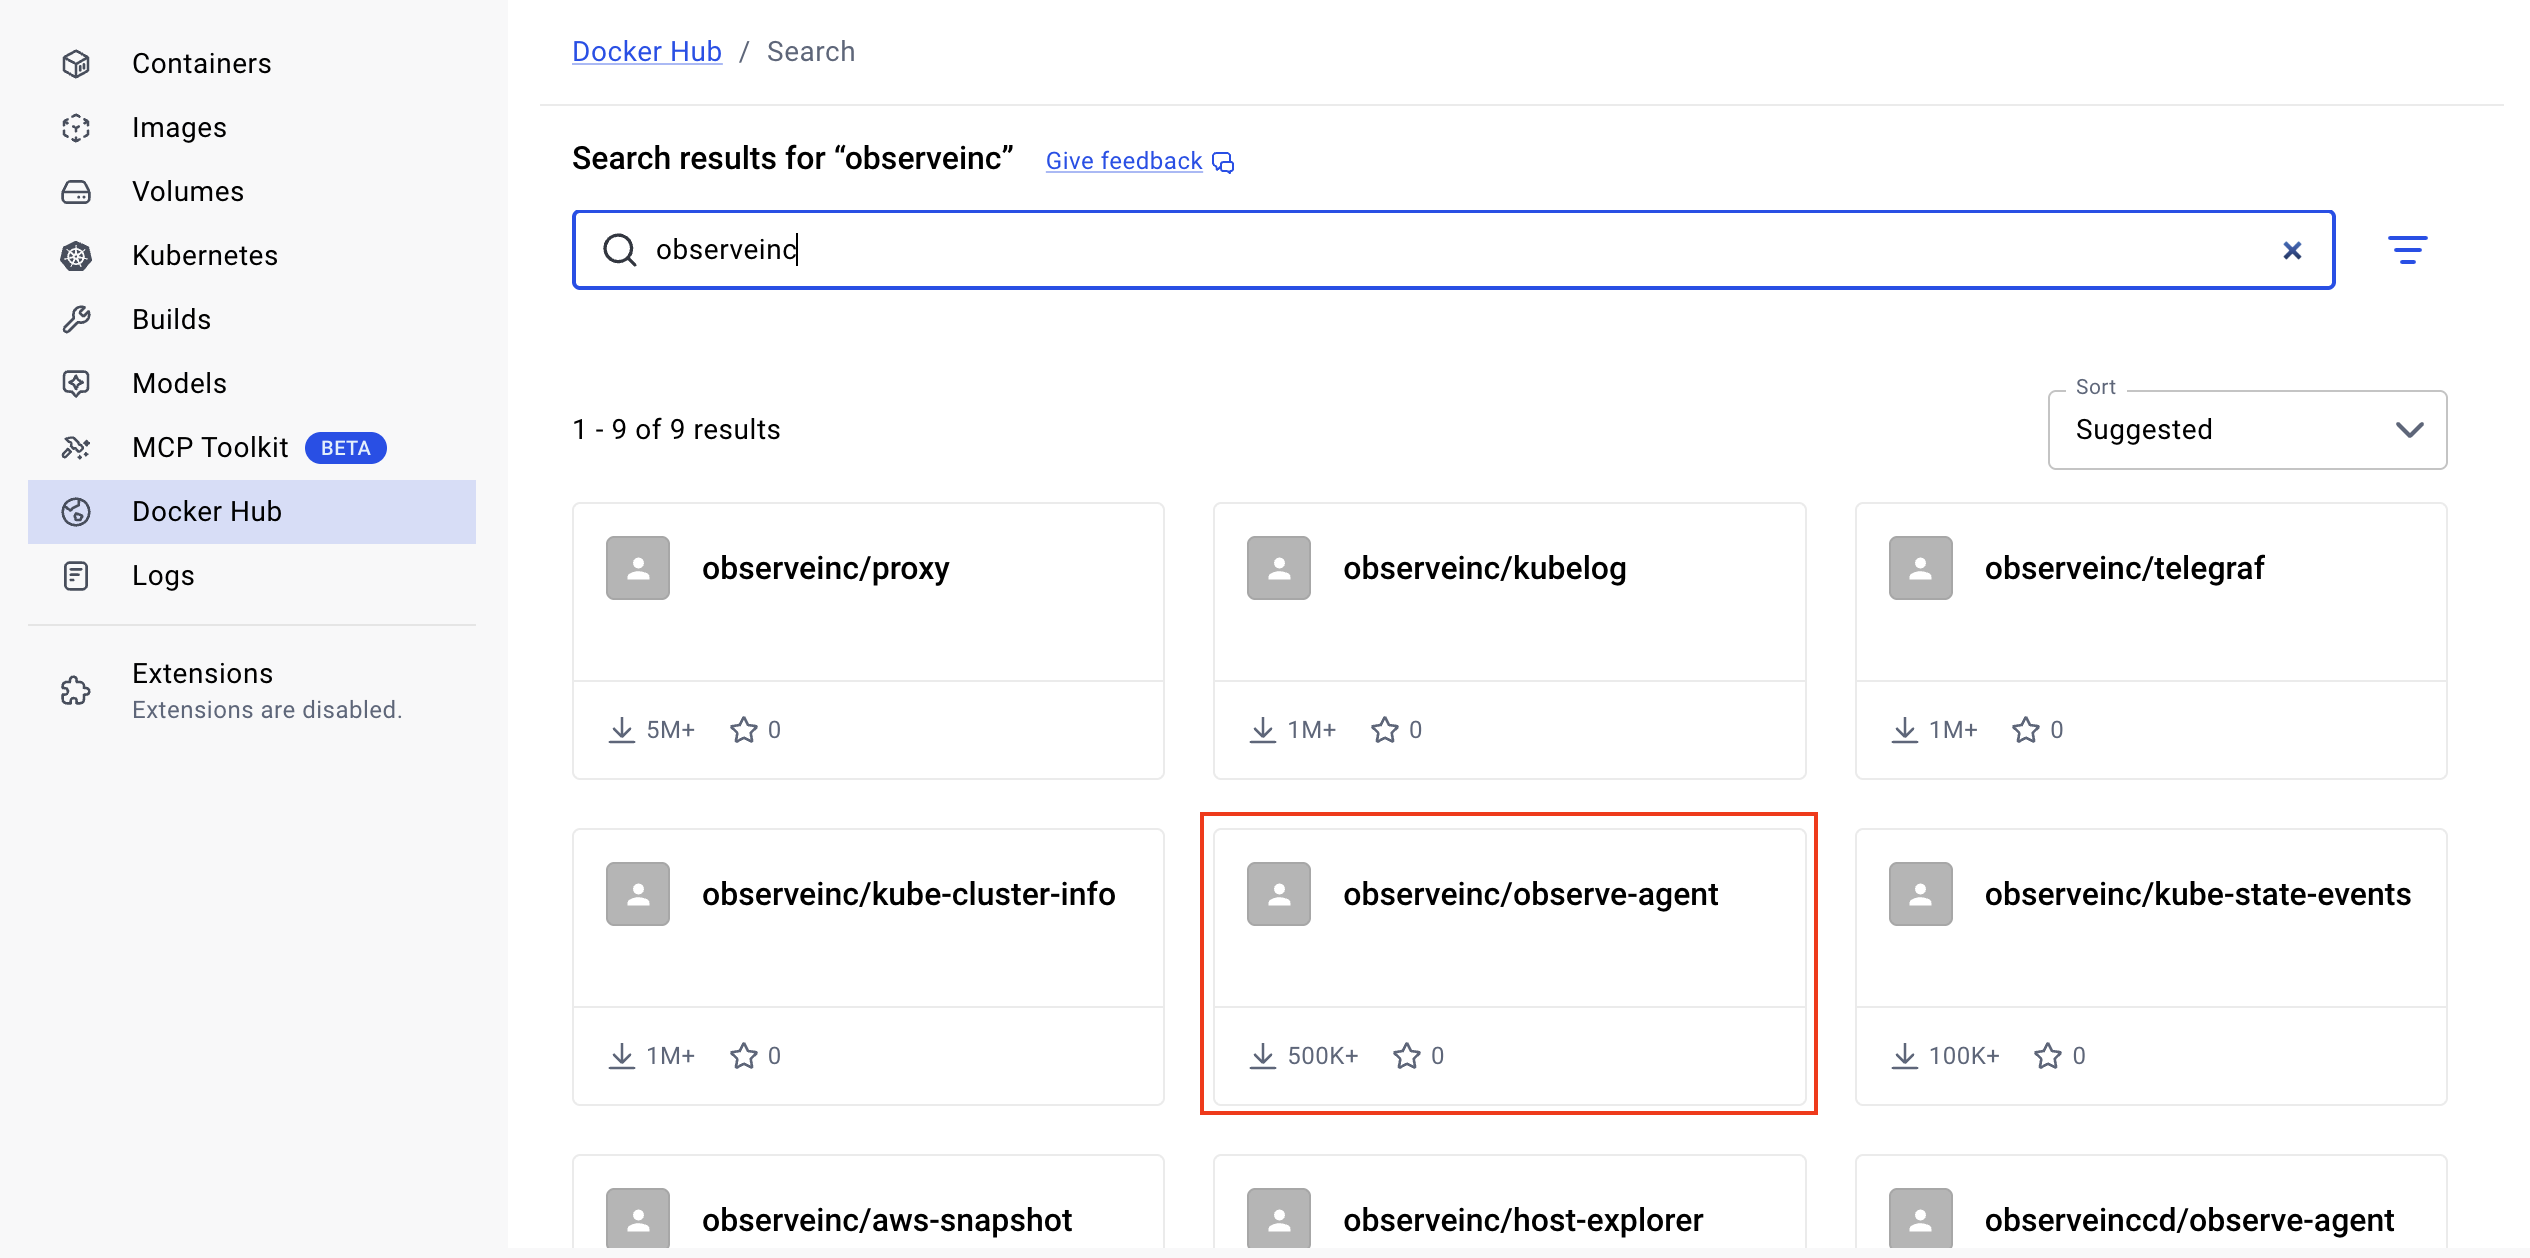
Prepare the Observe Agent configuration

Create the observe-agent.yaml configuration file

# Observe data token (ex: a1b2c3d4e5f6g7h8i9k0:l1m2n3o4p5q6r7s8t9u0v1w2x3y4z5a6)
token: "${TOKEN}"

# Target Observe collection url (ex: https://123456789012.collect.observeinc.com/)
observe_url: "${OBSERVE_URL}"

# Debug mode - Sets agent log level to debug
debug: false

self_monitoring:
  enabled: true

host_monitoring:
  enabled: false
  logs:
    enabled: false
    include:
  metrics:
    host:
      enabled: false
    process:
      enabled: false

otel_config_overrides:
  exporters:
    prometheusremotewrite:
      endpoint: "${OBSERVE_URL}/v1/prometheus"
      headers:
        authorization: "Bearer ${TOKEN}"
      resource_to_telemetry_conversion:
        enabled: true
      send_metadata: true
  receivers:
    otlp:
      protocols:
        grpc:
          endpoint: 0.0.0.0:4317
        http:
          endpoint: 0.0.0.0:4318
    awsecscontainermetrics:
      collection_interval: 20s
    filelog/ecs:
      include: [/var/lib/docker/containers/**/*.log]
      include_file_path: true
      storage: file_storage
      retry_on_failure:
        enabled: true
      max_log_size: 4MiB
  service:
    pipelines:
      metrics/ecs:
        receivers: [awsecscontainermetrics]
        processors: [resourcedetection, resourcedetection/cloud]
        exporters: [prometheusremotewrite]
      metrics/forward:
        receivers: [otlp]
        processors: [resourcedetection, resourcedetection/cloud]
        exporters: [prometheusremotewrite]
      metrics/agent-internal:
        receivers: [prometheus/agent, count]
        processors: [memory_limiter, transform/truncate, resourcedetection, resourcedetection/cloud, batch]
        exporters: [prometheusremotewrite]
      logs/ecs:
        receivers: [filelog/ecs]
        processors: [memory_limiter, transform/truncate, resourcedetection, resourcedetection/cloud, batch]
        exporters: [otlphttp/observe, count]

Create the observe-agent.yaml configuration file

# Observe data token (ex: a1b2c3d4e5f6g7h8i9k0:l1m2n3o4p5q6r7s8t9u0v1w2x3y4z5a6)
token: "${TOKEN}"

# Target Observe collection url (ex: https://123456789012.collect.observeinc.com/)
observe_url: "${OBSERVE_URL}"

# Debug mode - Sets agent log level to debug
debug: false

self_monitoring:
  enabled: true

host_monitoring:
  enabled: false
  logs:
    enabled: false
    include:
  metrics:
    host:
      enabled: false
    process:
      enabled: false

otel_config_overrides:
  exporters:
    prometheusremotewrite:
      endpoint: "${OBSERVE_URL}/v1/prometheus"
      headers:
        authorization: "Bearer ${TOKEN}"
      resource_to_telemetry_conversion:
        enabled: true
      send_metadata: true
    otlphttp/observe-traces:
      # (ex: https://123456789012.collect.observeinc.com/v2/otel)
      endpoint: "${OBSERVE_URL}/v2/otel"
      headers:
        # (ex: Bearer a1b2c3d4e5f6g7h8i9k0:l1m2n3o4p5q6r7s8t9u0v1w2x3y4z5a6)
        authorization: "Bearer ${TRACE_TOKEN}"
  receivers:
    otlp:
      protocols:
        grpc:
          endpoint: 0.0.0.0:4317
        http:
          endpoint: 0.0.0.0:4318
    awsecscontainermetrics:
      collection_interval: 20s
    filelog/ecs:
      include: [/var/lib/docker/containers/**/*.log]
      include_file_path: true
      storage: file_storage
      retry_on_failure:
        enabled: true
      max_log_size: 4MiB
  service:
    pipelines:
      metrics/ecs:
        receivers: [awsecscontainermetrics]
        processors: [resourcedetection, resourcedetection/cloud]
        exporters: [prometheusremotewrite]
      metrics/forward:
        receivers: [otlp]
        processors: [resourcedetection, resourcedetection/cloud]
        exporters: [prometheusremotewrite]
      metrics/agent-internal:
        receivers: [prometheus/agent, count]
        processors: [memory_limiter, transform/truncate, resourcedetection, resourcedetection/cloud, batch]
        exporters: [prometheusremotewrite]
      logs/ecs:
        receivers: [filelog/ecs]
        processors: [memory_limiter, transform/truncate, resourcedetection, resourcedetection/cloud, batch]
        exporters: [otlphttp/observe, count]
      traces/forward:
        receivers: [otlp]
        processors: [resourcedetection, resourcedetection/cloud]
        exporters: [otlphttp/observe-traces]

Build and Push the docker image to Amazon ECR

  1. Create the Dockerfile

FROM observeinc/observe-agent:1.5.0
COPY observe-agent.yaml /etc/observe-agent/observe-agent.yaml
  1. Build the docker image

docker buildx build --platform=linux/amd64 -t observe-agent:1.5.0 .
  1. Create an ECR repository In the AWS Management Console or via the CLI, create a repository named observe/observe-agent. The repository URI will look like this:

<your_account_id>.dkr.ecr.<your_region>.amazonaws.com/observe/observe-agent
  1. Push the image to ECR

aws ecr get-login-password --region <your_region> | docker login --username AWS --password-stdin <your_account_id>.dkr.ecr.<your_region>.amazonaws.com
docker tag observe-agent:1.5.0 <your_account_id>.dkr.ecr.<your_region>.amazonaws.com/observe/observe-agent:1.5.0
docker push <your_account_id>.dkr.ecr.<your_region>.amazonaws.com/observe/observe-agent:1.5.0

Create a CloudWatch log group for the Observe Agent

Before running the task, ensure a CloudWatch log group exists for your agent logs:

aws logs create-log-group --log-group-name /aws/ecs/observe/observe-agent --region <your_region>

Create the ECS task definition

Update the fields below with your values:

  • <your_account_id>: Your AWS account ID

  • <your_region>: The AWS region (e.g., ca-central-1)

  • <YOUR OBSERVE TOKEN>: Your Observe data token (e.g., a1b2c3d4e5f6g7h8i9k0:l1m2n3o4p5q6r7s8t9u0v1w2x3y4z5a6 )

  • <YOUR OBSERVE COLLECTION ENDPOINT>: Your Observe collection endpoint URL (e.g., https://123456789012.collect.observeinc.com/)

  • <your_ecs_task_role>: An IAM role ARN granting necessary permissions to the task

  • <your_ecs_execution_role>: An IAM role ARN with permissions to read from ECR and write logs to CloudWatch

Note

The <YOUR OBSERVE COLLECTION ENDPOINT> is composed from https://<OBSERVE_CUSTOMER_ID>.collect.<OBSERVE_INSTANCE>. For example, if you typically login to https://123456789012.observeinc.com, your <YOUR OBSERVE COLLECTION ENDPOINT> is https://123456789012.collect.observeinc.com.

Note

Some Observe instances may optionally use a name instead of Customer ID; if this is the case for your instance, contact your Observe Data Engineer to discuss implementation. A stem name will work as is, but a DNS redirect name may require client configuration.

Make sure the execution role has logs:CreateLogStream and logs:PutLogEvents permissions.

{
    "family": "observe-agent-task",
    "containerDefinitions": [
        {
            "name": "observe-agent",
            "image": "<your_account_id>.dkr.ecr.<your_region>.amazonaws.com/observe/observe-agent:1.5.0",
            "cpu": 100,
            "memory": 512,
            "portMappings": [
              { 
                "containerPort": 4317, 
                "protocol": "tcp" 
              },
              { "containerPort": 4318, 
                "protocol": "tcp" 
              }
            ],
            "essential": true,
            "environment": [
                {
                    "name": "TOKEN",
                    "value": "<YOUR OBSERVE TOKEN>"
                },
                {
                    "name": "OBSERVE_URL",
                    "value": "<YOUR OBSERVE COLLECTION ENDPOINT>"
                }
            ],
            "mountPoints": [
                {
                    "sourceVolume": "docker_logs",
                    "containerPath": "/var/lib/docker/containers",
                    "readOnly": true
                },
                {
                    "sourceVolume": "docker_sock",
                    "containerPath": "/var/run/docker.sock",
                    "readOnly": true
                }
            ],
            "volumesFrom": [],
            "readonlyRootFilesystem": false,
            "logConfiguration": {
                "logDriver": "awslogs",
                "options": {
                    "awslogs-group": "/aws/ecs/observe/observe-agent",
                    "awslogs-region": "<your_region>",
                    "awslogs-stream-prefix": "ecs"
                }
            },
            "systemControls": []
        }
    ],
    "taskRoleArn": "arn:aws:iam::<your_account_id>:role/<your_ecs_task_role>",
    "executionRoleArn": "arn:aws:iam::<your_account_id>:role/<your_ecs_execution_role>",
    "networkMode": "bridge",
    "volumes": [
        {
            "name": "docker_logs",
            "host": {
                "sourcePath": "/var/lib/docker/containers"
            }
        },
        {
            "name": "docker_sock",
            "host": {
                "sourcePath": "/var/run/docker.sock"
            }
        }
    ],
    "placementConstraints": [],
    "requiresCompatibilities": [
        "EC2"
    ],
    "enableFaultInjection": false
}

Register this task definition using the AWS CLI:

aws ecs register-task-definition --cli-input-json file://observe-agent-task-definition.json --region <your_region>

Update the fields below with your values:

  • <your_account_id>: Your AWS account ID

  • <your_region>: The AWS region (e.g., ca-central-1)

  • <YOUR OBSERVE TOKEN>: Your Observe data token (e.g., a1b2c3d4e5f6g7h8i9k0:l1m2n3o4p5q6r7s8t9u0v1w2x3y4z5a6 )

  • <YOUR ANOTHER OBSERVE TOKEN>: Install the OpenTelemetry App if you have not already done so, and create a token associated with OpenTelemetry App’s datastream. (e.g., a1b2c3d4e5f6g7h8i9k0:l1m2n3o4p5q6r7s8t9u0v1w2x3y4z5a6 )

  • <YOUR OBSERVE COLLECTION ENDPOINT>: Your Observe collection endpoint URL (e.g., https://123456789012.collect.observeinc.com/)

  • <your_ecs_task_role>: An IAM role ARN granting necessary permissions to the task

  • <your_ecs_execution_role>: An IAM role ARN with permissions to read from ECR and write logs to CloudWatch

Note

The <YOUR OBSERVE COLLECTION ENDPOINT> is composed from https://<OBSERVE_CUSTOMER_ID>.collect.<OBSERVE_INSTANCE>. For example, if you typically login to https://123456789012.observeinc.com, your <YOUR OBSERVE COLLECTION ENDPOINT> is https://123456789012.collect.observeinc.com.

Note

Some Observe instances may optionally use a name instead of Customer ID; if this is the case for your instance, contact your Observe Data Engineer to discuss implementation. A stem name will work as is, but a DNS redirect name may require client configuration.

Make sure the execution role has logs:CreateLogStream and logs:PutLogEvents permissions.

{
    "family": "observe-agent-task",
    "containerDefinitions": [
        {
            "name": "observe-agent",
            "image": "<your_account_id>.dkr.ecr.<your_region>.amazonaws.com/observe/observe-agent:1.5.0",
            "cpu": 100,
            "memory": 512,
            "portMappings": [
              { 
                "containerPort": 4317, 
                "protocol": "tcp" 
              },
              { "containerPort": 4318, 
                "protocol": "tcp" 
              }
            ],
            "essential": true,
            "environment": [
                {
                    "name": "TOKEN",
                    "value": "<YOUR OBSERVE TOKEN>"
                },
                {
                    "name": "TRACE_TOKEN",
                    "value": "<YOUR ANOTHER OBSERVE TOKEN>"
                },
                {
                    "name": "OBSERVE_URL",
                    "value": "<YOUR OBSERVE COLLECTION ENDPOINT>"
                }
            ],
            "mountPoints": [
                {
                    "sourceVolume": "docker_logs",
                    "containerPath": "/var/lib/docker/containers",
                    "readOnly": true
                },
                {
                    "sourceVolume": "docker_sock",
                    "containerPath": "/var/run/docker.sock",
                    "readOnly": true
                }
            ],
            "volumesFrom": [],
            "readonlyRootFilesystem": false,
            "logConfiguration": {
                "logDriver": "awslogs",
                "options": {
                    "awslogs-group": "/aws/ecs/observe/observe-agent",
                    "awslogs-region": "<your_region>",
                    "awslogs-stream-prefix": "ecs"
                }
            },
            "systemControls": []
        }
    ],
    "taskRoleArn": "arn:aws:iam::<your_account_id>:role/<your_ecs_task_role>",
    "executionRoleArn": "arn:aws:iam::<your_account_id>:role/<your_ecs_execution_role>",
    "networkMode": "bridge",
    "volumes": [
        {
            "name": "docker_logs",
            "host": {
                "sourcePath": "/var/lib/docker/containers"
            }
        },
        {
            "name": "docker_sock",
            "host": {
                "sourcePath": "/var/run/docker.sock"
            }
        }
    ],
    "placementConstraints": [],
    "requiresCompatibilities": [
        "EC2"
    ],
    "enableFaultInjection": false
}

Register this task definition using the AWS CLI:

aws ecs register-task-definition --cli-input-json file://observe-agent-task-definition.json --region <your_region>

Create an ECS service

aws ecs create-service \
  --cluster <your_ecs_cluster_name> \
  --service-name observe-agent \
  --task-definition observe-agent-task \
  --deployment-controller type=ECS \
  --launch-type EC2 \
  --scheduling-strategy DAEMON \
  --region <your_region>

Configure application instrumentation

Once the Observe Agent is up and running on an ECS cluster, you can configure your application running on the same ECS cluster to send telemetry data to the Observe Agent using one of the following addresses:

Note

When setting up the endpoint to send traces, make sure you use the path that your OTLP library requires. Some libraries need traces to go to /v1/traces, while others expect them at the root path /.

  • OTLP/HTTP endpoint: http://localhost:4318

  • OTLP/grpc endpoint: http://localhost:4317

If your application is not able to reach the OTLP endpoints above, register the observe-agent ECS service in AWS Cloud Map

Next Steps

  • Confirm that the Observe Agent is running by checking ECS task status.

  • Validate that logs and metrics appear in your Observe tenant.

  • Monitor the CloudWatch Logs group /aws/ecs/observe/observe-agent for any troubleshooting information.

This completes the setup of the Observe Agent on ECS (EC2) to collect container logs and metrics.