View GCP data in Observe
Observe helps you quickly start monitoring the health and activity of your Google Cloud systems with the following features:
-
A log Dataset (Logs) with logs shipped by Google Cloud Logging.
-
A metrics Dataset (Metrics) with metrics collected from enabled and reporting services.
-
A resource Dataset (Resources) to discover and inspect services and infrastructure from your Google Cloud Project or Folder. Furthermore, applicable metrics and logs are automatically linked to their associated resources to enable deeper troubleshooting.
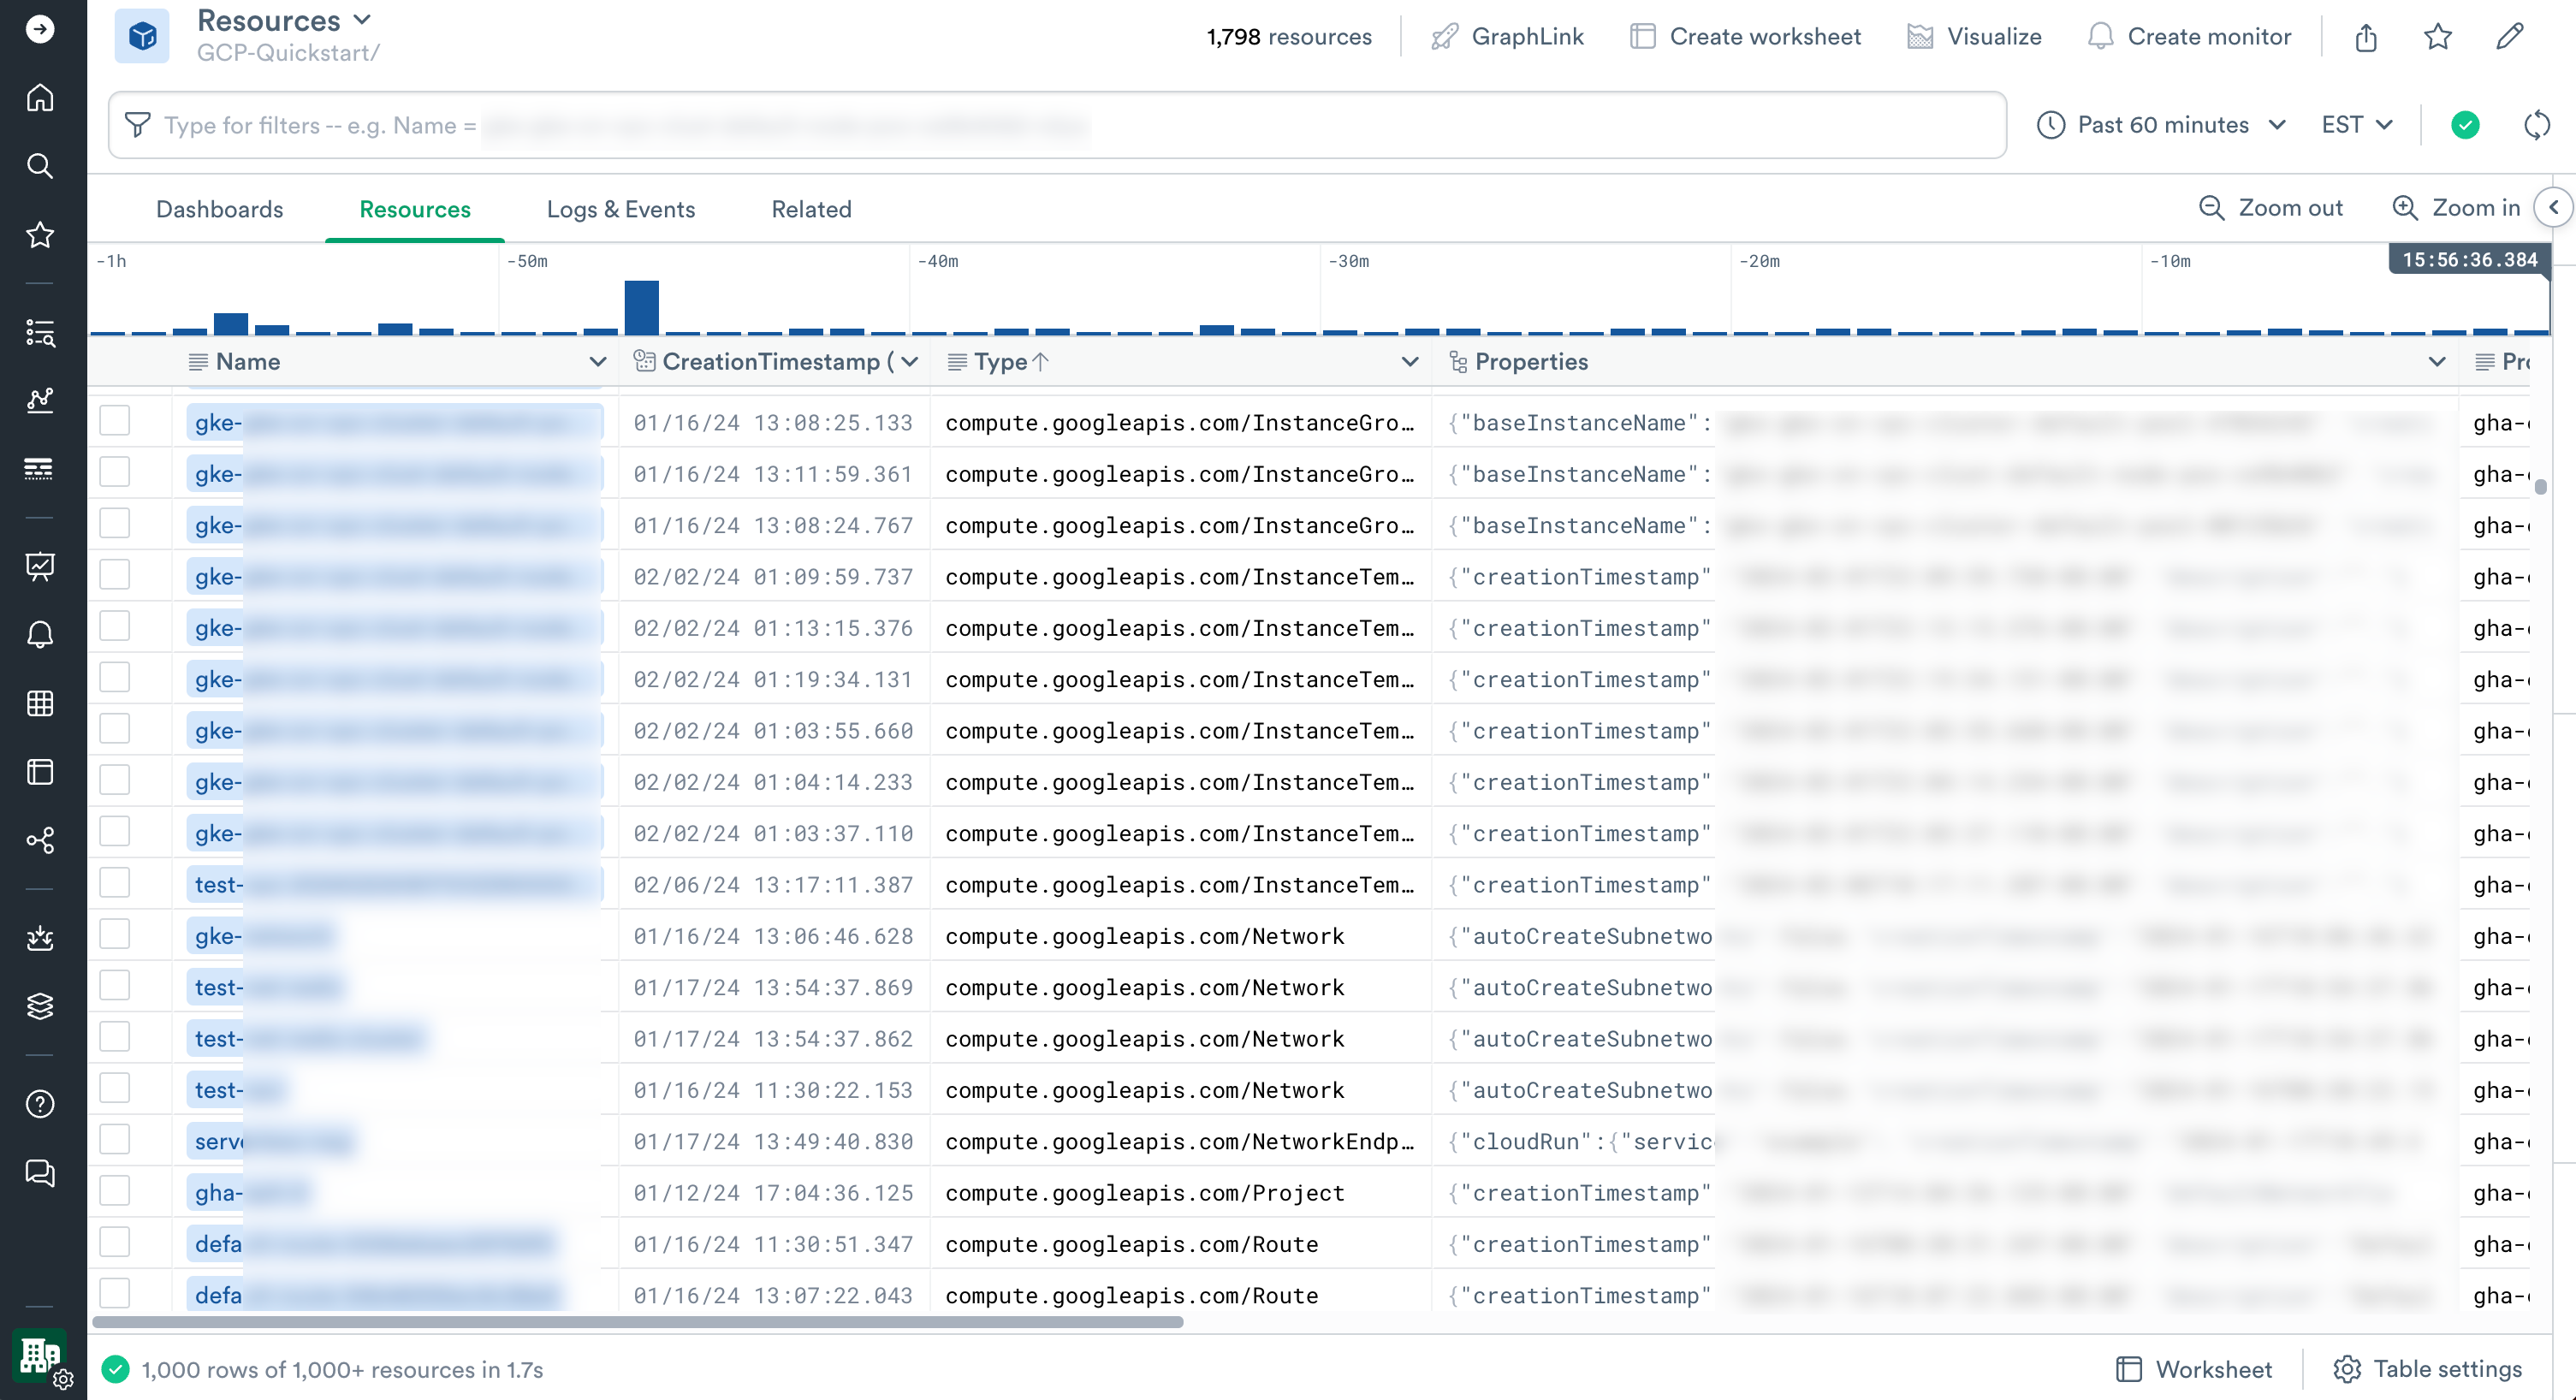
Resources for GCP data
The Google Cloud Platform Quickstart app is designed to auto discover resources in your Google Cloud Project or Folder. Assets are automatically captured from every monitored project, including properties associated with each asset depending on its type.
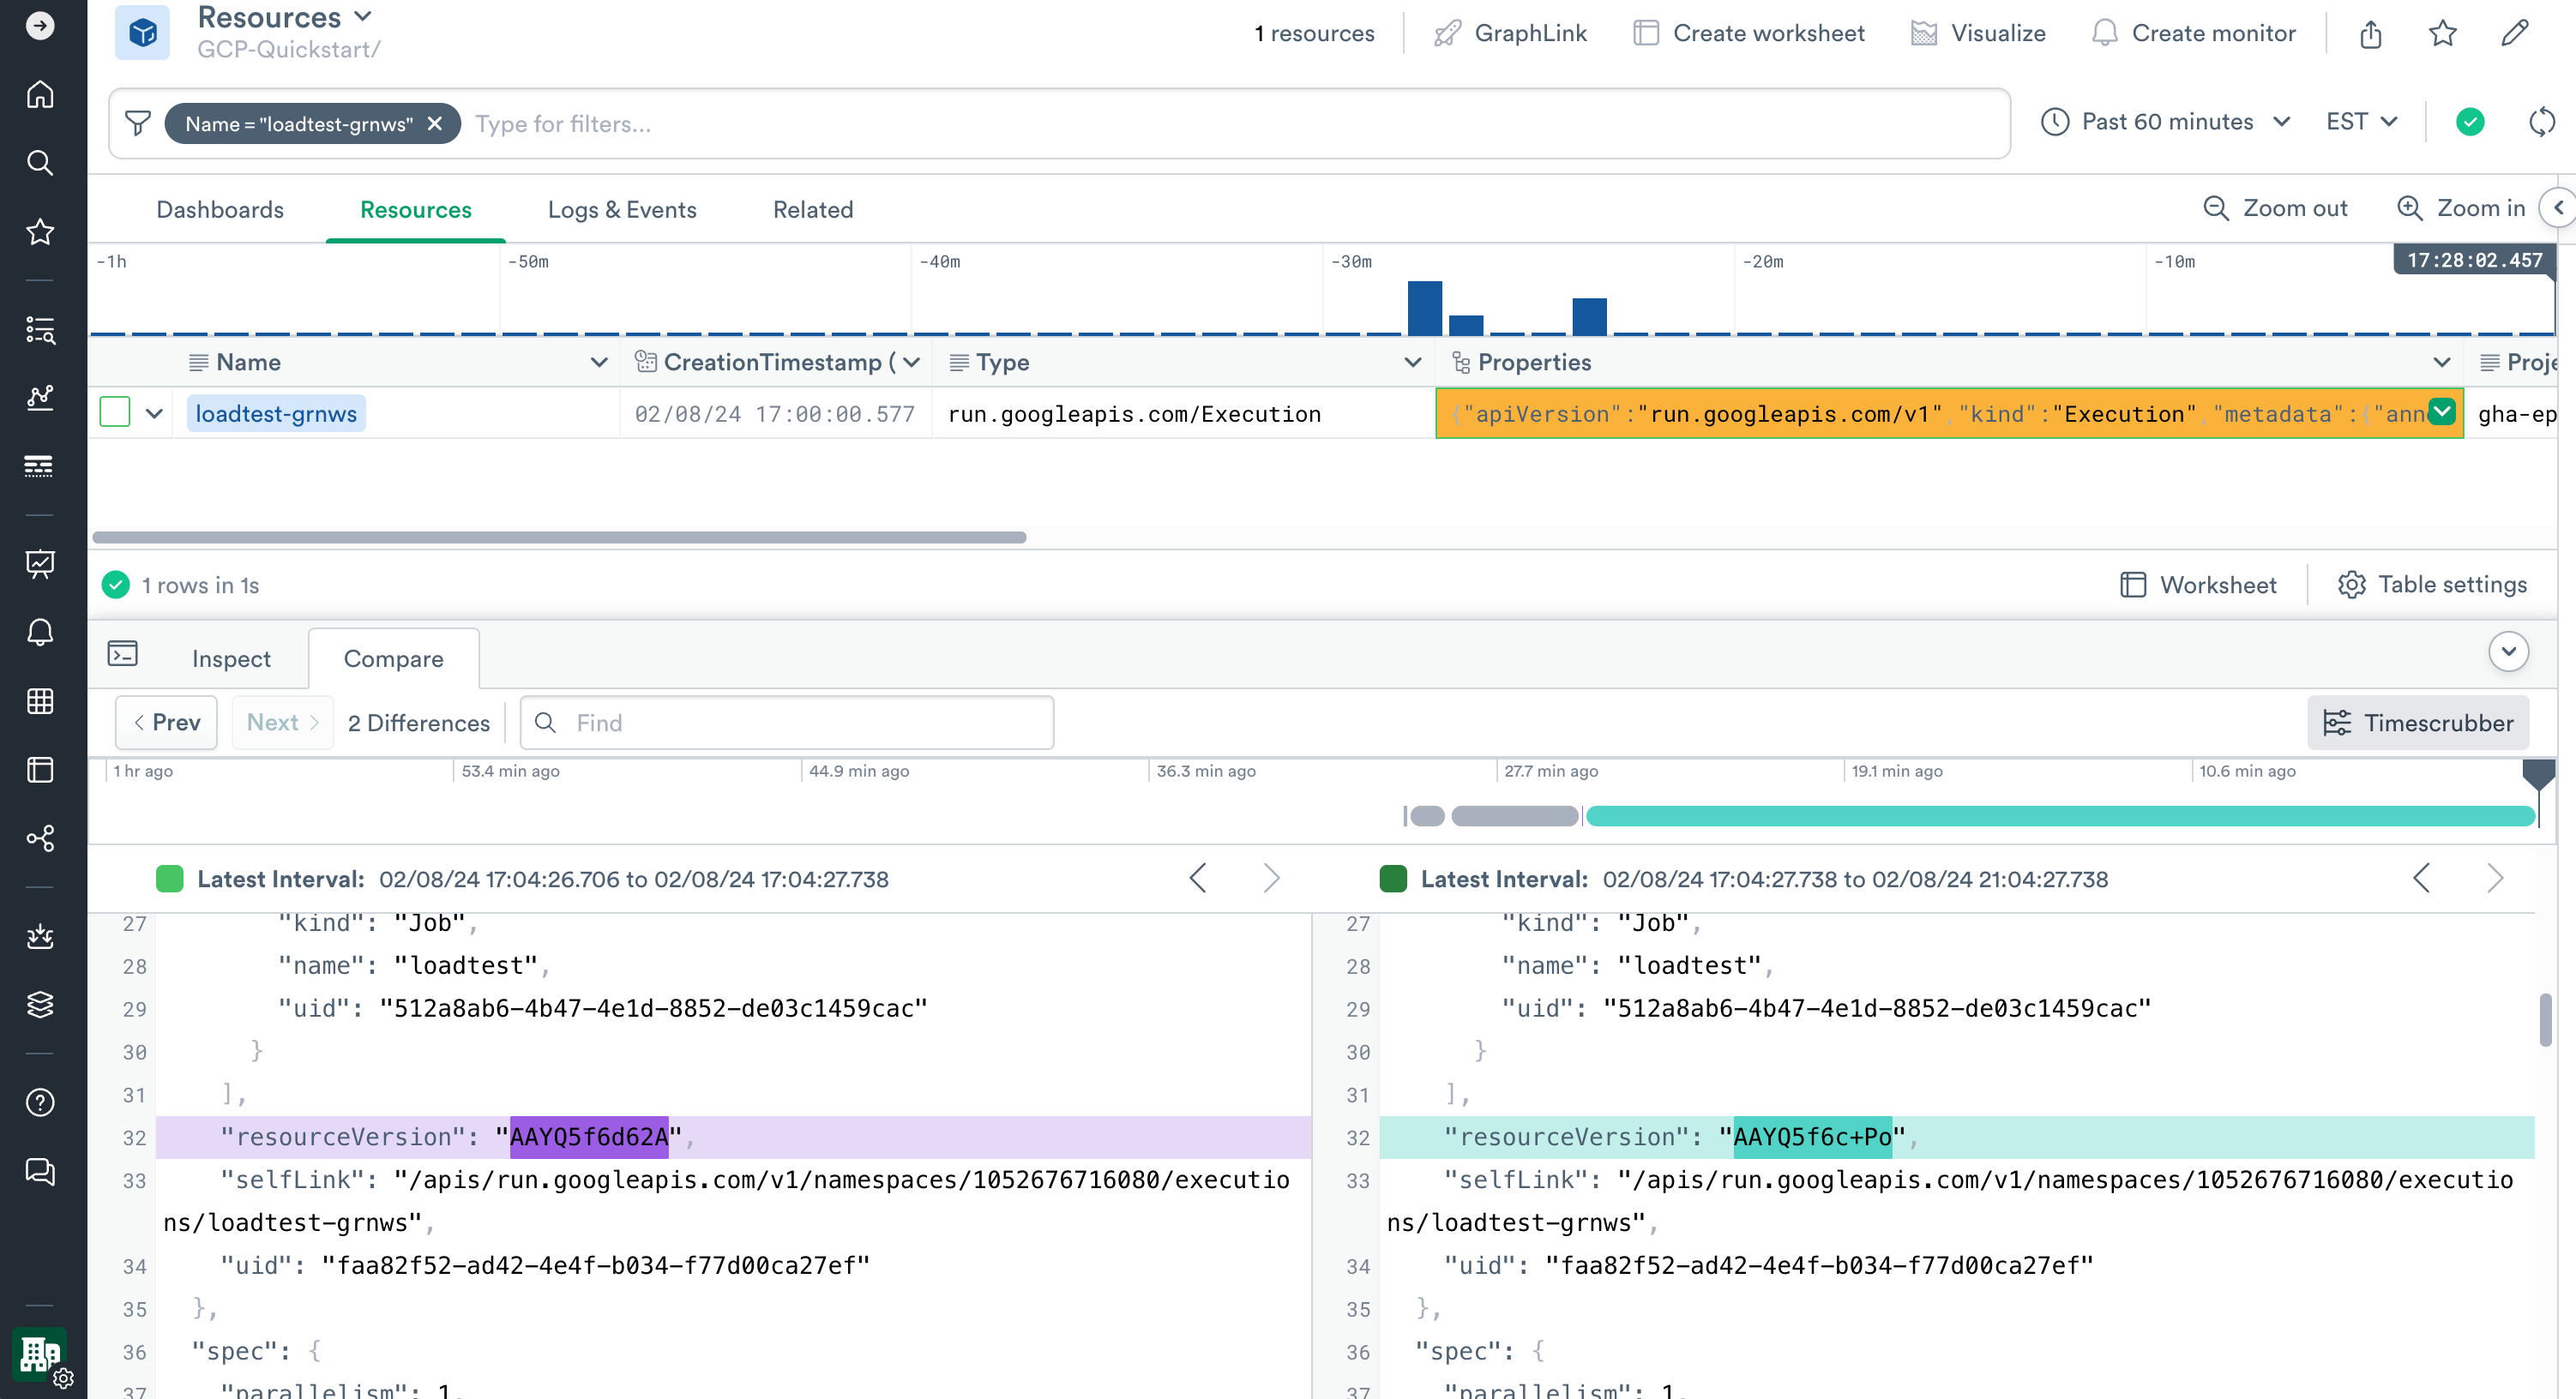
Perform detailed inspection of each resource, including inspecting property changes over time.
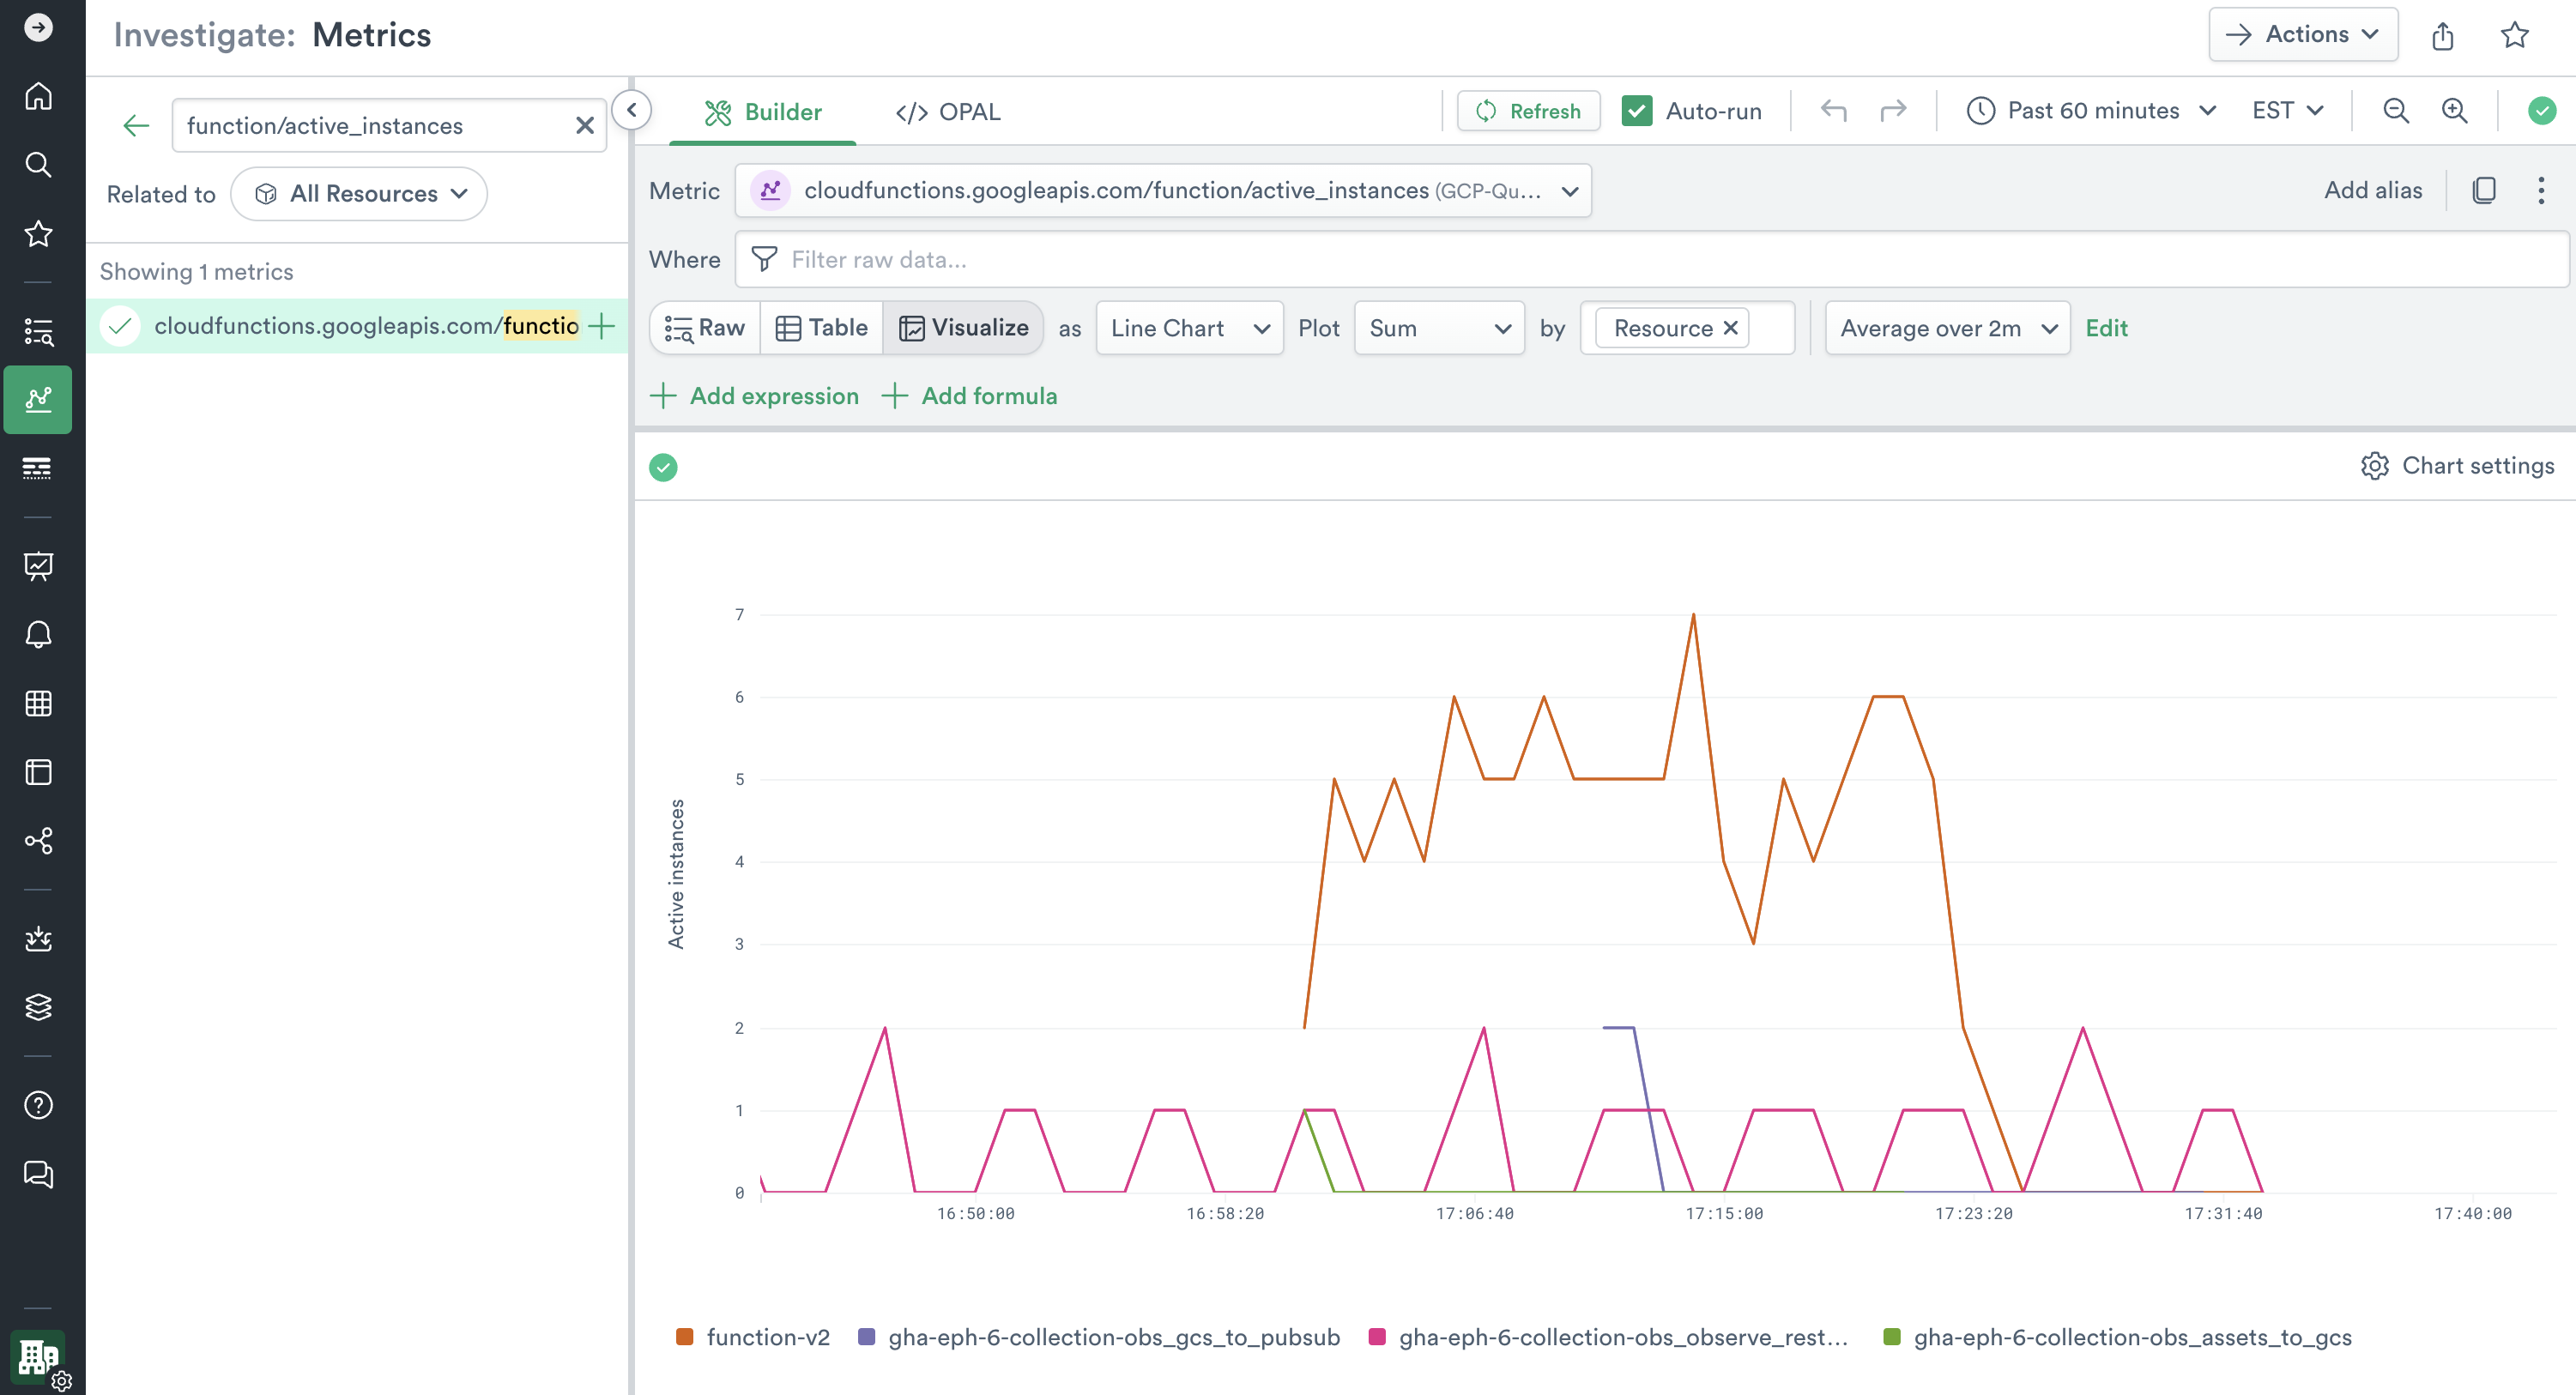
Metrics for GCP data
Use the Metric Explorer to filter, transform, and visualize metrics related to your Google Cloud environment. All metrics are prefixed and named according to the Google Cloud metric format specified in Google Cloud Documentation.
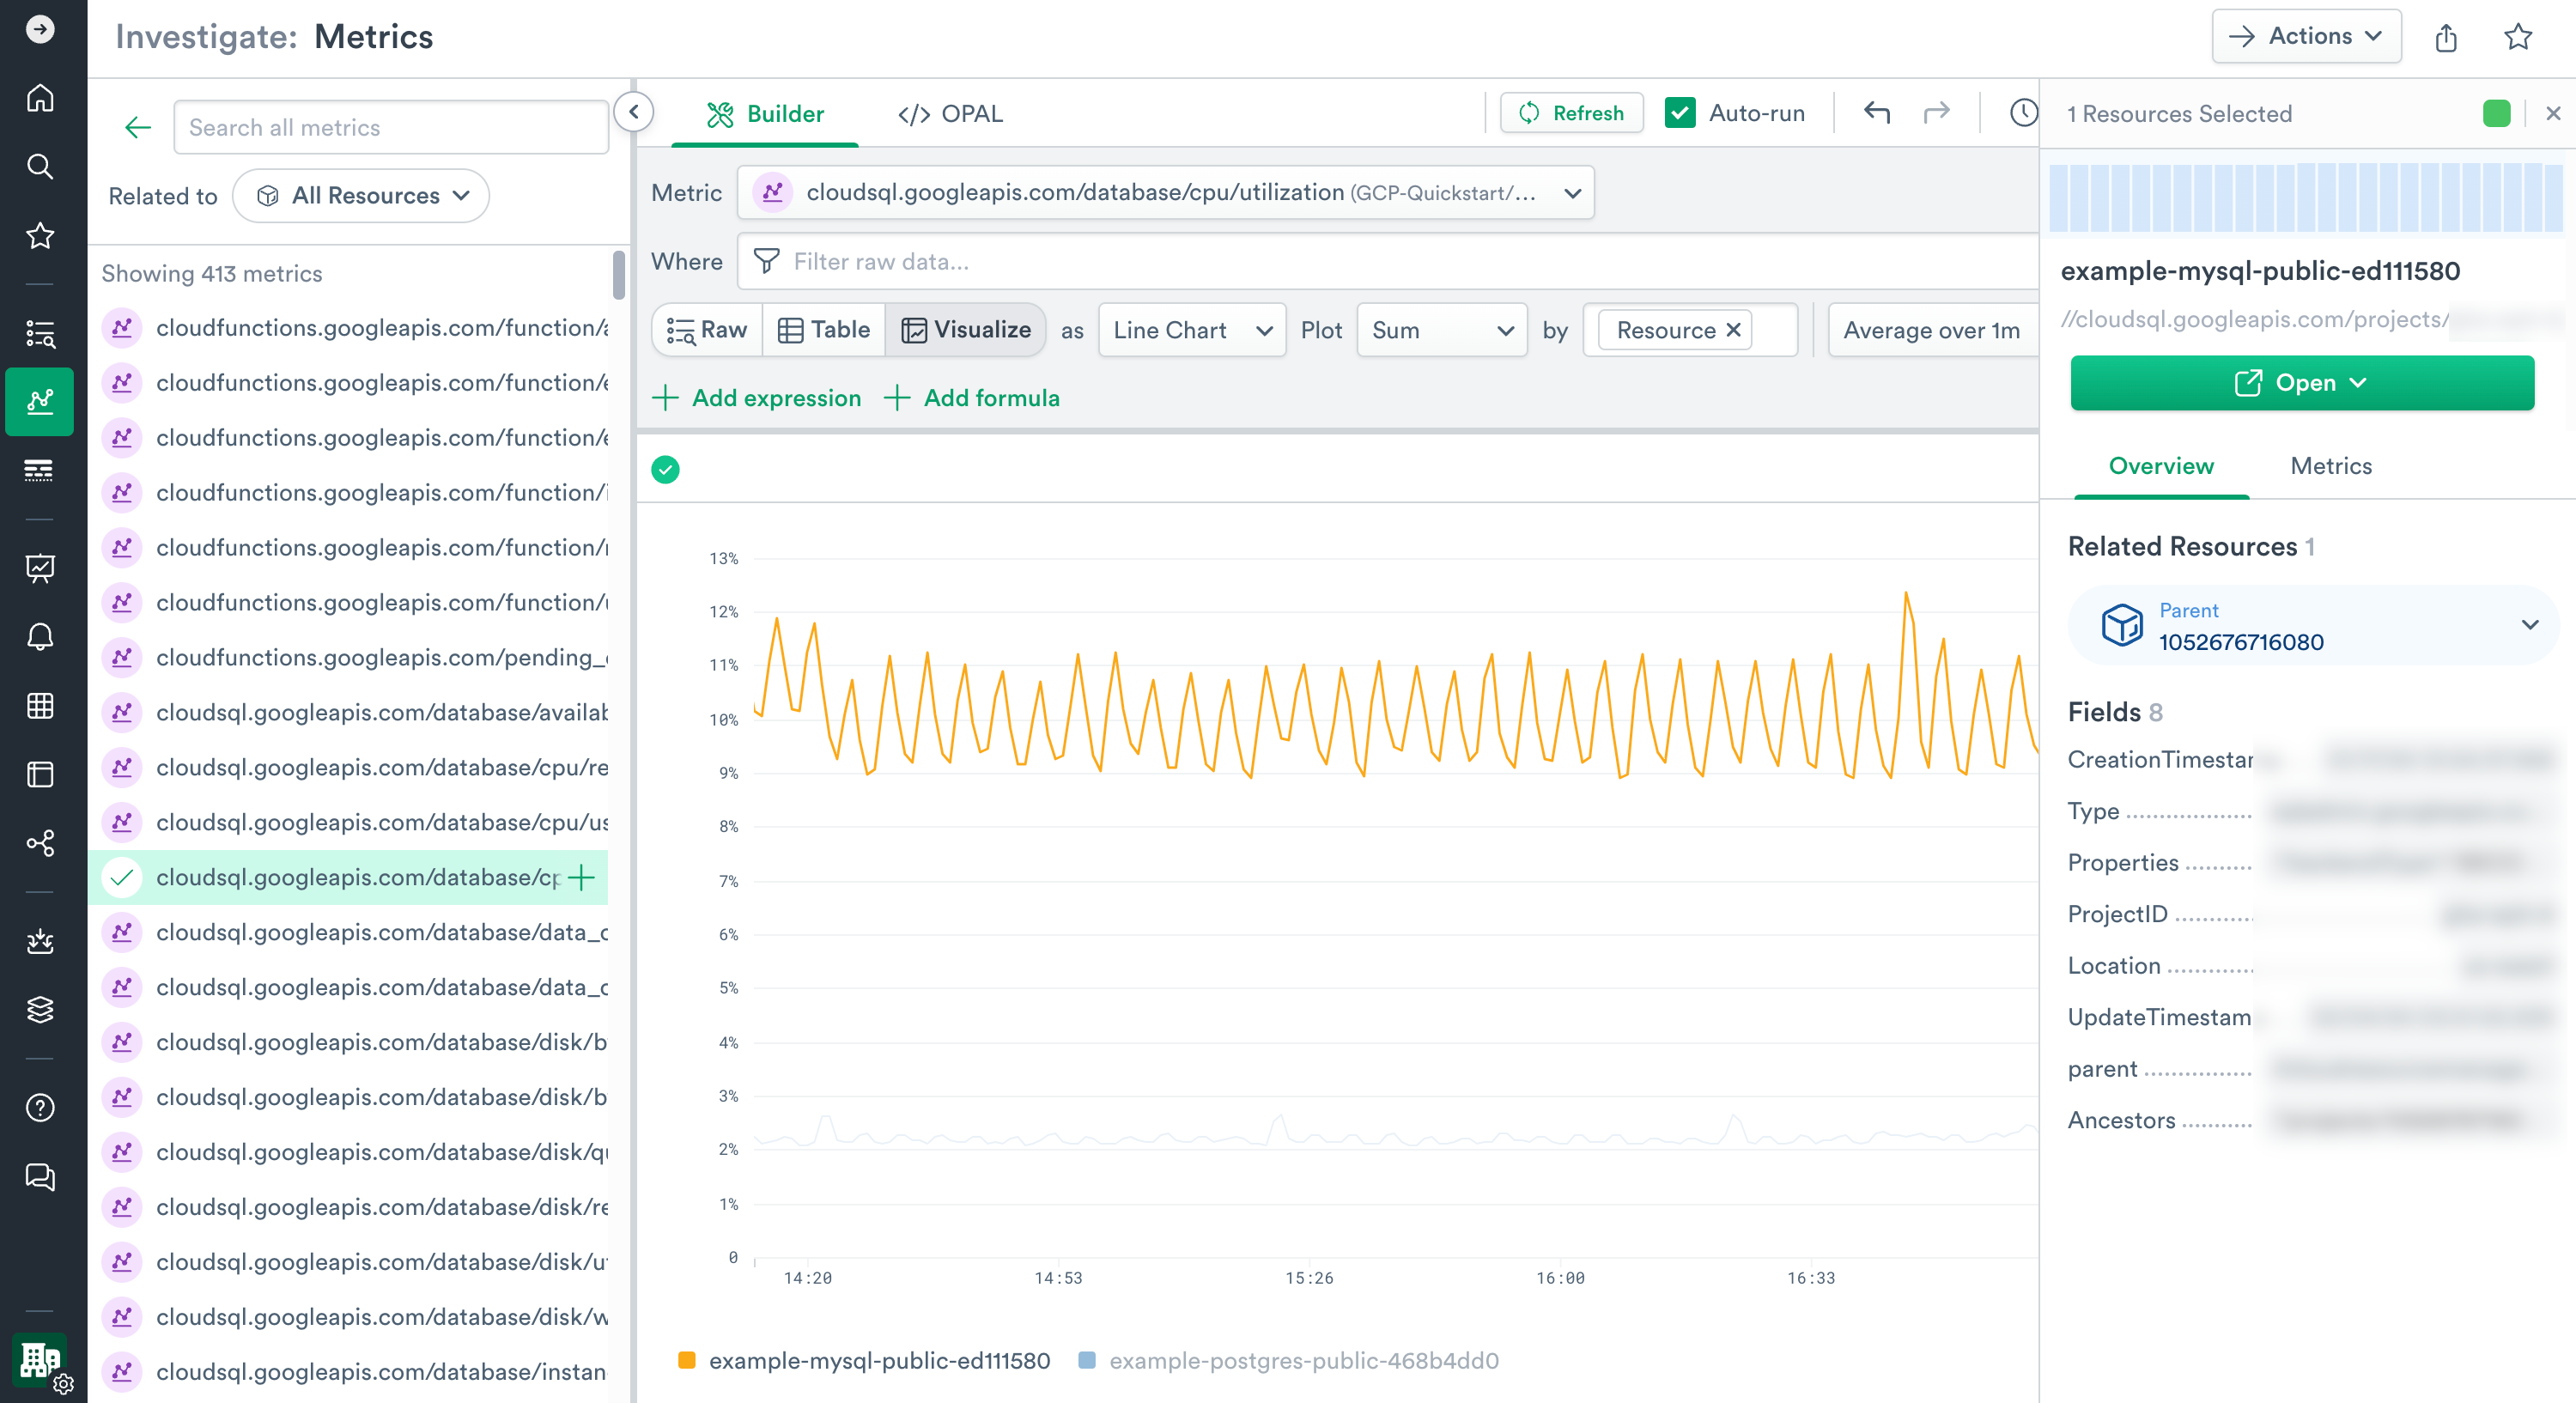
Select a metric time series and click on inspect to drill down into its associated resource.
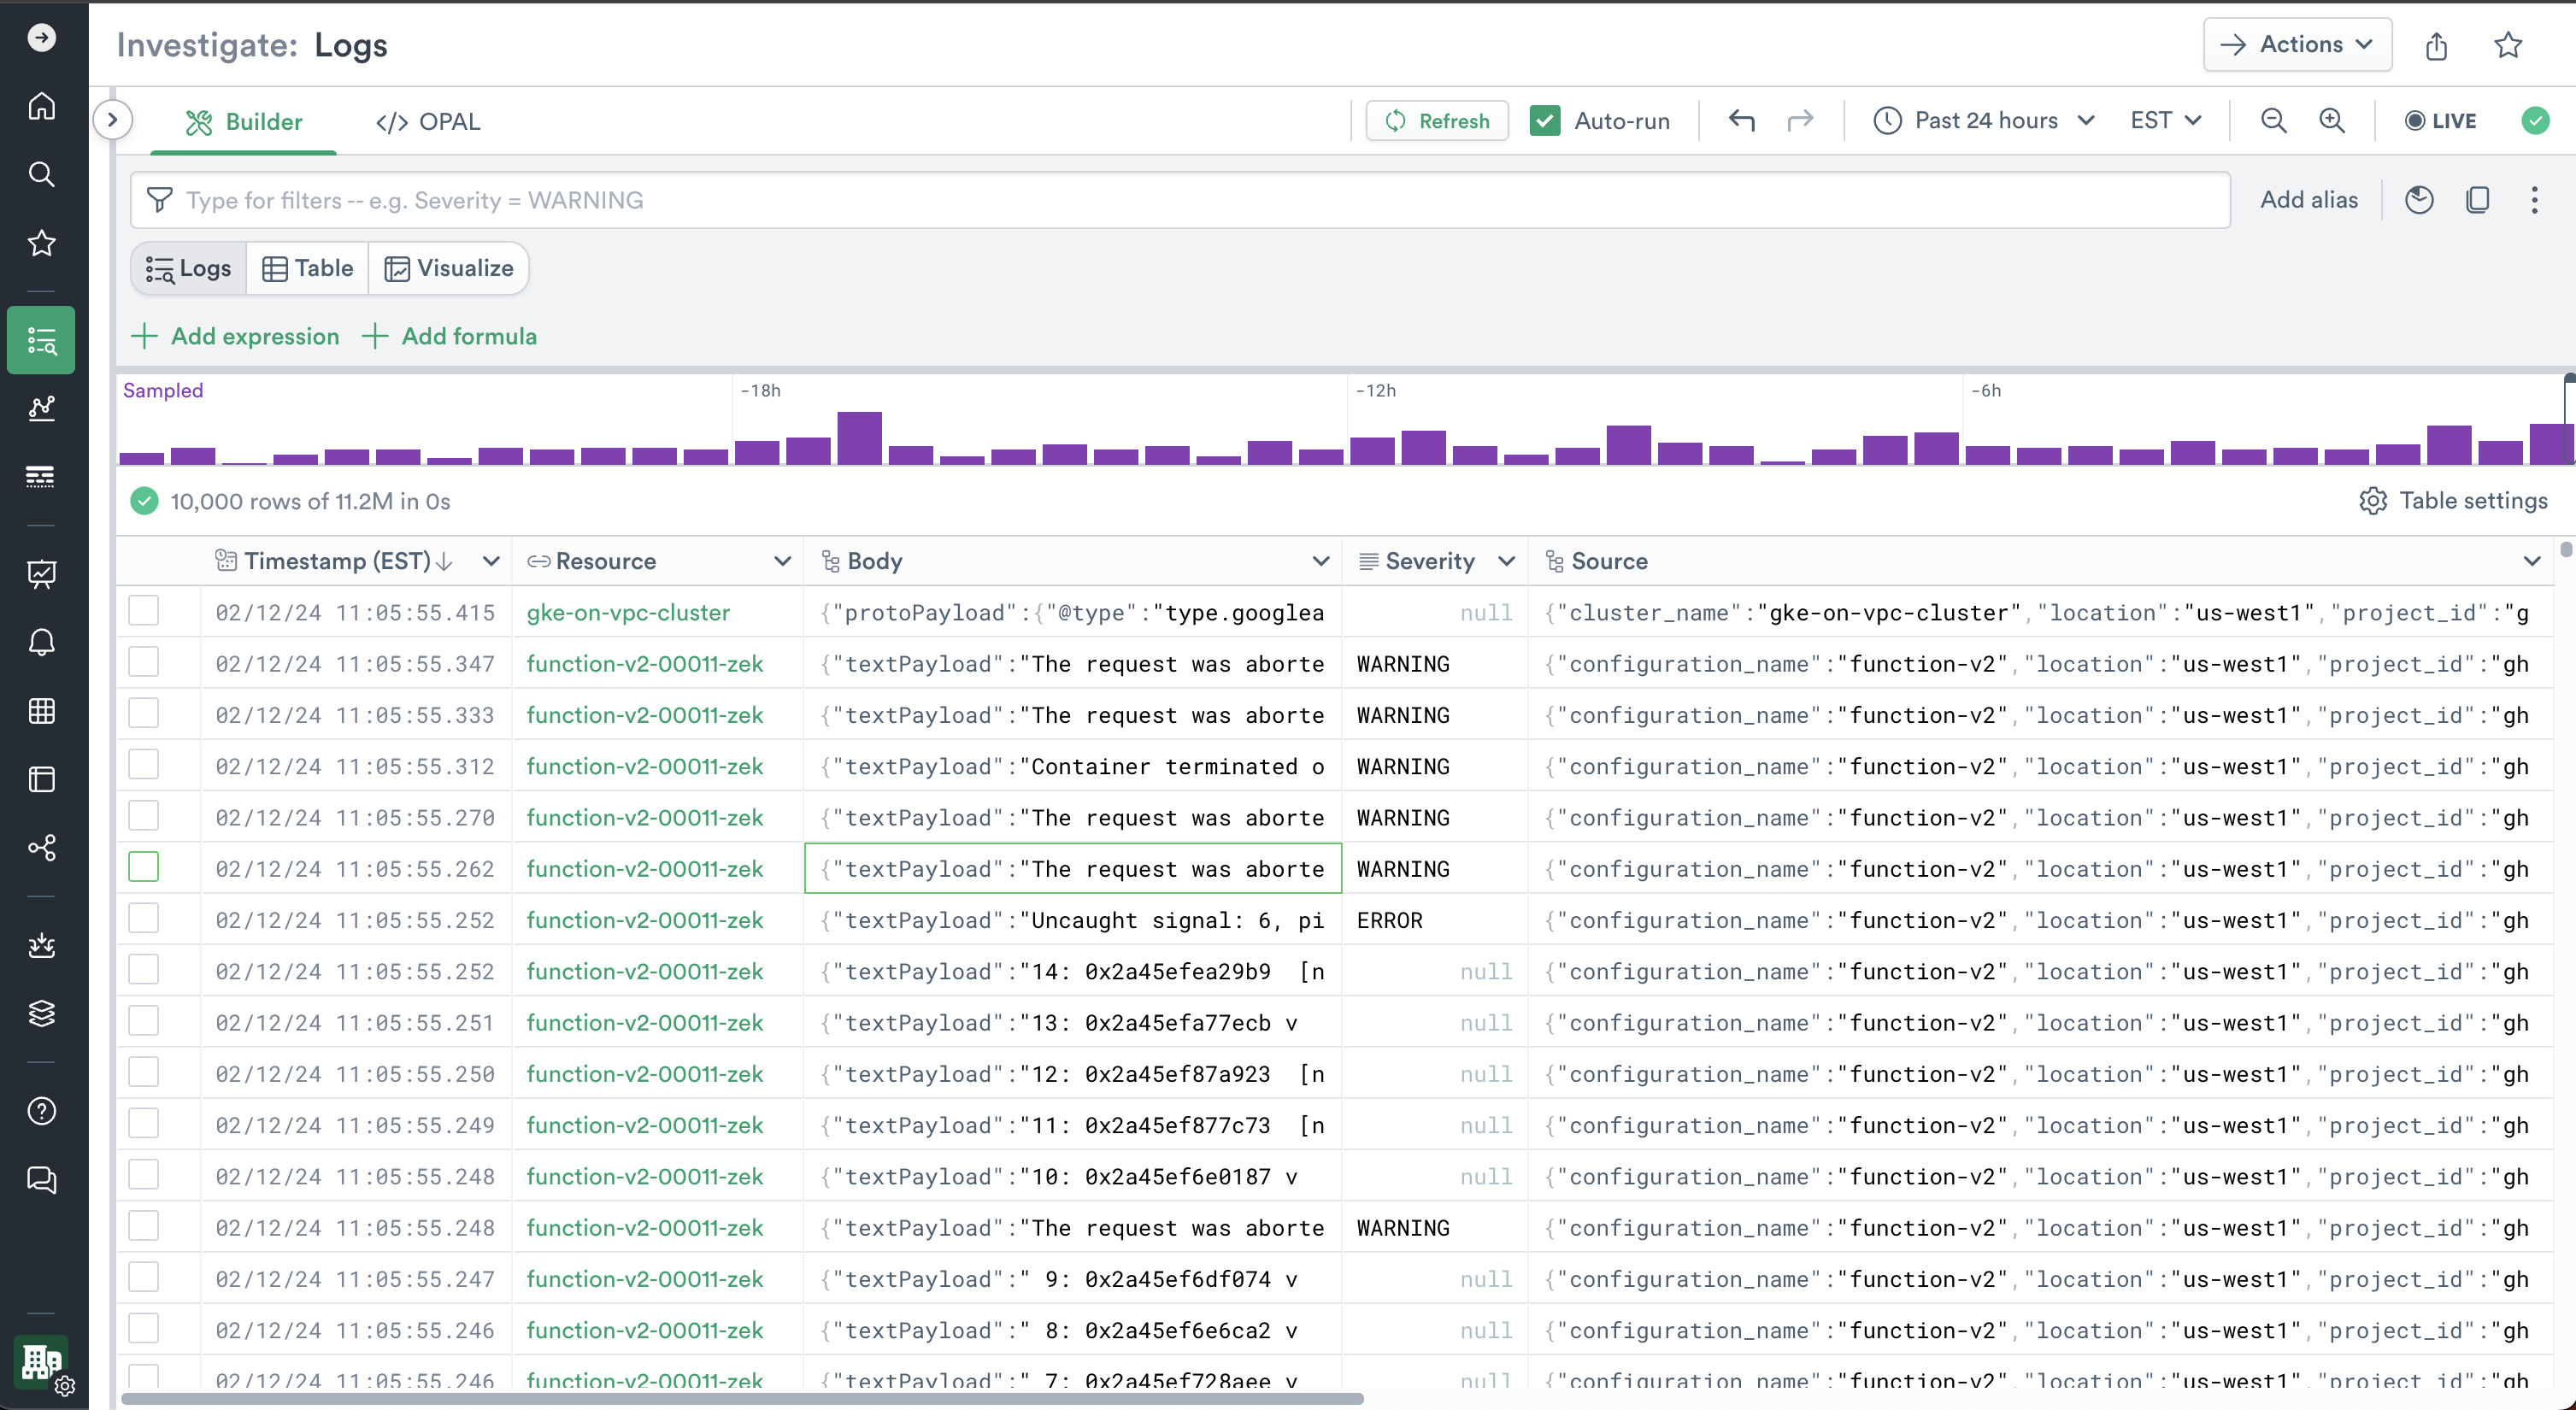
GCP data logs
Use the Log Explorer to filter, transform, and visualize logs related to your Google Cloud Environment.
The Body of a log event is determined by its sub-fields, protoPayload, jsonPayload and textPayload.
Typically, protoPayload is found in Audit Logs and jsonPayload can be found in structured logs emitted by services or libraries like Cloud Logging clients. Any unstructured message is classified as textPayload.
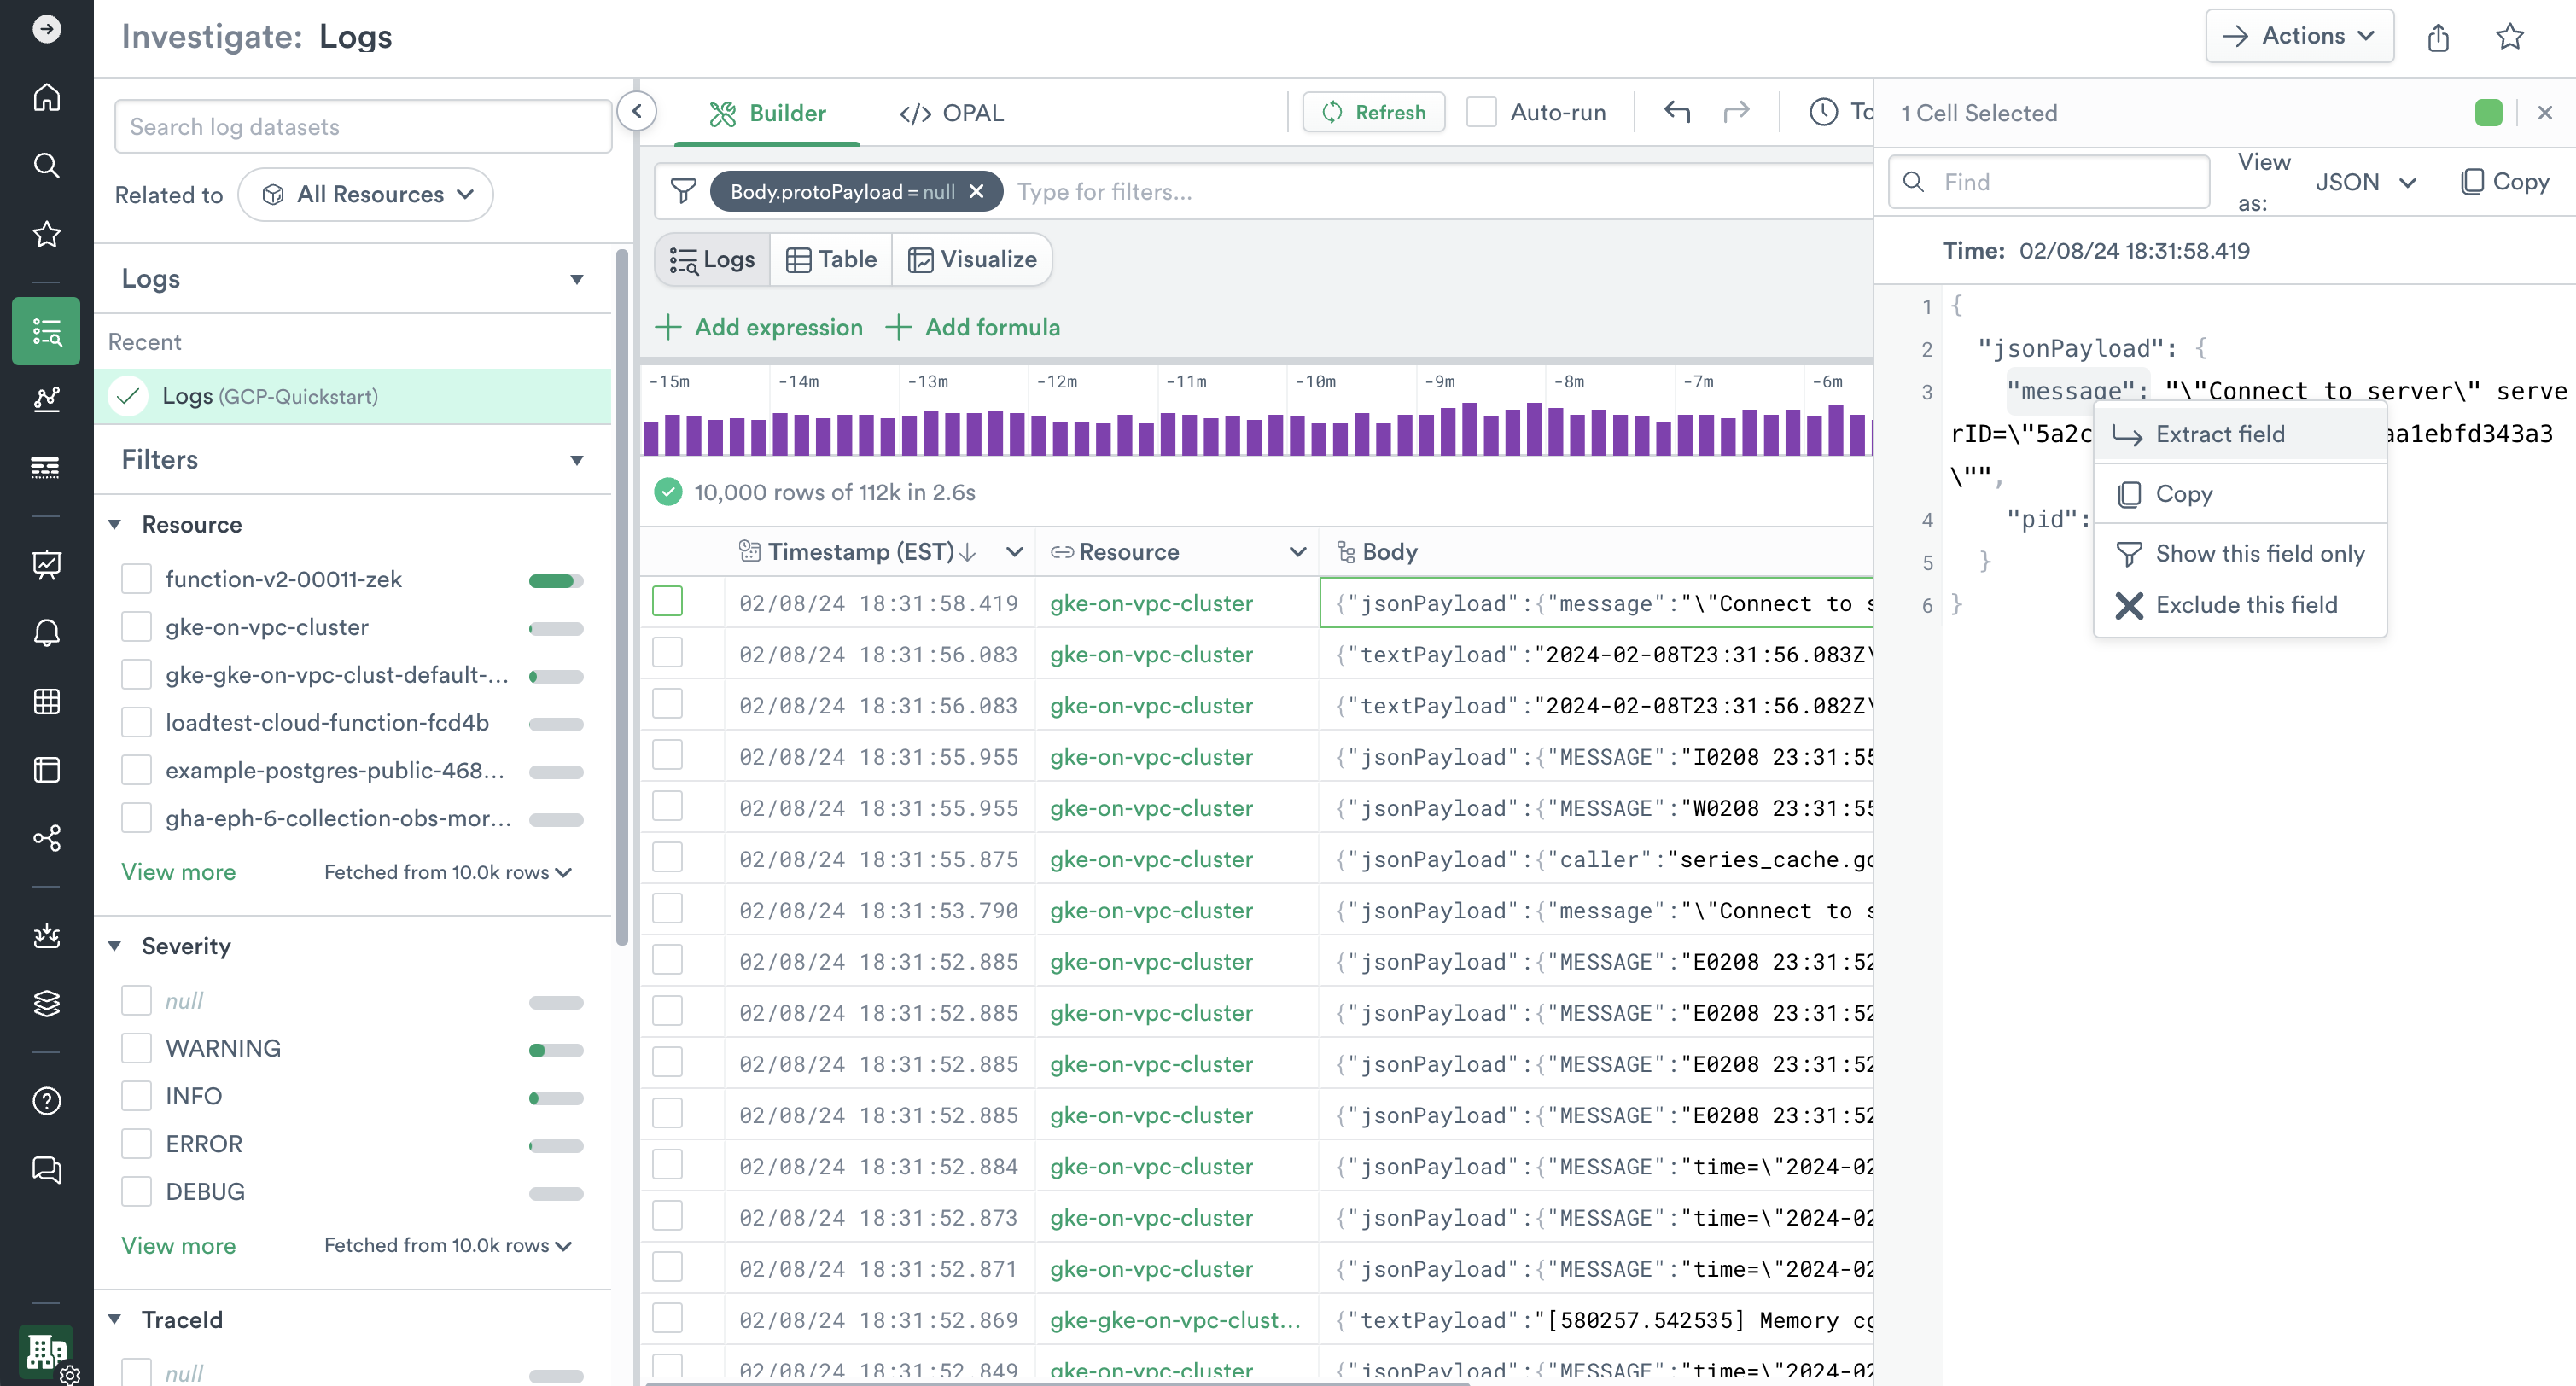
Inspect and extract fields from structure logs:
Updated 4 months ago