Release Notes July 07, 2023
Adding Thresholds to Dashboards
You specify a threshold value for a metric visually reflected in a dashboard. You can see when a metric meets or exceeds a threshold value.
Thresholds provide a method for you to conditionally style and color your visualizations based on query results. You can apply thresholds to most, but not all, visualizations.
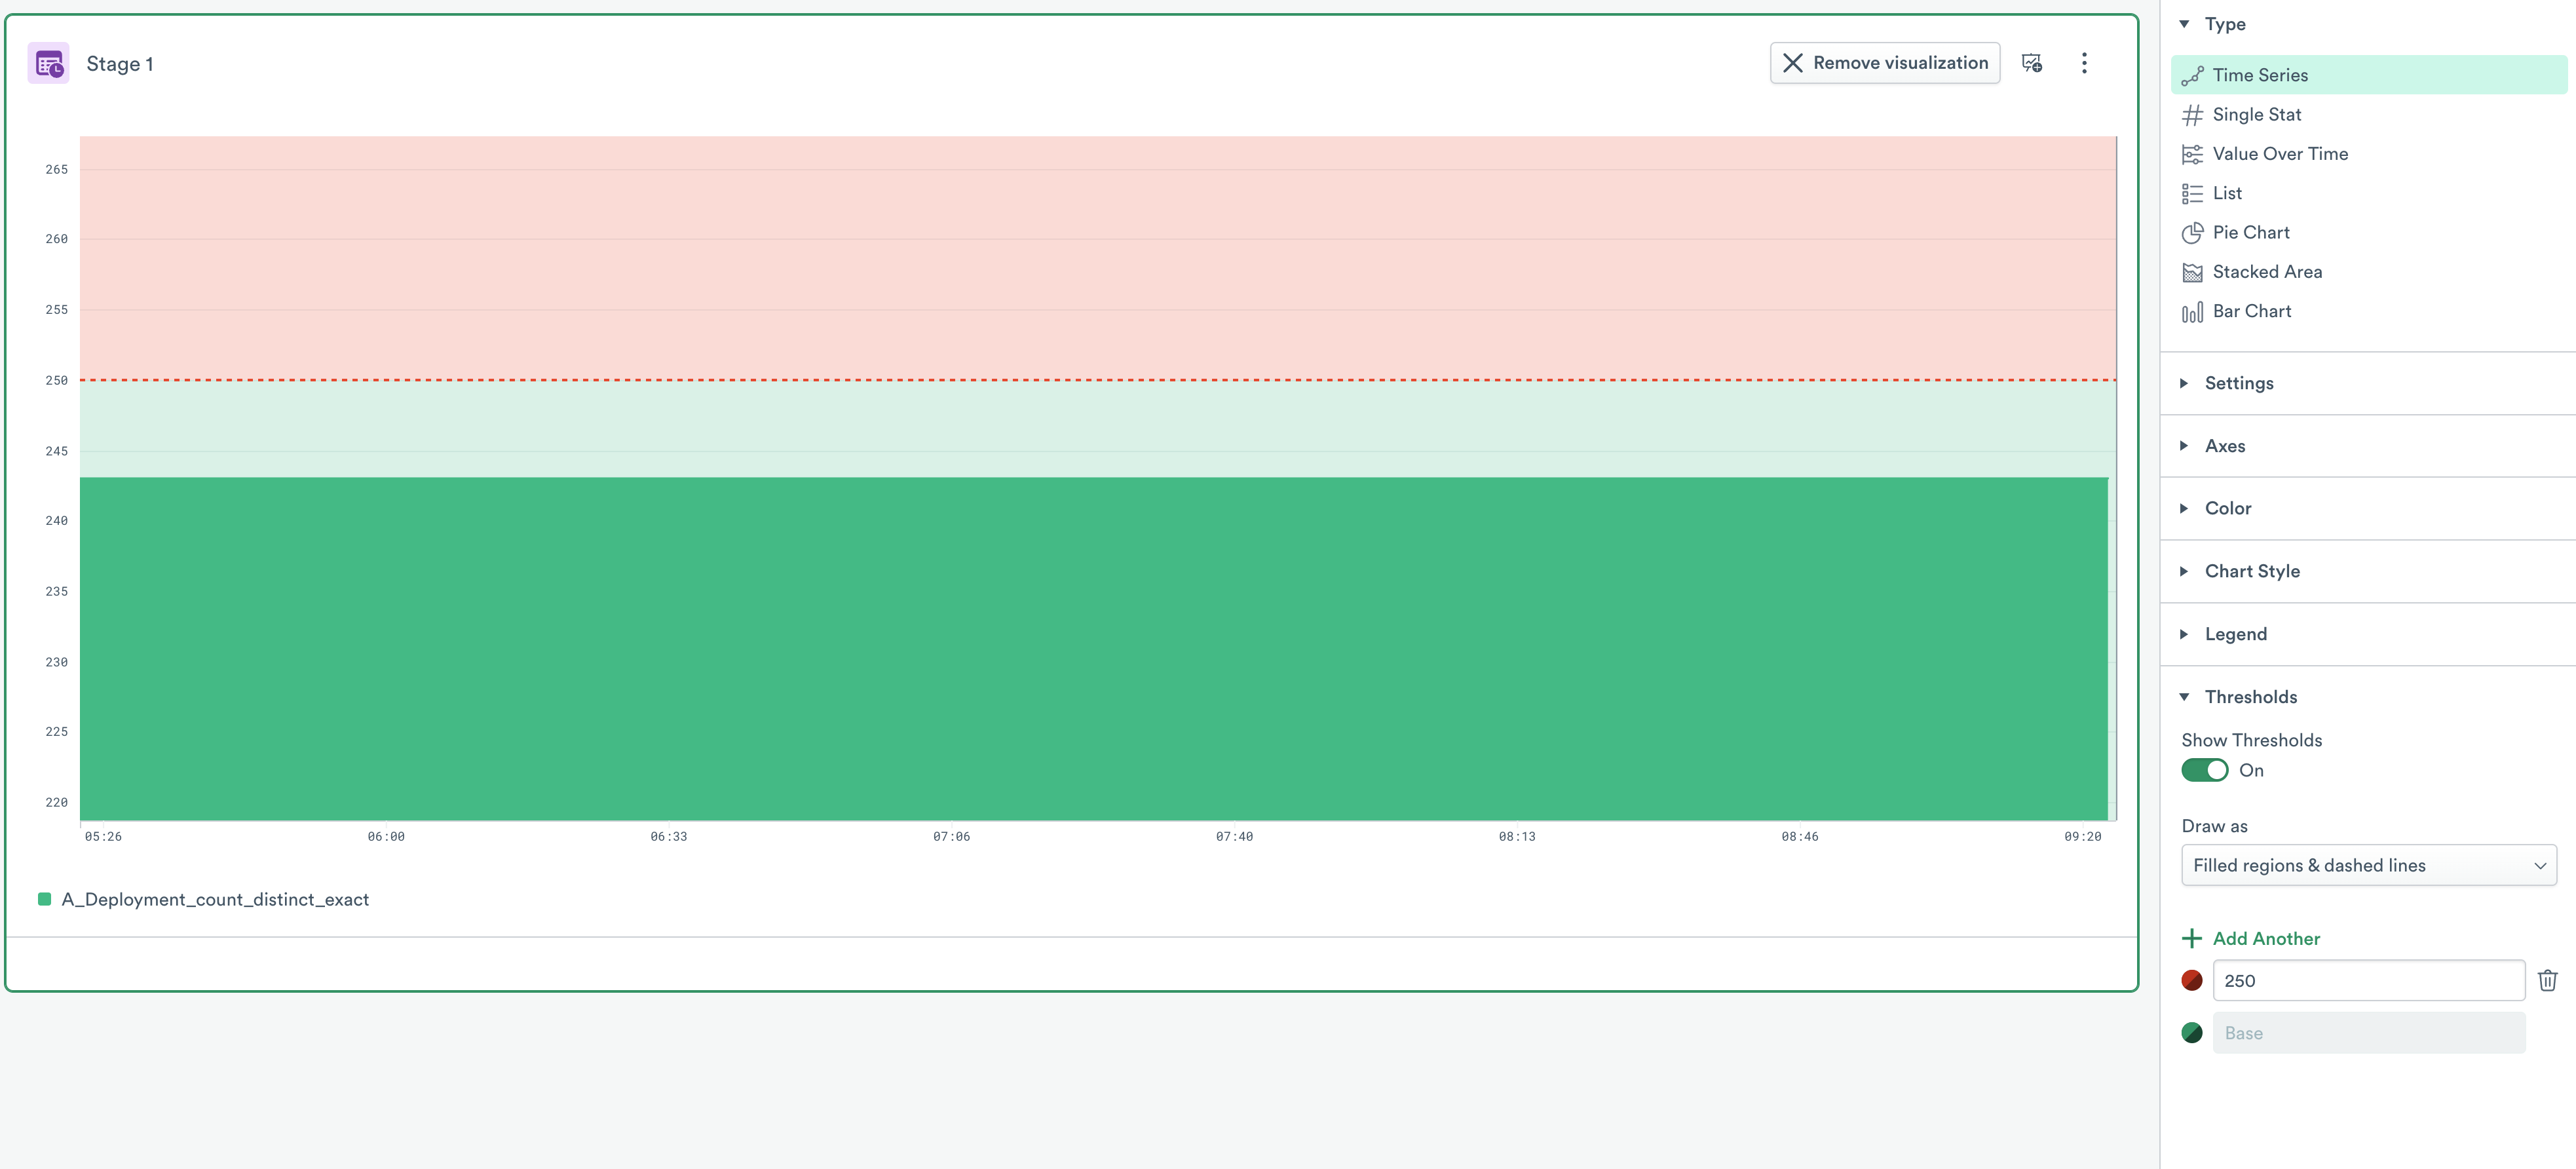
Figure 2 - Adding thresholds to a Dashboard card
To add Thresholds to your Dashboard, use the following steps:
On your Observe instance, click Explore. Observe displays Dashboards by default.
Select your Dashboard to add Thresholds.
Click the Pencil
 icon to edit the Dashboard.
From the Custom Visualization panel, click Presentation.
Under Thresholds, toggle the feature to On.
From the Draw as menu, select how you want to present your thresholds. You can choose from the following list:
Filled regions (Default)
Lines
Dashed lines
Filled regions & lines
Filled regions & dashed lines
7. Select the desired Threshold. In this case, for the Weather Metrics Dashboard, you can select a Threshold value of 50 degrees.
8. Click Apply.
9. Click Save dashboard to keep your changes.
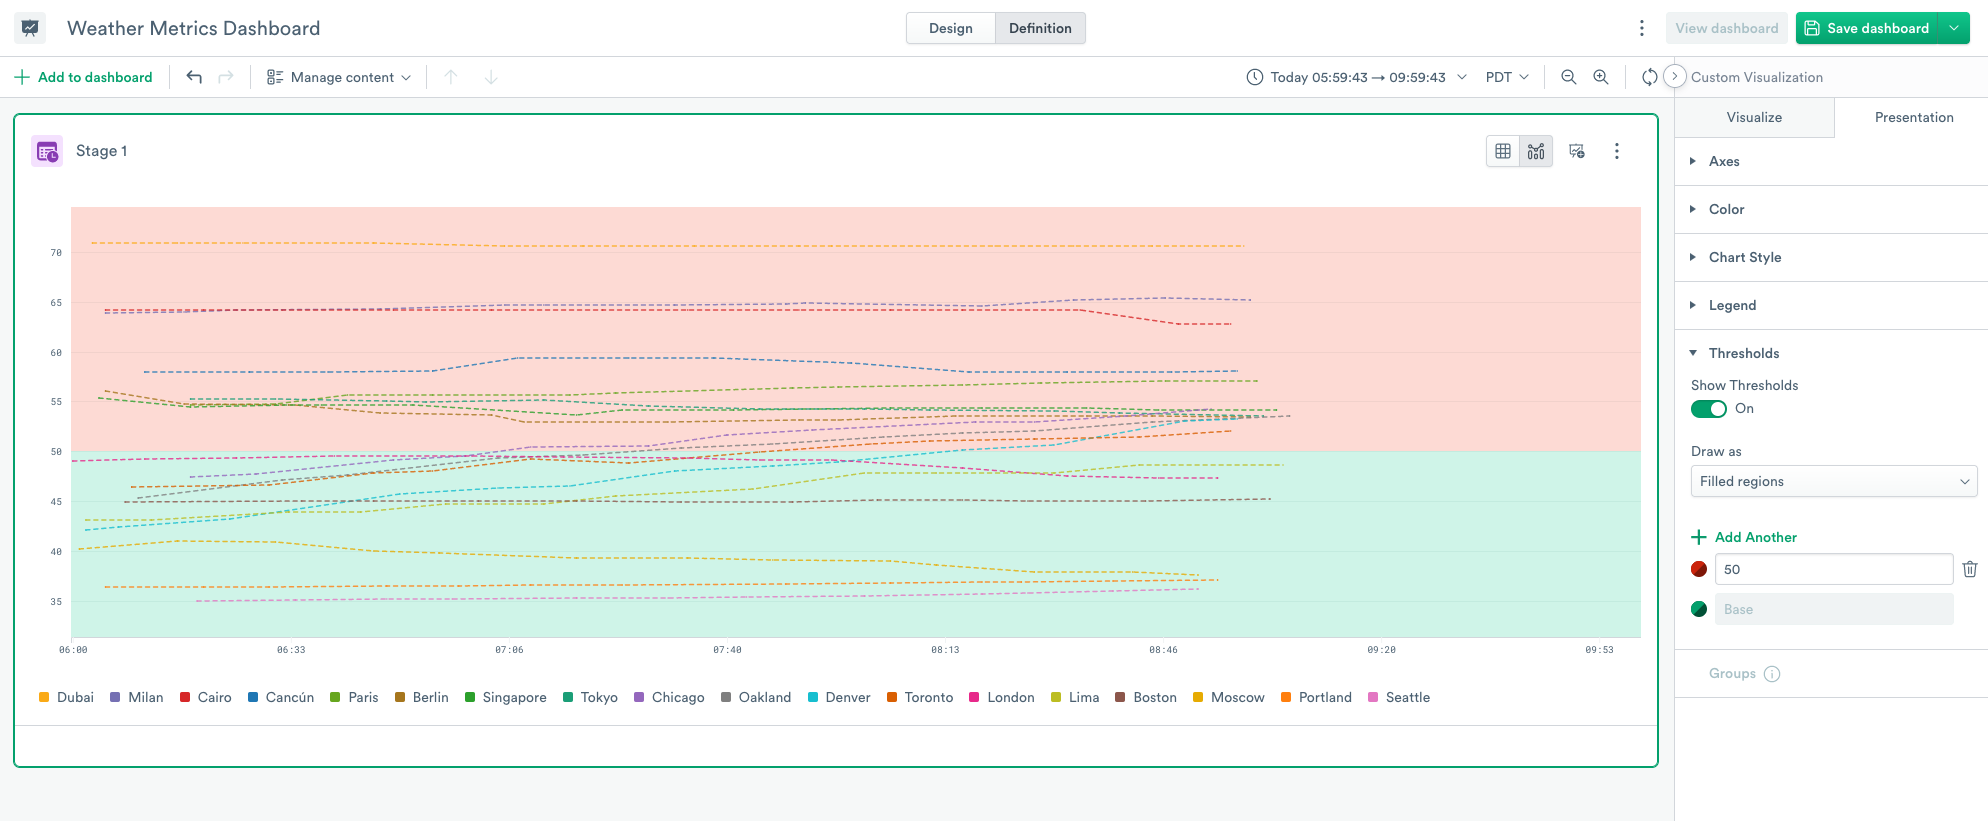
Figure 1 - Adding thresholds to a Weather Metrics Dashboard
Modeling Metadata into Metric Datasets
You can model a metric dataset and then define metrics using the OPAL verb, set_metric, to provide the metric description, type, and unit. New metrics that’s not defined using set_metricmay not contain this information and may not be useful in the modeling process.
To solve this issue, you can now include metadata in the metric dataset.
To include metadata with metrics, add three optional columns to metric datasets using the following OPAL:
interface "metric", metricType:type, metricUnit:unit, metricDescription:description
The metric dataset now picks up metadata in these columns.
Some metric providers, such as Google Cloud Platform (GCP), provide metric metadata with every metric point. Use the existing metadata to populate the new columns.
Other providers, such as Prometheus, provide metadata separately from the metric. Extract the metadata and then create a union with the metrics dataset. You then have a final dataset similar to this table:
Metric |
Value |
Tag |
Type |
Unit |
Description |
|---|---|---|---|---|---|
metricA |
|
|
null |
null |
null |
metricA |
null |
null |
|
|
Number of seconds spent waiting |
The first row contains the metric point and the second row contains the metadata for the metric.
OPAL Language Updates
No OPAL updates this week.