GCP Cloud Run
Cloud Run is a managed serverless computing platform that abstracts away all infrastructure management and enables you to run containers invocable through requests or events.
Observe helps you monitor the health and activity of your Cloud Run environments with the following features:
Datasets containing details of Cloud Run Services and Revisions in a specific GCP project, the state, and other attributes.
Dashboard for services and revisions with details about configurations such as container images, metrics, and other metadata.
Additionally, from services, you would also be able to see relevant revision information, such as the latest revision, and traffic distribution.
Links between services and revisions, and respectively to the logs, as well as links to associated CloudSQL instances, if any, from revisions.
Viewing Cloud Run Activity in Observe
Services
To see details of a Cloud Run Service, go to the Cloud Run Service dataset in Observe. To monitor a specific service instance, select a row using the checkbox, and in the right menu, click on Open to navigate to the Cloud Run Service Instance dashboard.
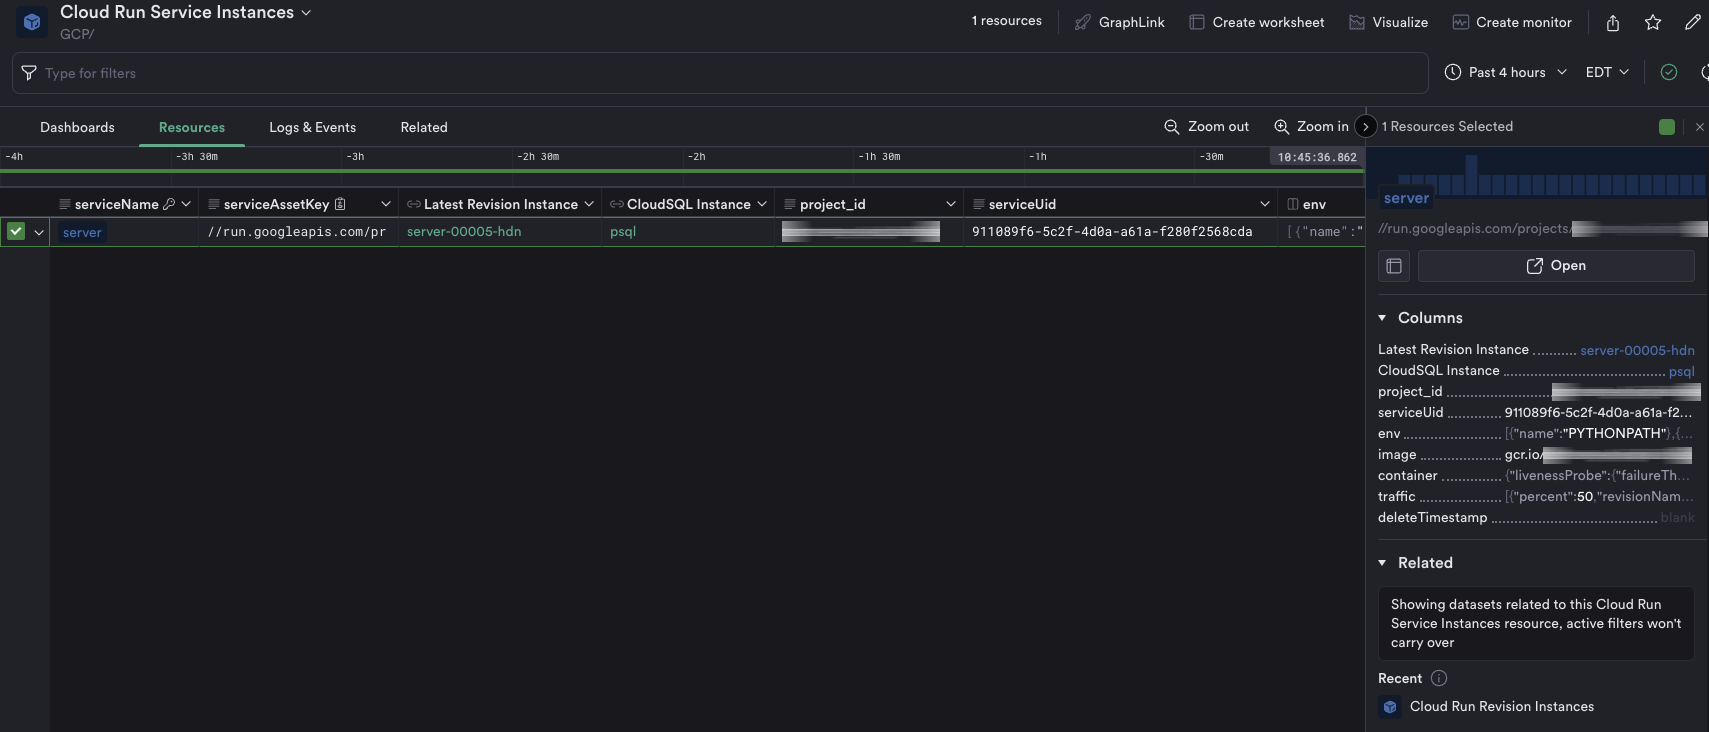
Figure 1 - Cloud Run Services Detected by Observe.
The dashboard contains information about the current service under investigation. Use it to answer questions such as the following:
How many revisions does this service have?
Which of the revisions started serving traffic?
What is the health of each revision?
What do metrics look like, across all revisions related to this service?
The top section includes information about revisions associated with the service, and some health indicators. Each revision row can be highlighted to bring up details and links to the corresponding revision.
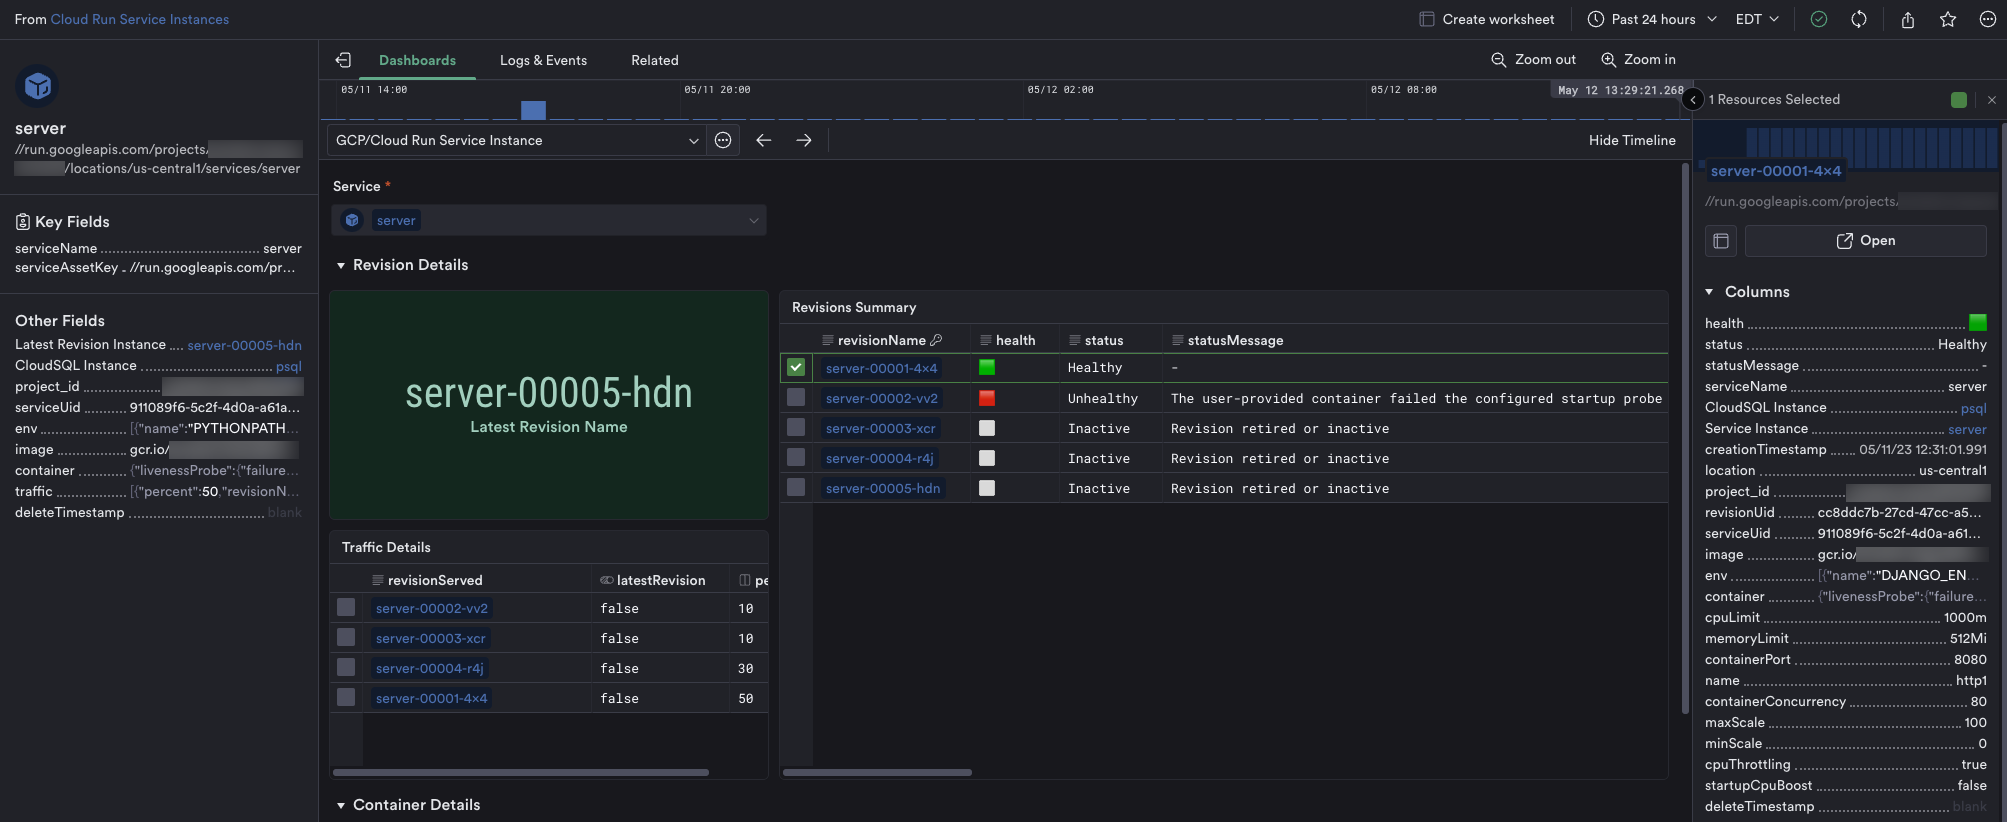
Figure 2 - Cloud Run Service Instance Dashboard (details).
Furthermore, this dashboard includes metrics relevant to the current monitored service.
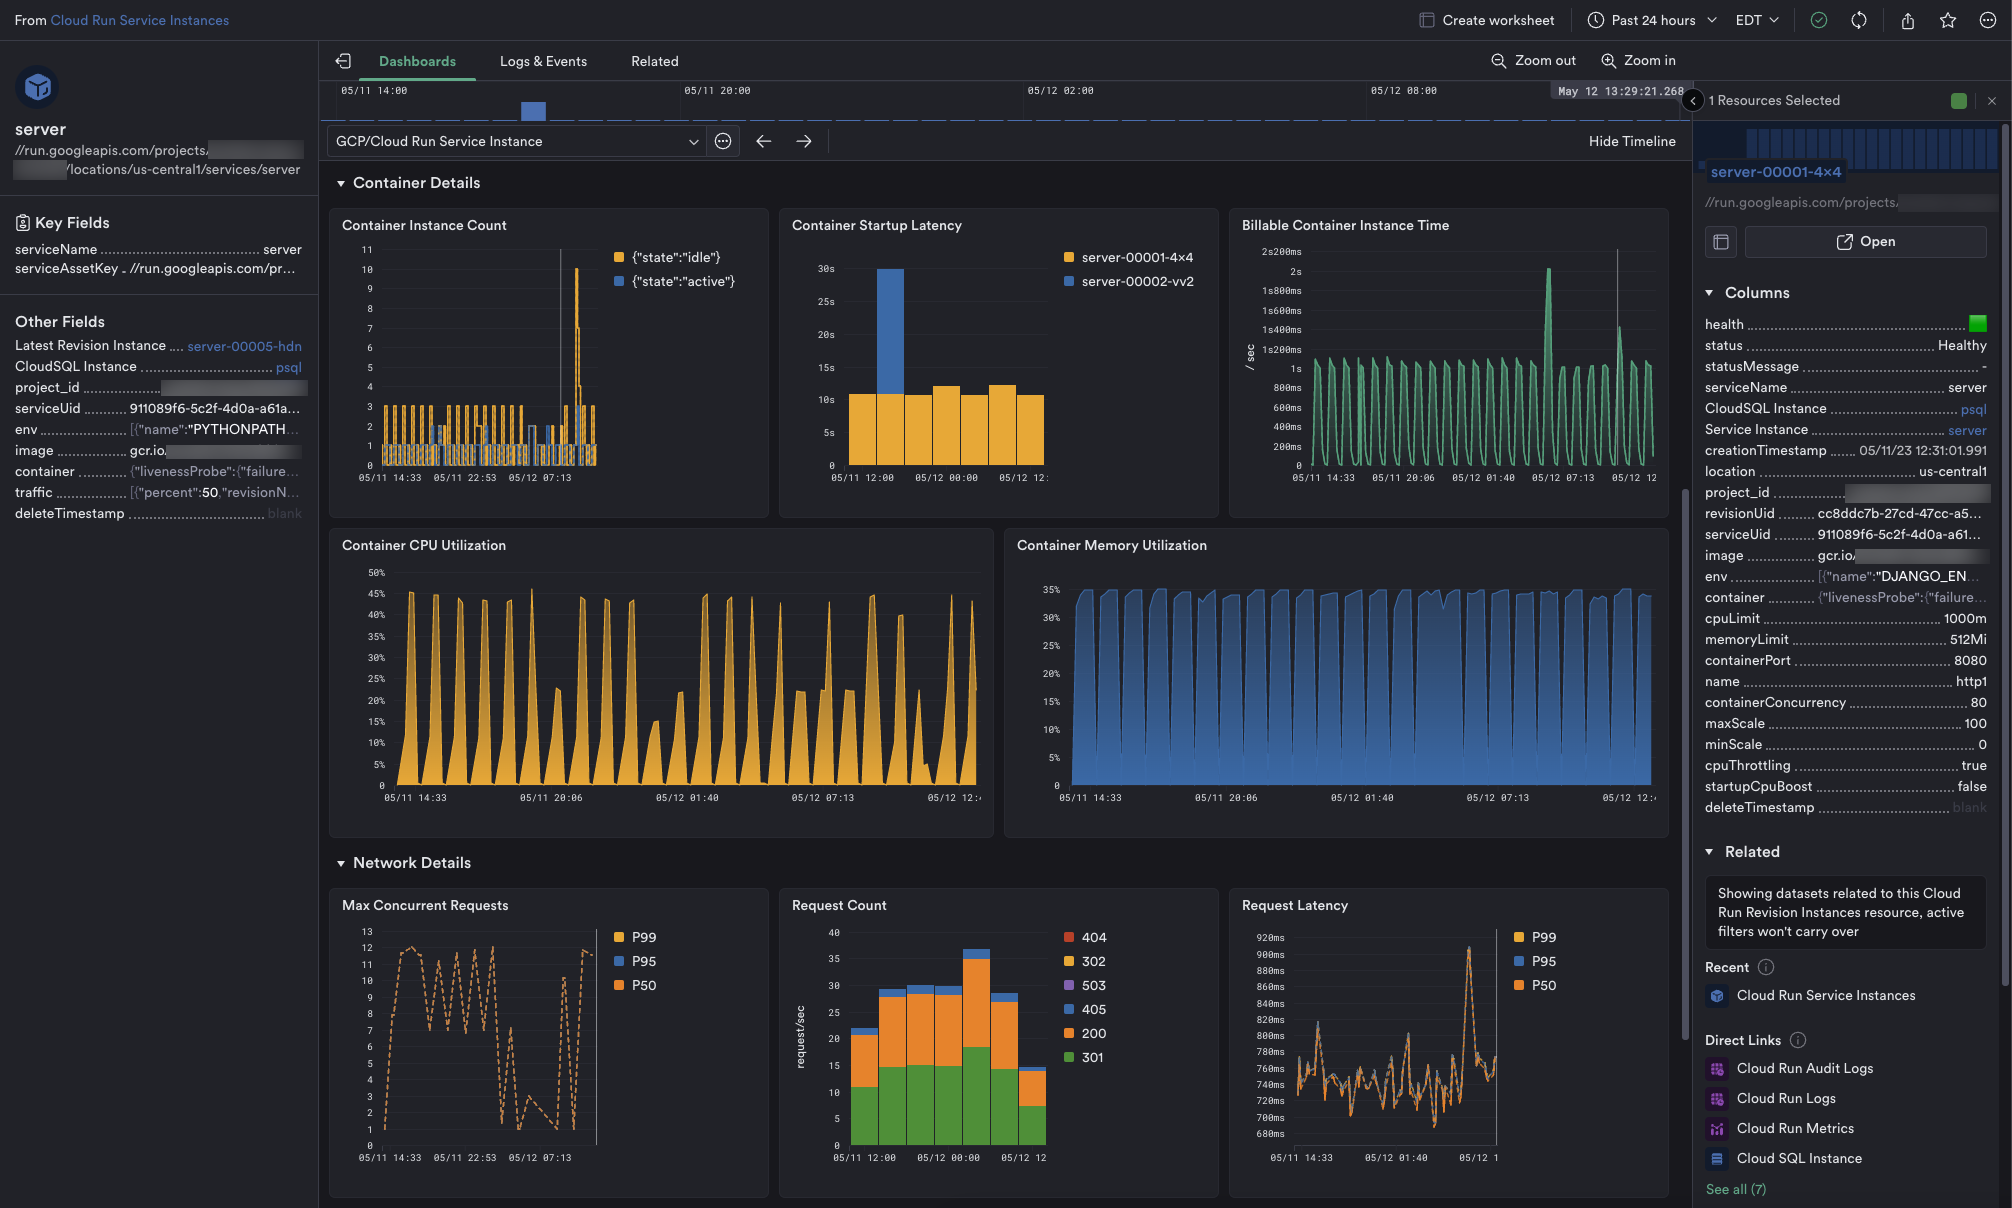
Figure 3 - Cloud Run Service Instance Dashboard (metrics).
Revisions
To see details of a Cloud Run Revision, go to the Cloud Run Revision dataset in Observe. To monitor a specific revision instance, select a row using the checkbox, and in the right menu, click Open to navigate to the Cloud Run Revision Instance dashboard.
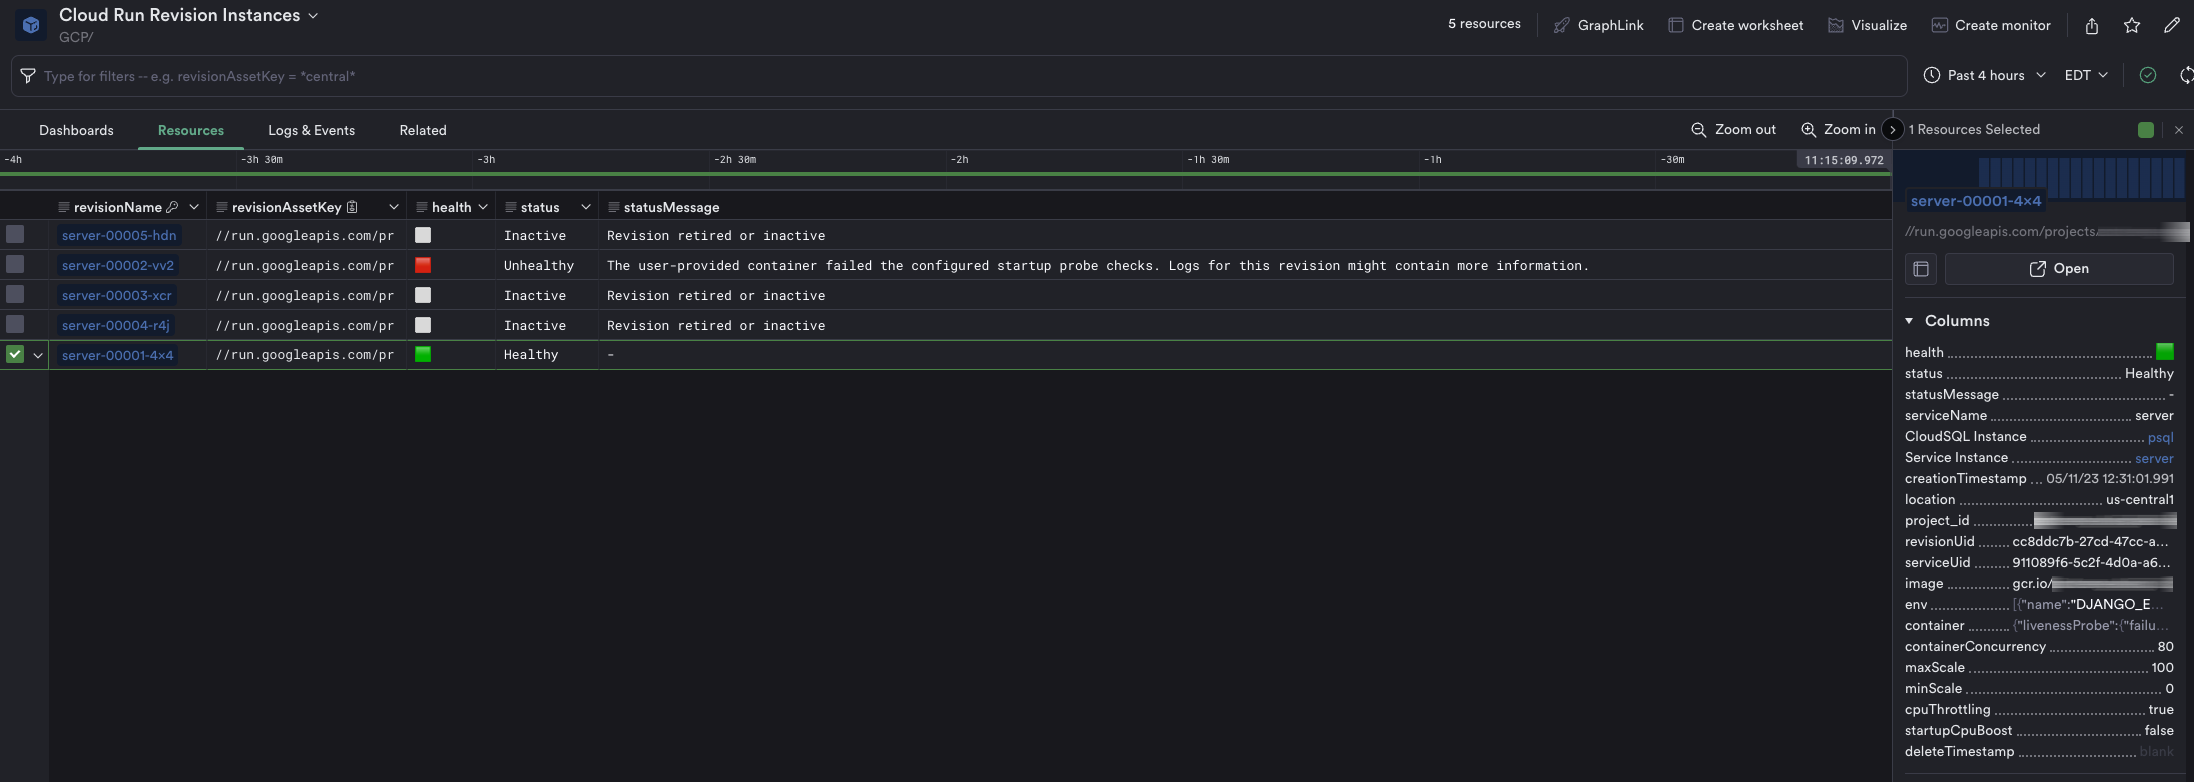
Figure 4 - Cloud Run Revisions Detected by Observe.
The dashboard contains information about the current revision being investigated. Use it to answer questions such as:
Is this revision healthy?
What does its configuration look like?
How is it performing with respect to traffic?
What are the slowest requests this revision served?
What are the errors this revision encountered?
The top section includes information about the revision’s health and status indicators along with some configuration information, and crucial metrics such as CPU and memory utilization.
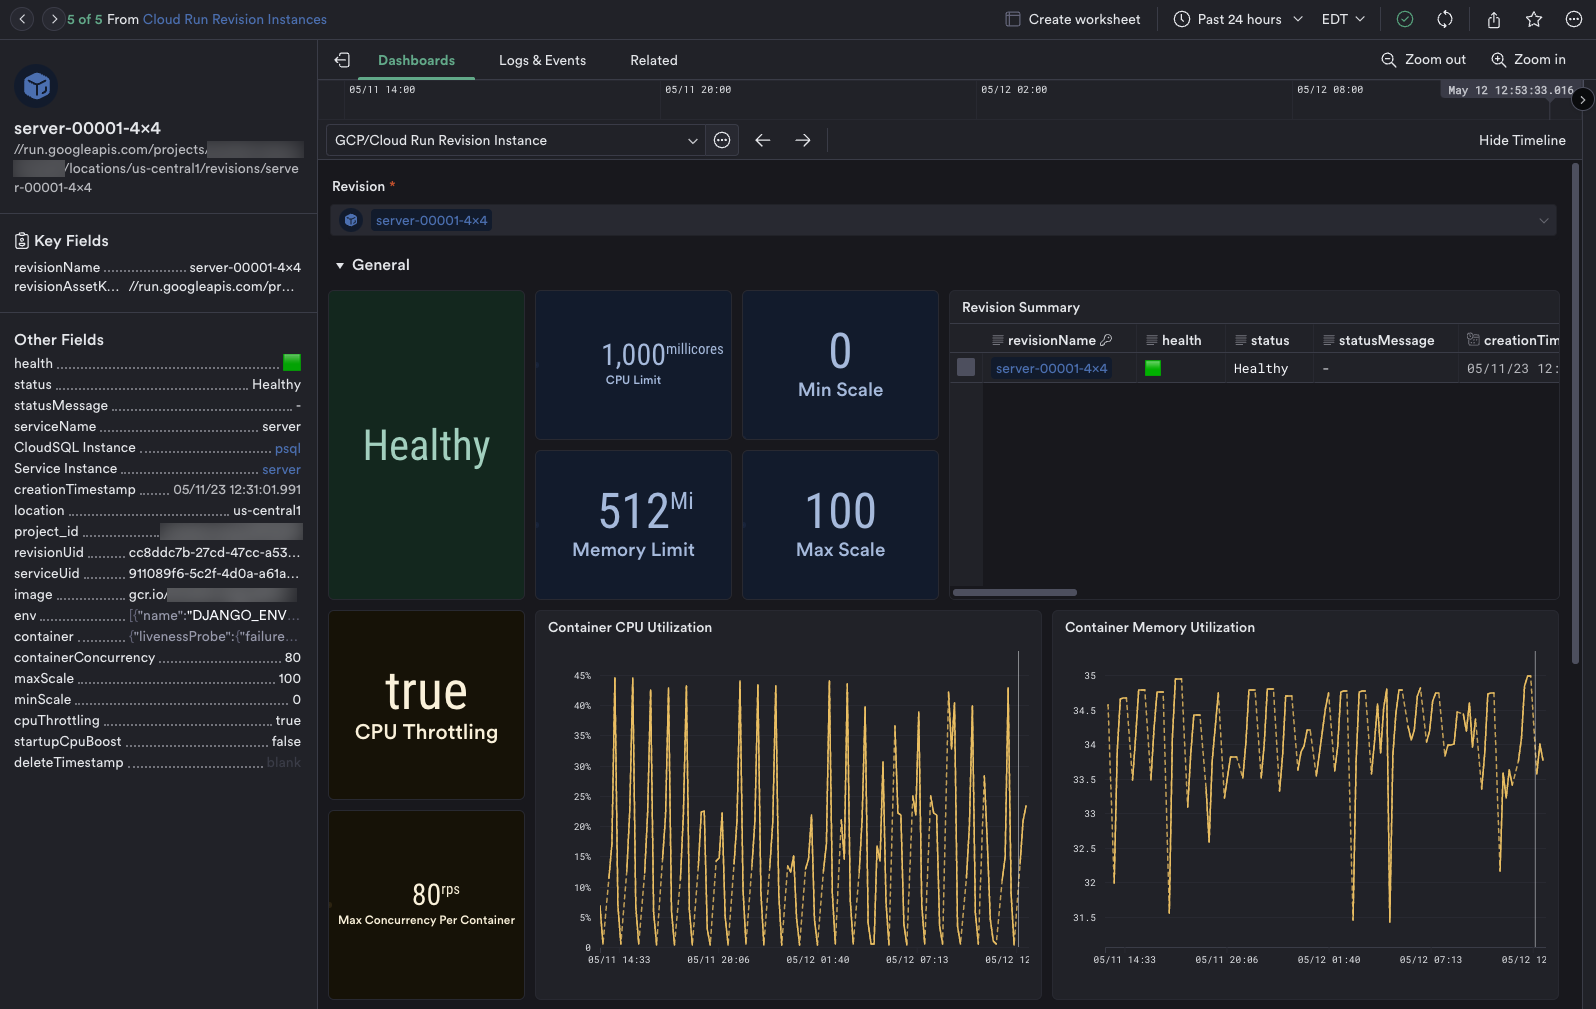
Figure 2 - Cloud Run Revision Instance Dashboard (details).
Furthermore, this dashboard includes metrics relevant to the current monitored revision, as well as Request and Error logs pertinent to this revision. Note that, you can also view logs in greater detail along with filtering in the Logs & Events section of this dashboard.
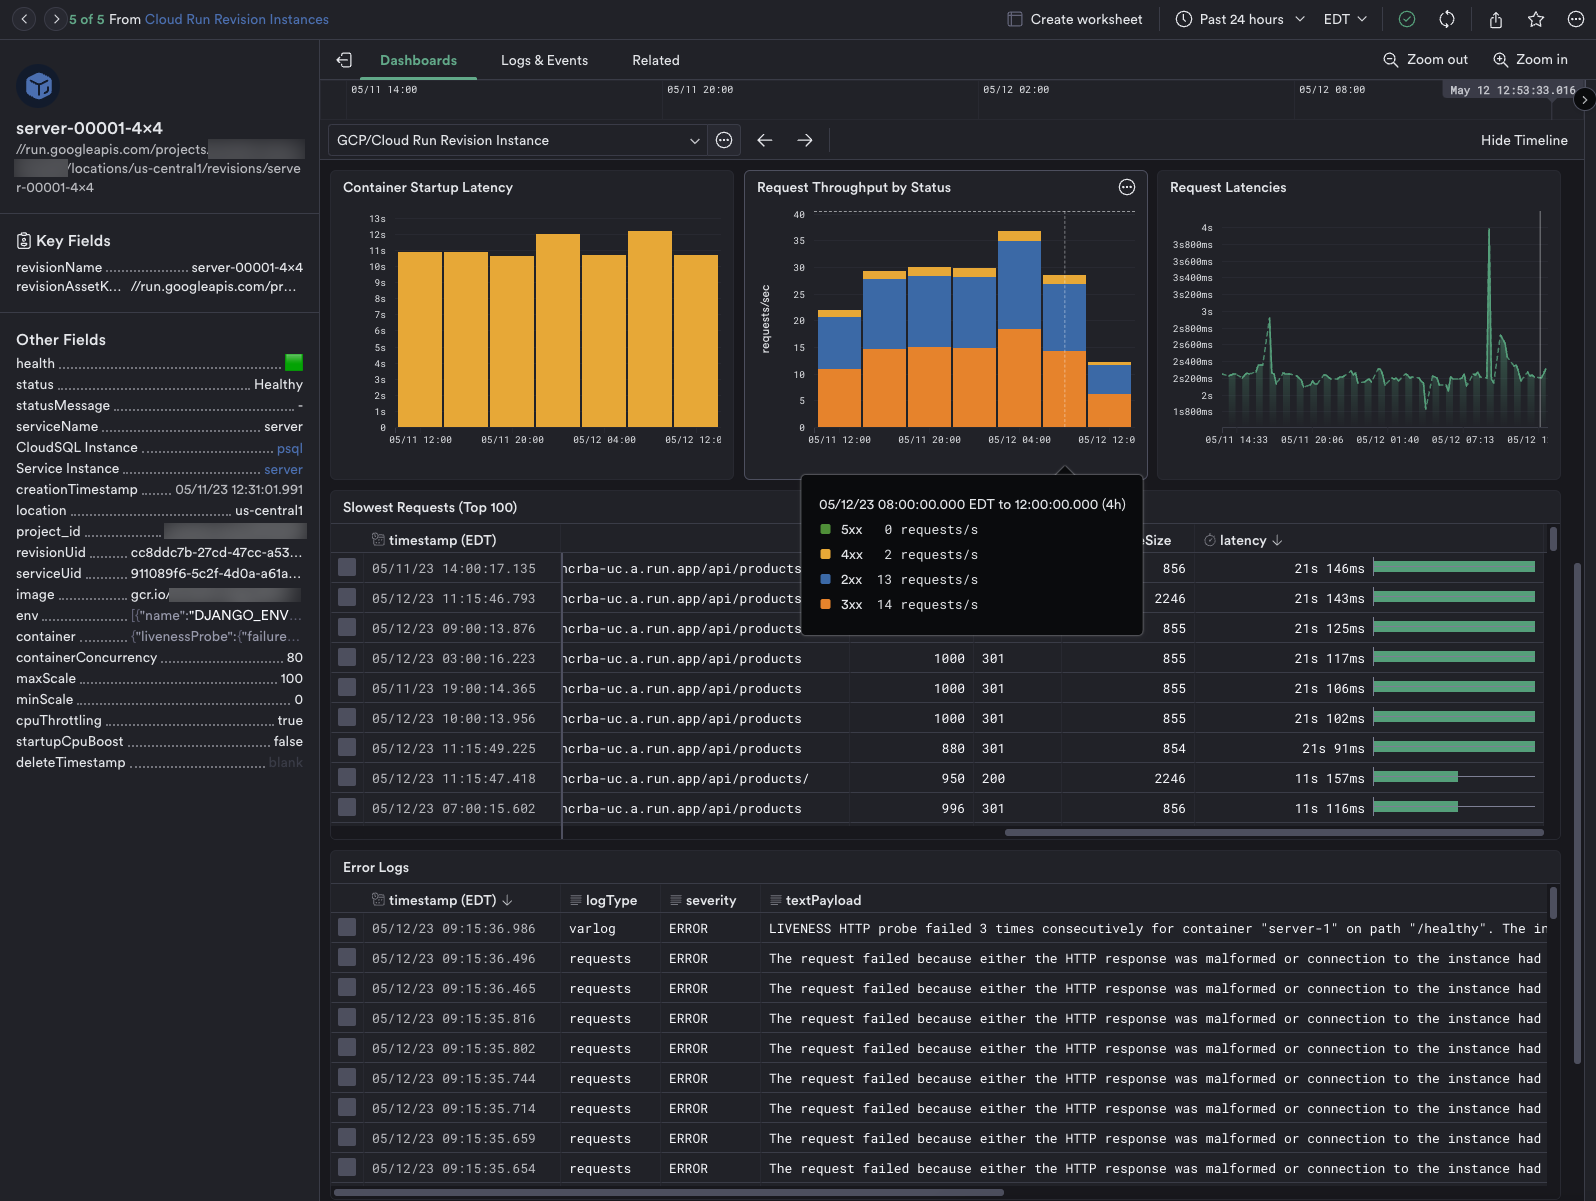
Figure 2 - Cloud Run Revision Instance Dashboard (metrics).
For a complete list of collected Cloud Run metrics, see Cloud Run metrics.
Setup
Install the Observe GCP app app and select Cloud Run from the Configuration list. The installation creates corresponding Datasets and Monitors.