Amazon RDS
Amazon Relational Database Service (Amazon RDS) provides easy-to-manage and scalable relational databases and database clusters in the AWS Cloud. Database instances may use one of several common database engines, such as MySQL or Microsoft SQL Server.
Observe helps you monitor the health and activity of your RDS deployments with the following features:
Datasets containing details of RDS clusters and individual DB instances, allowing you to see which instances are part of which clusters, the engine and instance class, and other attributes.
A dashboard with at-a-glance insights, such as the number of connections, and read/write latency.
Additional dataset for RDS deployment logs (see Setup.)
Sample Monitor configurations to alert on common problems, such as high error rates.
View RDS activity in Observe
DB Instances
To see details of your RDS DB instances, go to the RDS Instance dataset in Observe. Dashboards provides an overview of the state of your DB instances:
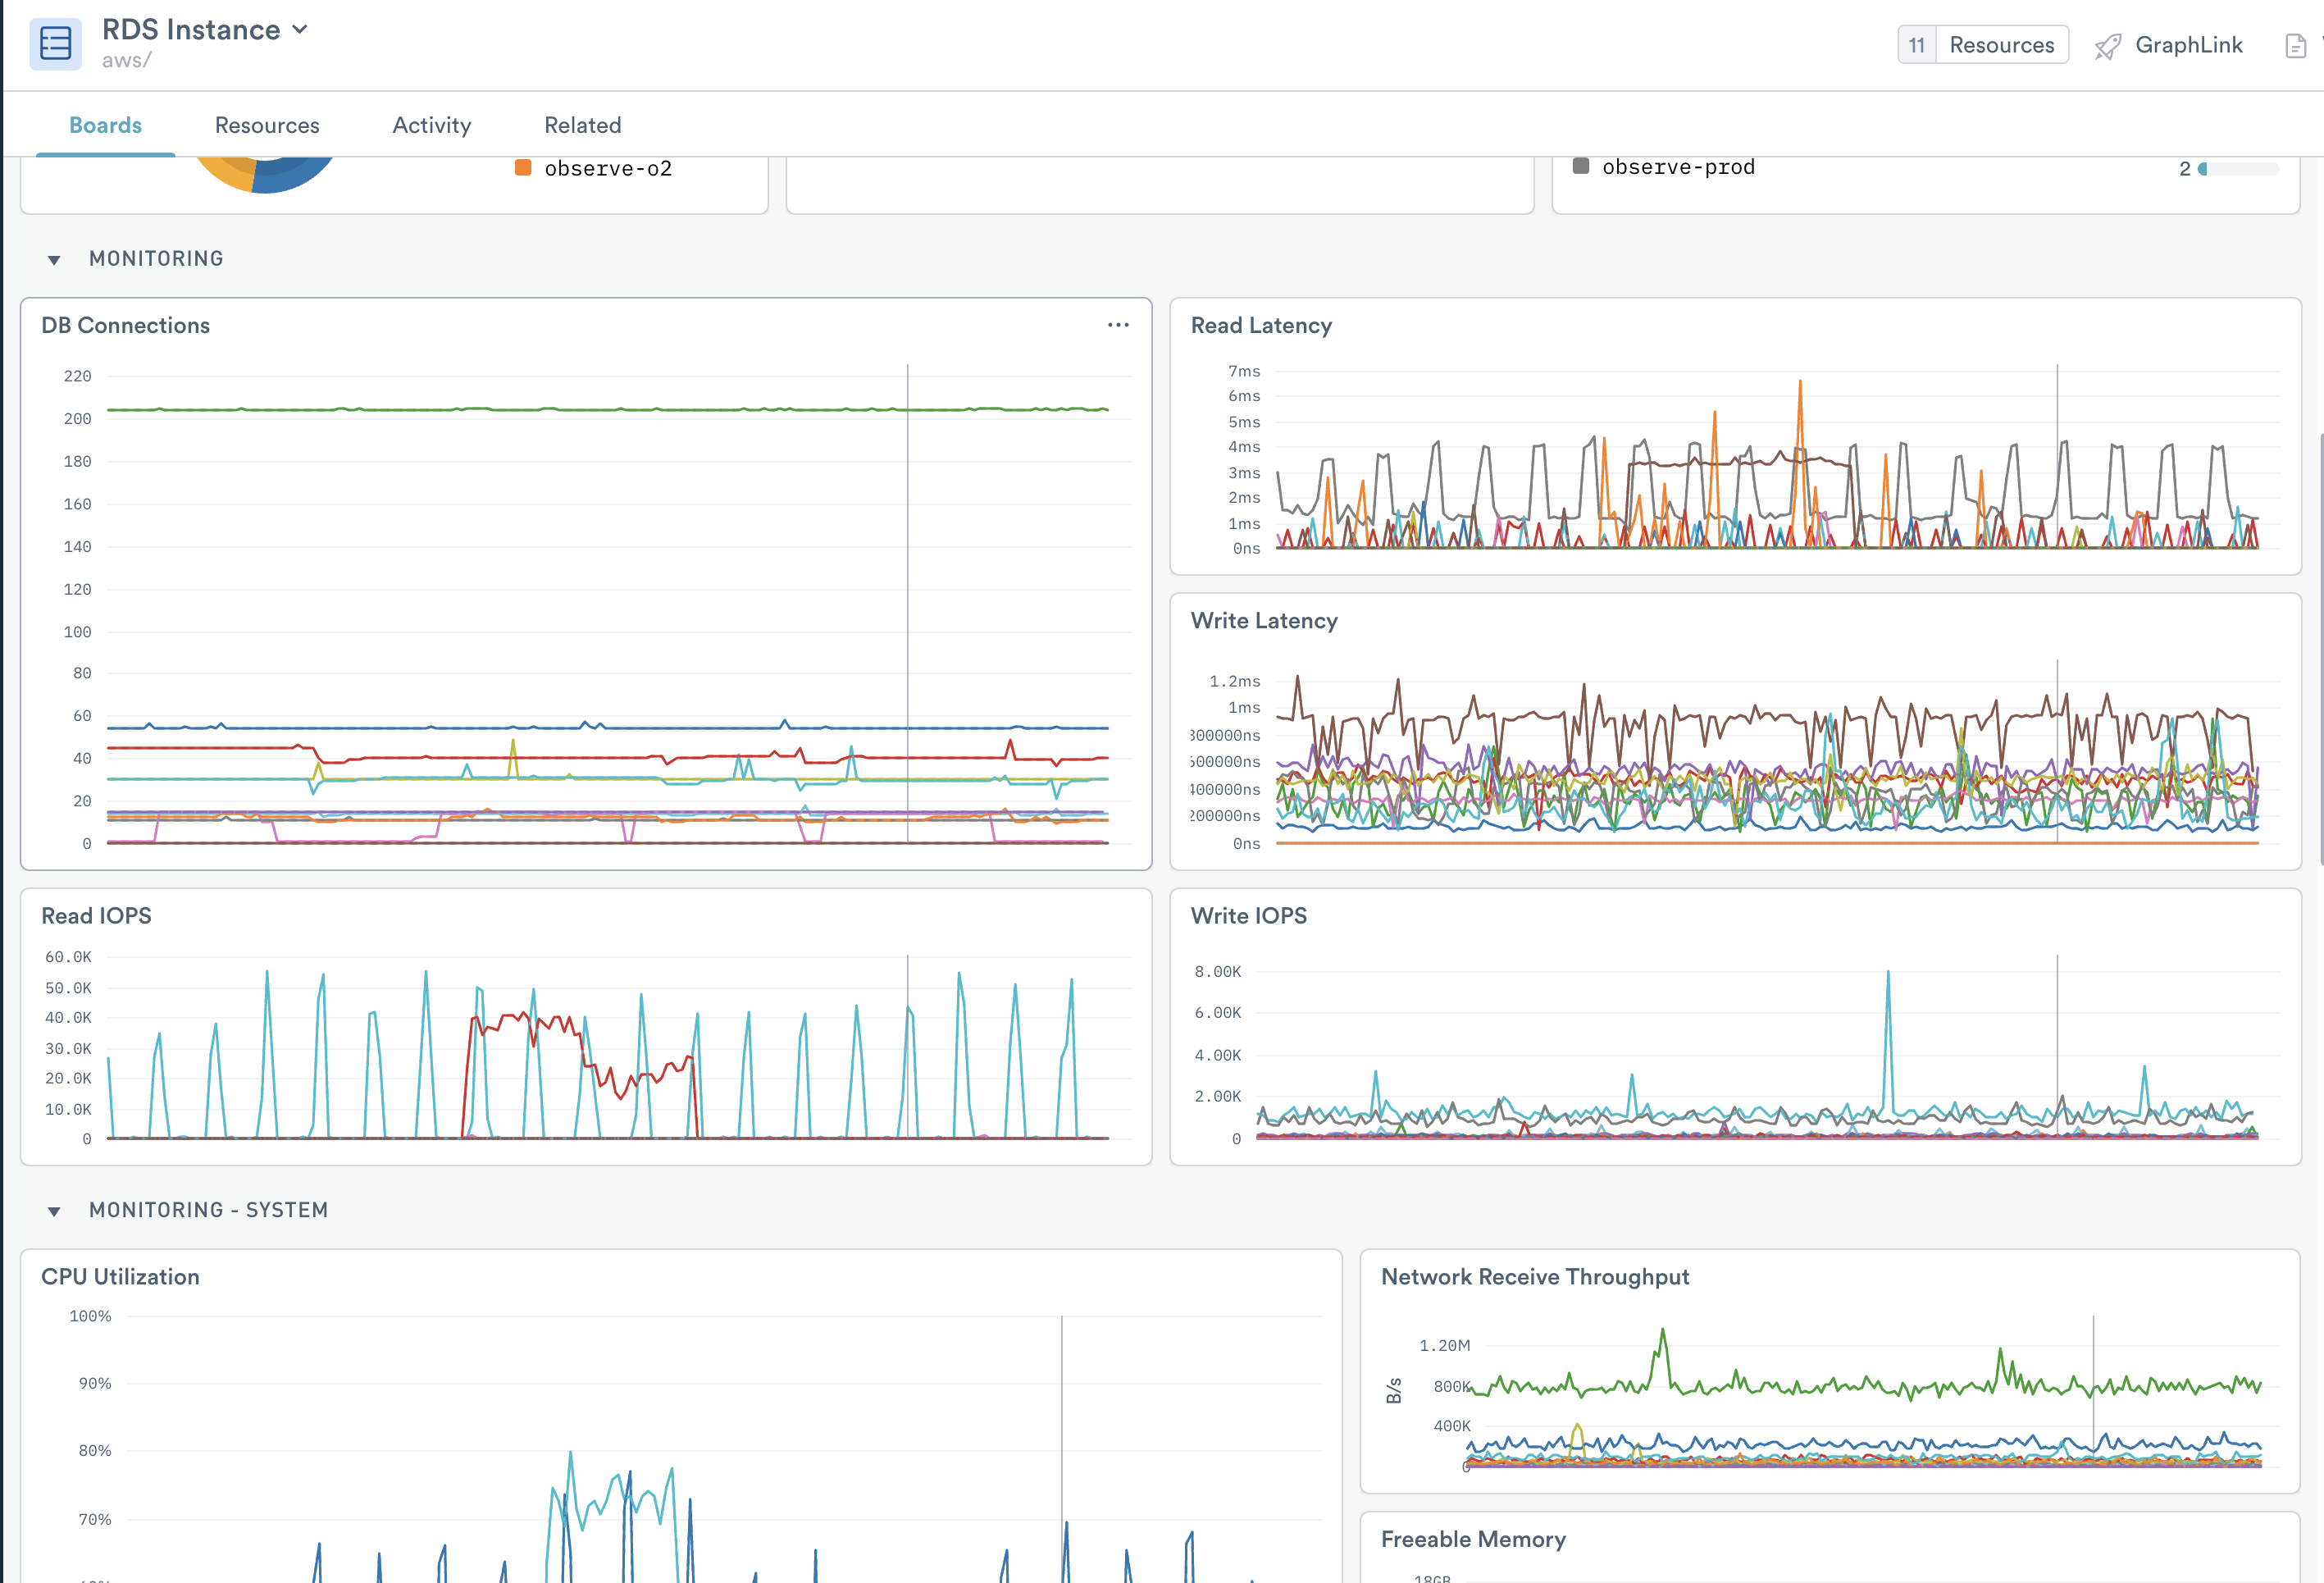
Figure 1 - Dashboards in RDS
This board includes visualizations with information about your instances. Use it to answer questions such as:
How many instances exist in each account or region?
How many instances exist of each DB engine type, and what versions do they use?
How many instances of each instance class?
How many instances are part of a cluster?
Dashboards contain useful database metrics, including:
Number of database connections
Latency
IOPS
And also system metrics, including:
CPU utilization
Network throughput
Free memory
Free storage space
Disk queue depth
For Aurora clusters, metrics include the following:
Commit latency and throughput
For a complete list of RDS metrics collected, see Amazon RDS metrics.
RDS Clusters
Get an overview of the state of your RDS DB clusters with the RDS Cluster dataset:
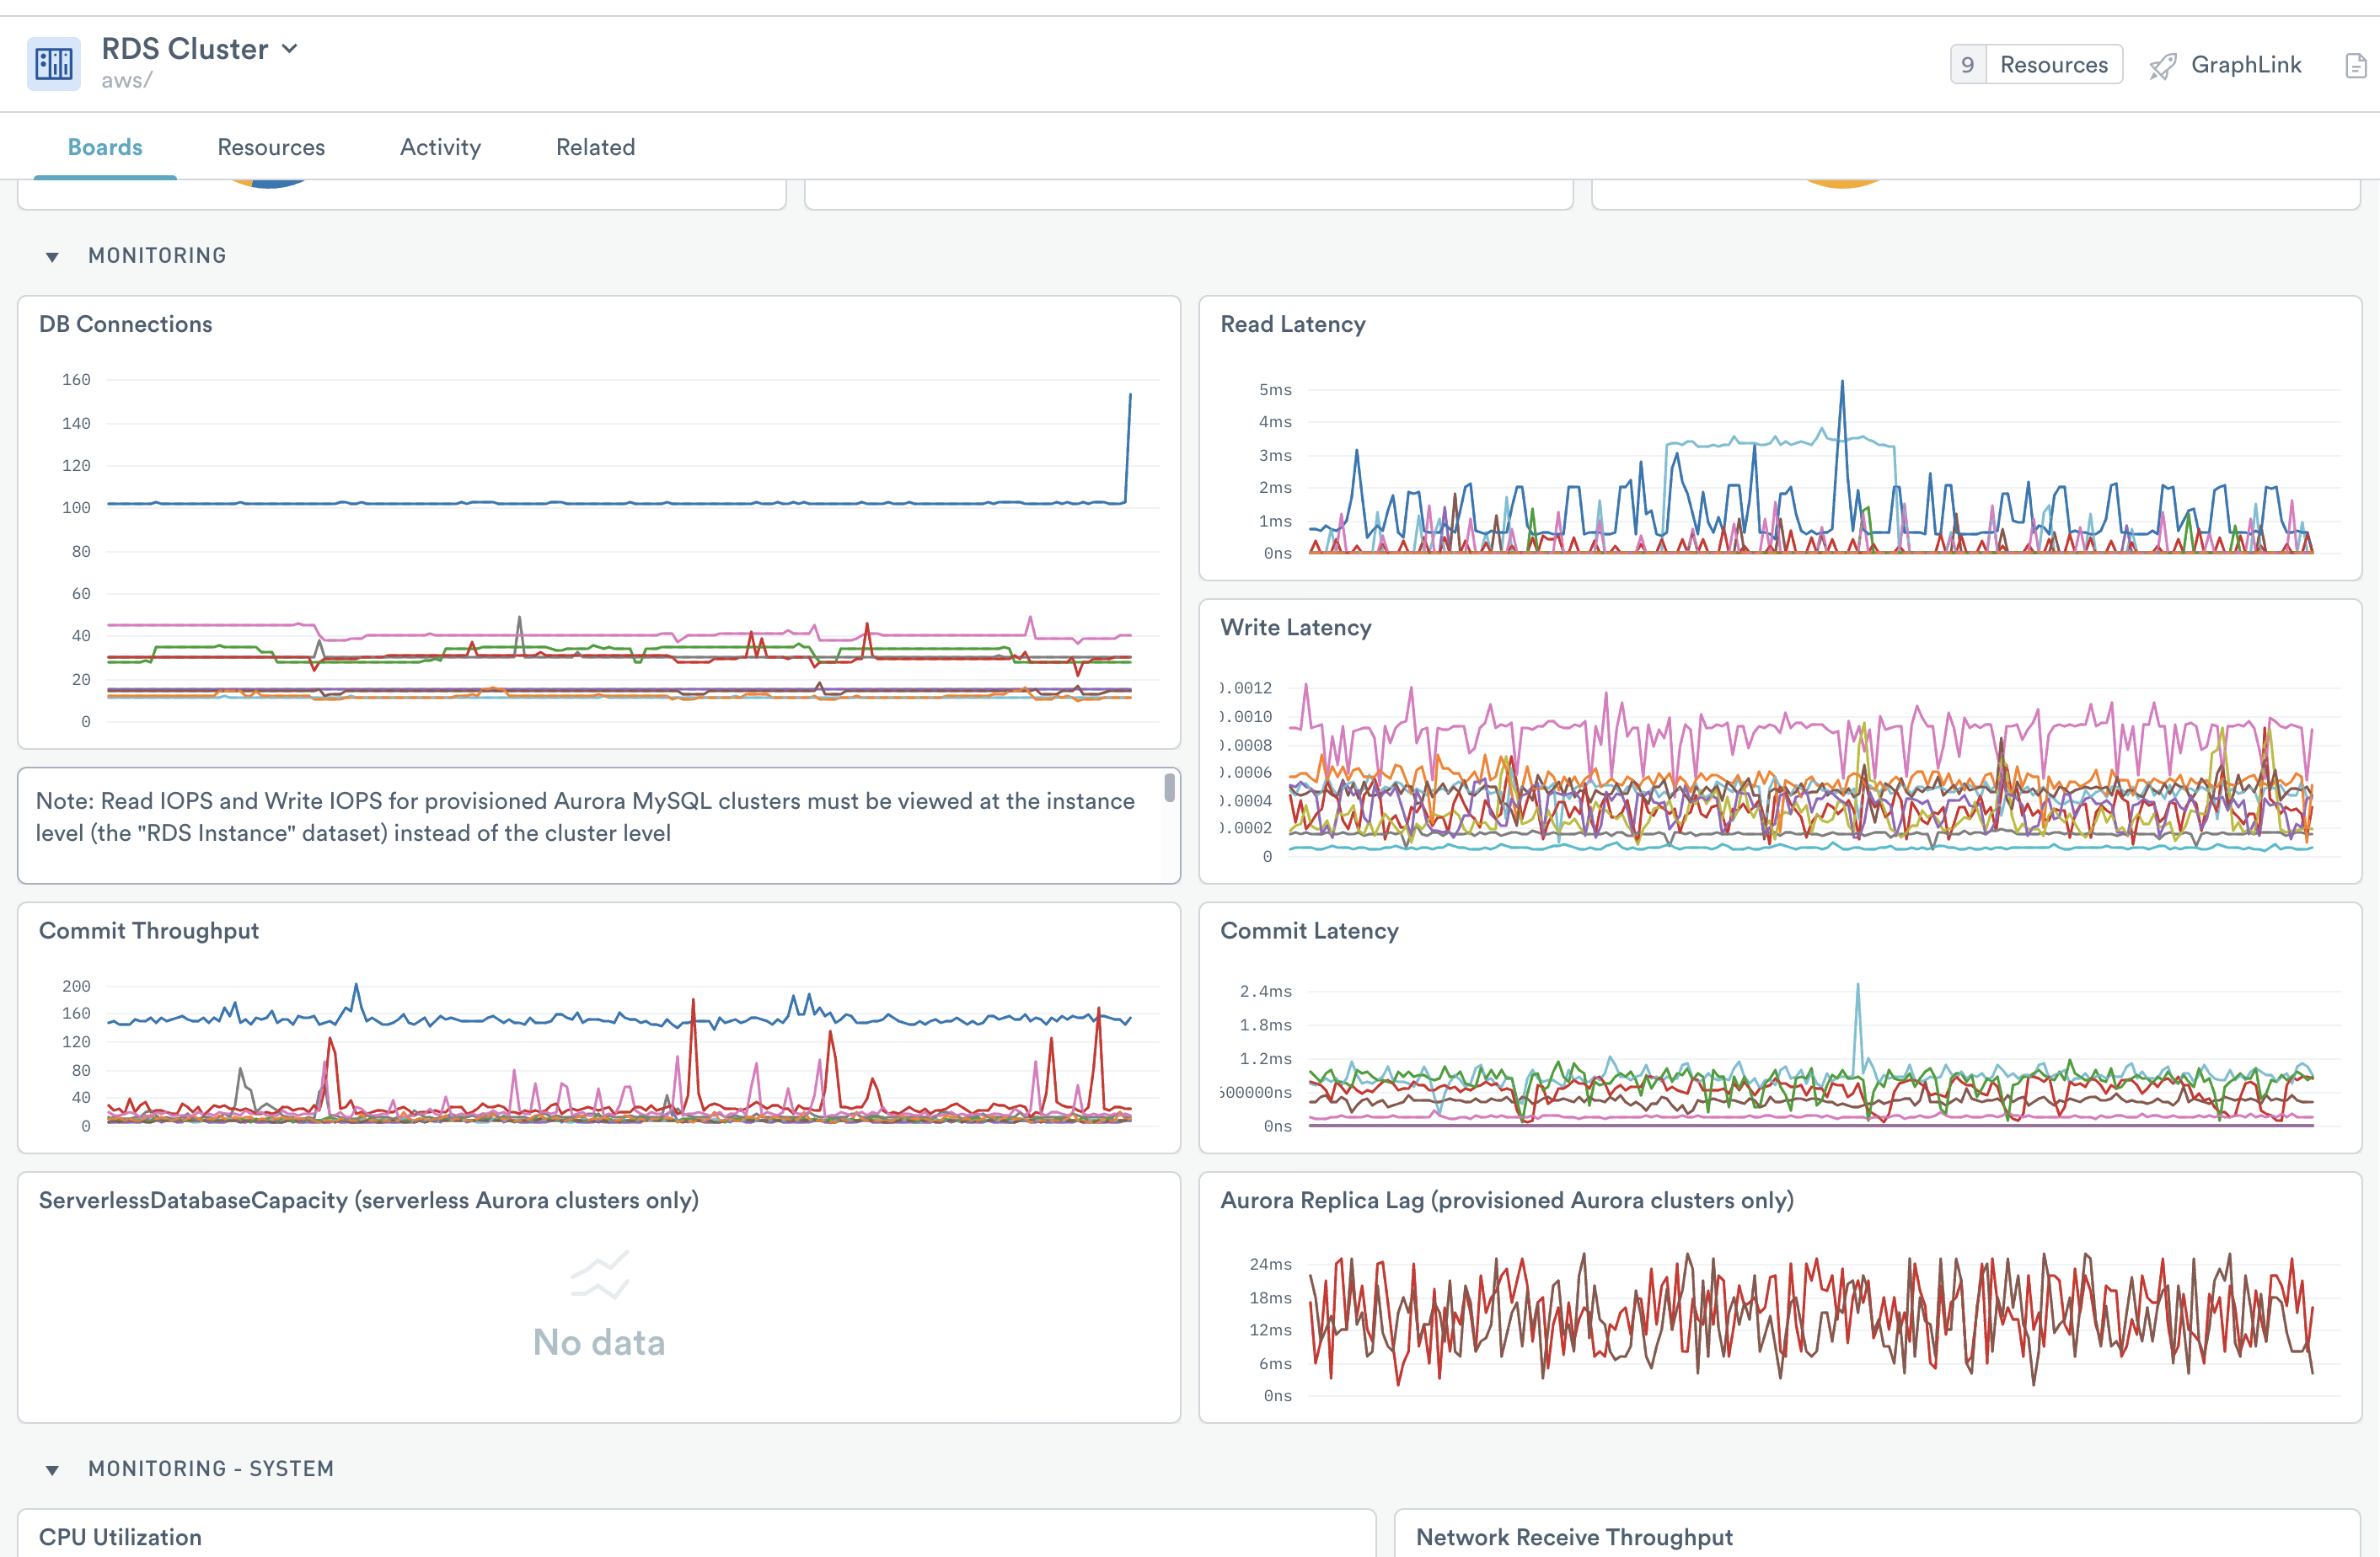
Figure 2 - RDS Cluster Dashboard
*The RDS Cluster dashboard includes all of the visualizations on the RDS Instance board, as well as additional metrics specific to different types of clusters.
For Aurora:
Serverless database capacity (for serverless clusters)
Replica lag (for provisioned clusters with read replicas)
For MySQL on Aurora:
DML latency and throughput
Number of blocked transactions
For PostgreSQL on Aurora:
IOPS
Monitors
Observe includes the following Monitor templates:
For Clusters
Alert if the average latency across the cluster is more than 20 milliseconds:
RDS High Cluster Read Latency
RDS High Cluster Write Latency
For DB instances
Alert if the latency for a single instance is more than 20 milliseconds:
RDS High Instance Read Latency
RDS High Instance Write Latency
Alert if the error rate has increased by more than 10% in the past hour:
RDS Increased Error Logs
Alert if an instance has less than 10% free storage:
RDS Low Free Storage Space
To use a template, go to the list of templates on the Monitors page and select the one you wish to use. Make any desired configuration changes on the Create a Monitor page and save it.
Setup
Install the Observe AWS Integration app and select RDS. The app creates datasets, and adds Monitor templates. For the optional RDS Logs dataset, Observe recommends enabling automatic subscription of CloudWatch Log Groups. For details, see How do I send CloudWatch Log Groups to Observe? in the AWS Integration documentation.