Introduction to monitors and alerts
Note
This document refers to the legacy alerting system, known as Monitors v1. See Monitors and Alerts for the updated version (v2). Note that all v1 Monitors will continue to function and are not deprecated. We advise users to create new monitors via the updated version.
Observe Monitors provide a flexible way to alert that patterns are found in your incoming data. Define who should receive alerts with Shared Actions, then create Monitors to watch for your desired conditions. When one occurs, Observe sends alerts to everyone (or every service) in its Shared Actions configuration. You can send alerts to any combination of email addresses and webhook-enabled services.
What does a Monitor do?
A Monitor watches a dataset for a particular condition, such as a count of events or a specific text value. When you create a Monitor, Observe makes a new dataset based on the contents of the dataset and your conditions. This allows multiple Monitors from the same dataset to be independent of each other.
There are five monitoring types available:
Metrics Threshold - Compare the count of events to a static threshold.
Count - Compare a numeric value to a static threshold.
Promote - Promote each event in the dataset into a Notification.
Log Threshold - Alert on values of a log count when exceeding a predefined threshold over a period of time.
Text Value - Use a specific text field to monitor the dataset.
When does a Monitor execute?
Observe Monitors execute as soon as data is available. Incoming data is ingested, shaped into a Dataset, and then ready for use. A Monitor is just another Dataset, and evaluates when data is added to it.
Some data sources cannot produce data in a timely and ordered fashion. If your monitor relies on data that is not complete for a few minutes, there are some approaches to solving this problem:
Freshness goal adjustment: Use Acceleration Manager to reduce the Monitor’s freshness goal.
OPAL editing: Use OPAL to prevent evaluation of the “ragged right edge” data. The window and frame functions can be used together to filter the evaluated data set.
Monitors Overview
When you select Monitors from the left hand rail, Observe displays a list of existing Monitors configured on your instance.
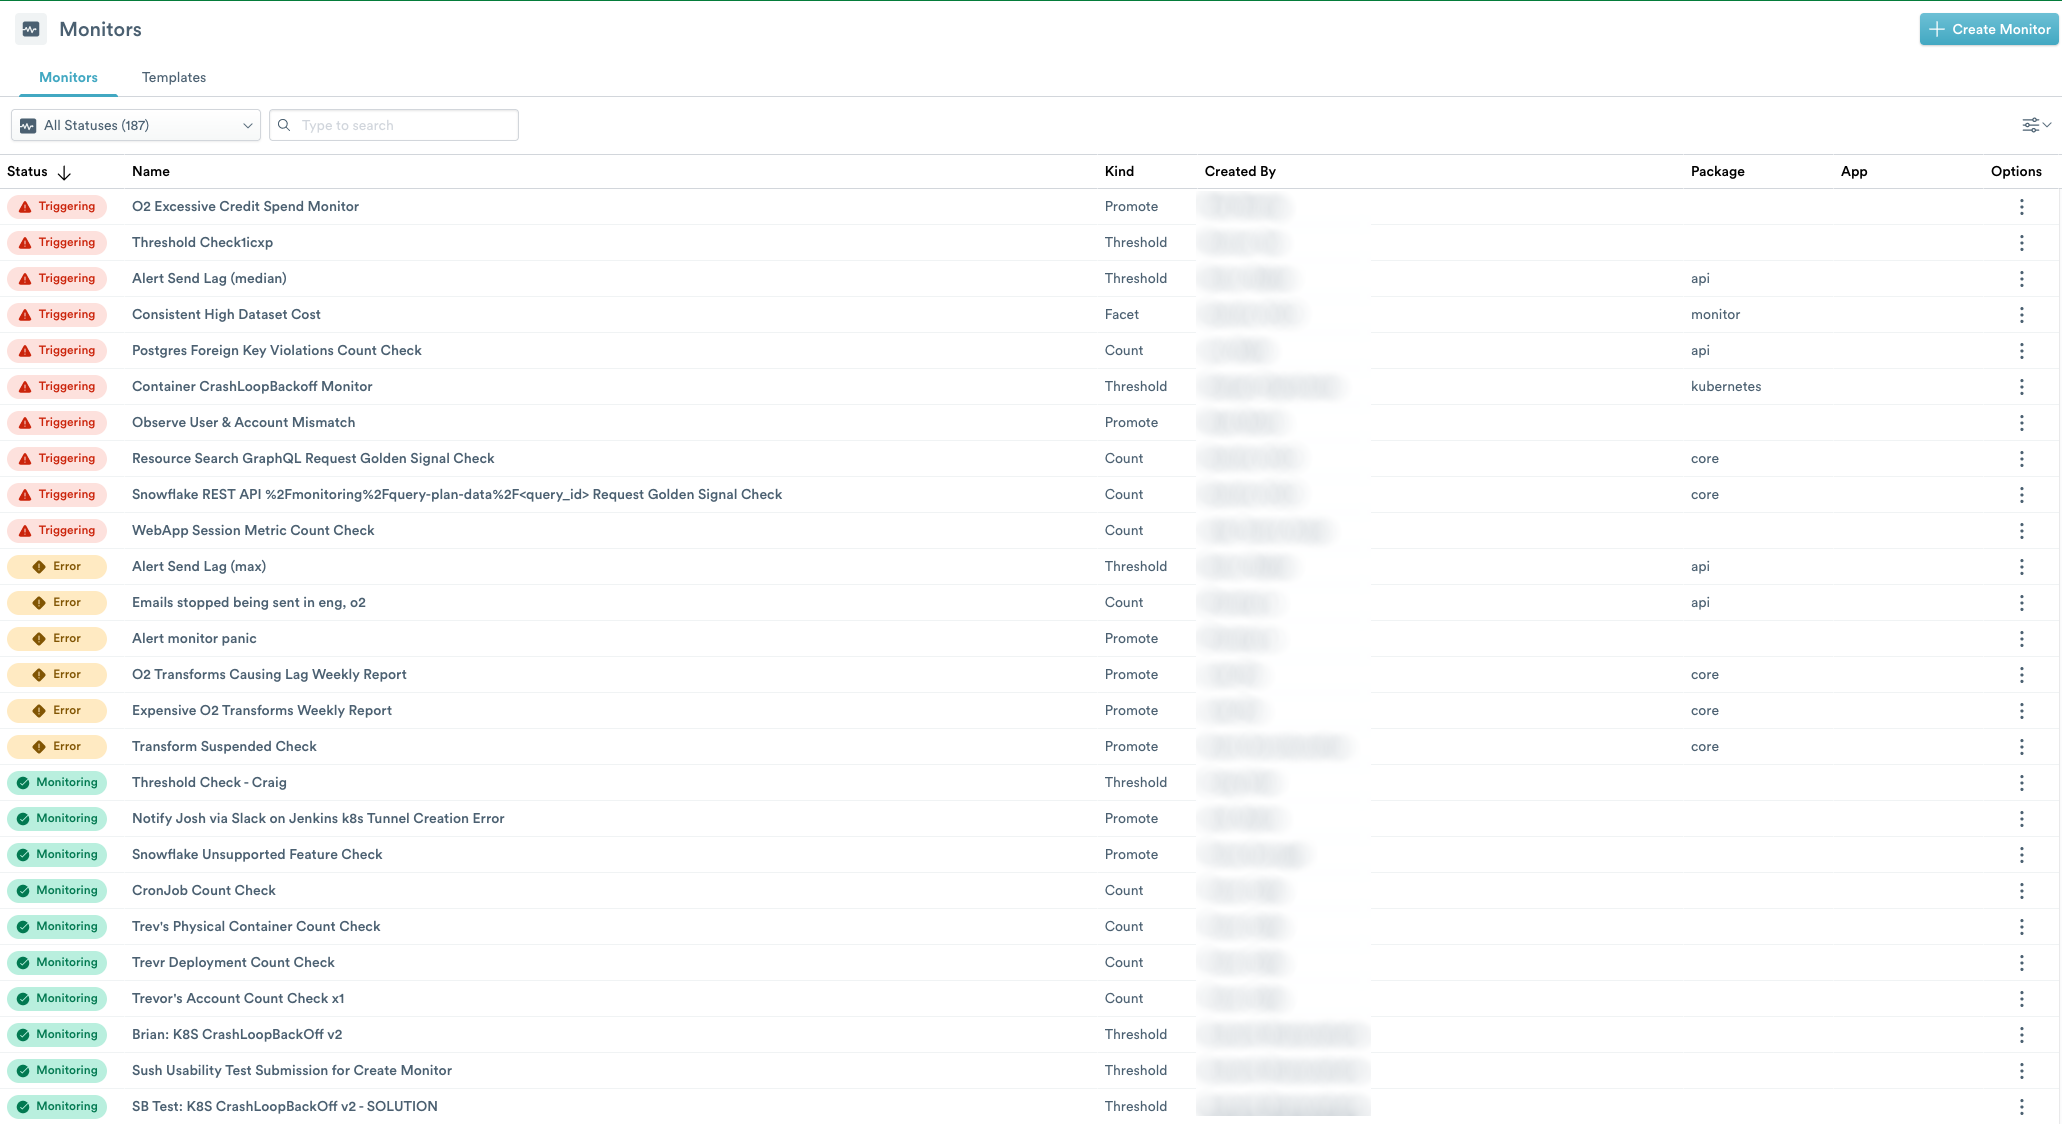
Figure 1 - List of Configured Monitors
The page displays the following columns of information:
Status - the current status of a Monitor.
Name - the name configured for the Monitor.
Kind - the type of configured Monitor such as Threshold, Count, Text, or Promote.
Created By - the name of the person who configured the Monitor.
App - the app associated with the Monitor.
Options - select from
Enabled - enable or disable the Monitor.
Duplicate - add a duplicate Monitor.
Export Terraform - export the Monitor configuration in Terraform.
Delete - remove the Monitor from the Observe instance.
From the All Statuses menu, you can select from the following options:
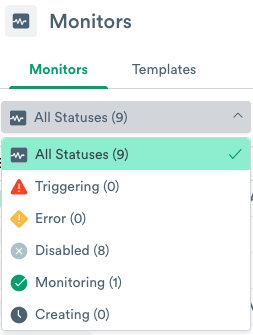
Figure 2 - Select from a List of Monitor Statuses
All Statuses - a list of all Monitors in any status.
Triggering - Monitors in the process of triggering an alert.
Error - Monitors in an error state.
Disabled - disabled Monitors.
Monitoring - Monitors actively watching for trigger events.
Creating - Monitors in the process of creation after configuring a Monitor.
You can sort or group the Monitors by clicking the Sort icon, and displaying the options for sorting or grouping them.
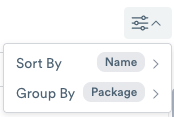
Figure 3 - Select Sort By or Group By
To add a Monitor, click +Create Monitor.
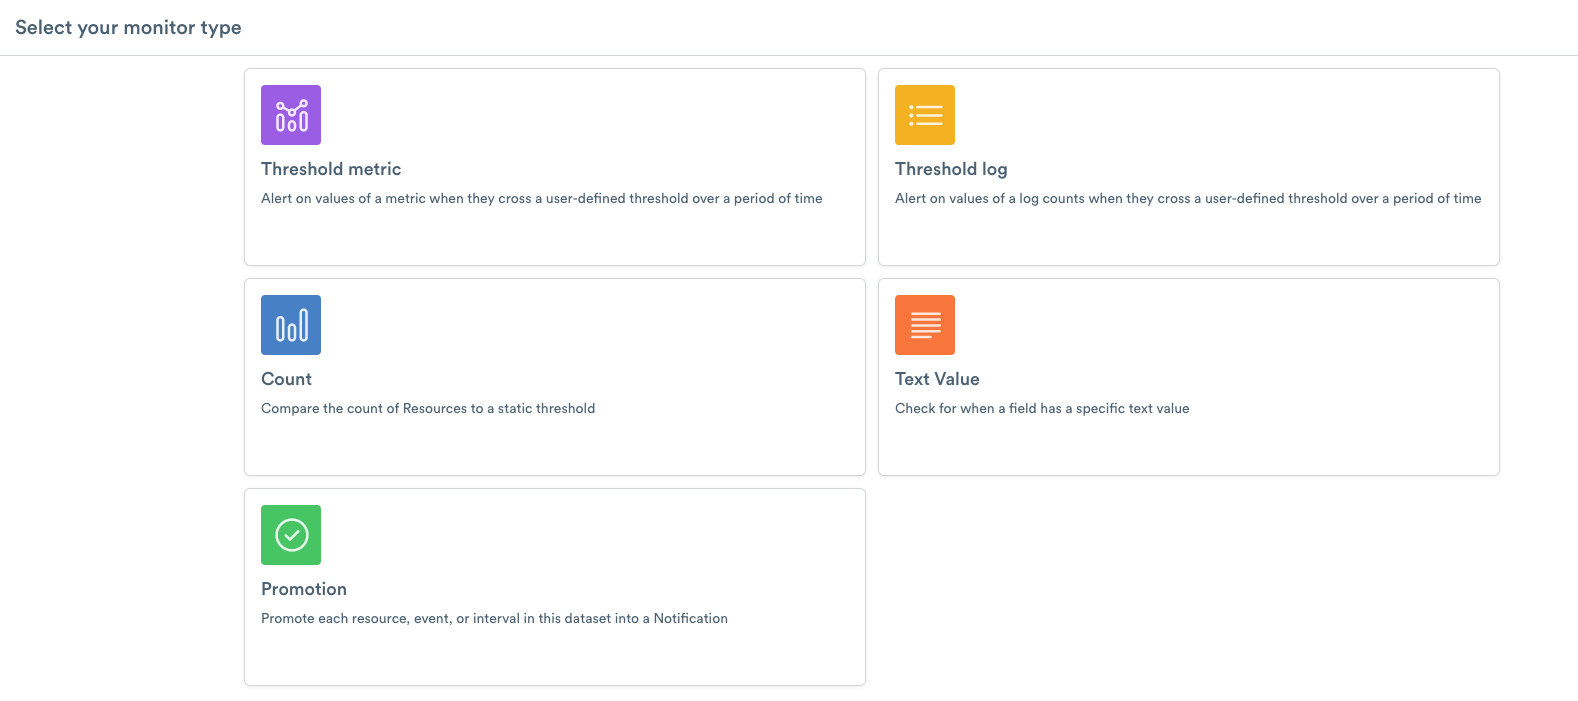
Figure 4 - Select the Type of Monitor
Select one of the following types of Monitors to configure for Alerts:
Threshold metric - Create a Monitor to alert on metrics values when they cross a defined threshold over a period of time.
Count - Compare the Resource count to a static threshold.
Promotion - Promote each Resource, Event, or Interval in a dataset into a Notification.
Threshold Log - Create an Alert on values of a log count when they cross a user-defined threshold over a period of time.
Text Value - Create an Alert when a specific text value appears in a field.
Using Monitor Templates
Observe provides easy-to-use templates to create monitors for events. By default, you can select from two templates:
(TEMPLATE)Failed Job - monitor preset dataset for any failed jobs within Observe. The monitor contains a preset dataset, Builds, with the following OPAL statements:
filter result="FAILURE"

make_col kind:strcat("Jenkins job ", label, " failed on node ", datacenter, "/", host)
make_col description:strcat("Job URL: ", link, "\n Logfile: ", filename)
(TEMPLATE)Long Job > 100s - monitor Jenkins jobs for jobs that last more than 100 seconds. This monitor contains a preset dataset, Builds, with the following OPAL statements:
filter buildSecs>100

make_col kind:strcat("Jenkins job ", label, " ran long on ", datacenter, "/", host)
make_col description:strcat("Job URL: ", link, "\n Logfile: ", filename)
To use the templates, configure the desired template and then save it as a new Monitor.
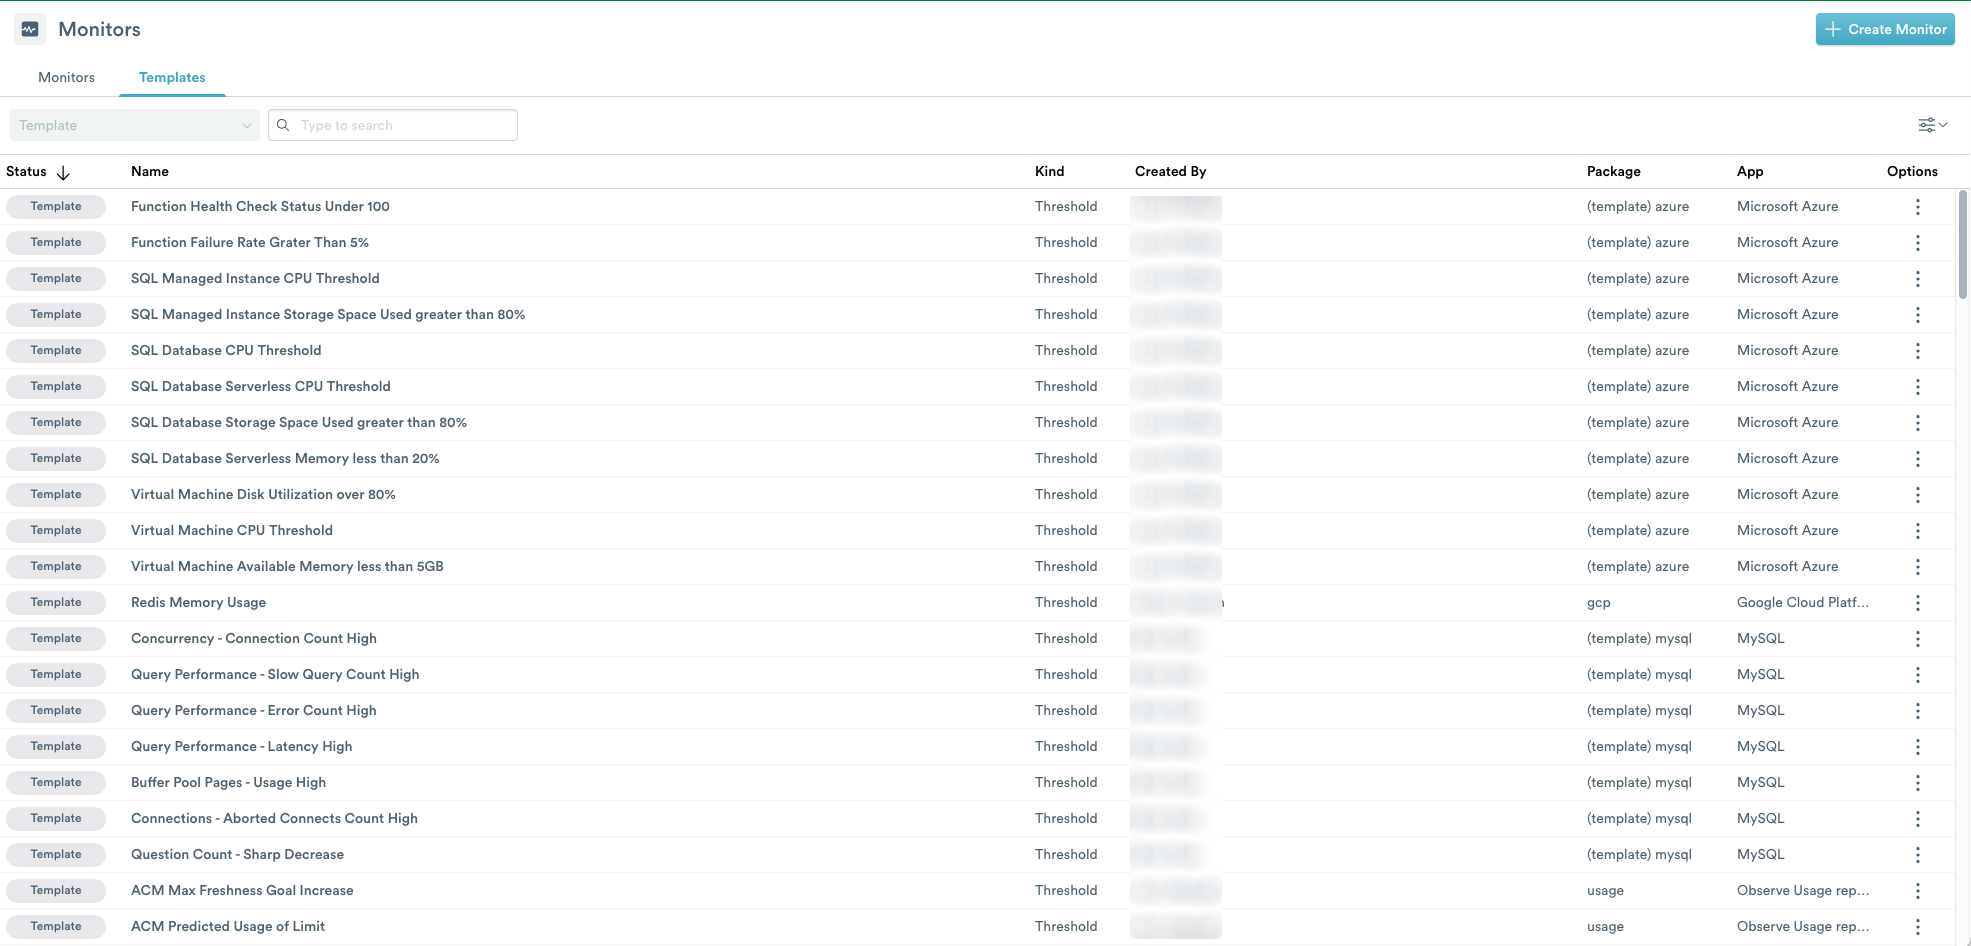
Figure 5 - List of Available Monitor Templates
The Templates page displays the following columns:
Status - the current status of the Template
Name - the name of the Template
Kind - the type of Monitor Template
Created by - if related to an app, the name of the person who installed the app.
Package - the associated package for the Template
App - the app name associated with the Template
Options - select from
Duplicate - add a duplicate Monitor.
Export Terraform - export the Monitor configuration in Terraform.
You can sort or group the templates using the Sort icon located next to Create Monitor.
When you install an app on Observe, the app also installs templates for the selected integrations. To view the list of app Templates, from the left navigation panel, click the Monitors icon and select **Templates.
Note
The template list varies based on the installed apps on your Observe instance.
To use the installed app Templates, configure the desired template and then save it as a new monitor.
Creating a New Monitor
To create a new Monitor in Observe, use the following steps:
Log into Observe and click the Monitors icon on the left side navigation.
On the Monitors page, click New Monitor.
From the Select your monitor type panel, select the type of monitor you want to create in Observe:
Threshold metric - create a monitor to alert you on the values of a metric when the values cross a user-defined threshold over a period of time.
Count - compare the count of Resources to a static threshold.
Text Value - monitor a dataset for the appearance of a specific text value.
Promotion - promote each resource in a dataset into a Notification.
Configuring Alerts
Set up Shared Actions, and then create Monitors from any Dataset. Each Shared Action can have a custom alert message to send your HTML to an email recipient or JSON in a Webhook request.
For an example, see this page: Alerting Example: Channels, Channel Actions, and Monitors.
For more about trigger conditions, see Monitor Notification Options
Reviewing an Existing Monitor’s Data Lineage
You may need to review the configuration of a Monitor to understand and control the freshness of the data it relies on.
Open the Acceleration Manager from the settings menu at lower left, and click Monitors to filter the list. Monitors with an Effective freshness that is worse than the Freshness goal will have a warning icon and colored display. Hover over these lines to get a context menu, and click the More icon to edit the Monitor definition.
You can also access monitor definitions from the Monitors list page. Hover over the monitor to access the context menu, and click the Pencil icon to edit the Monitor definition.
From the Monitor definition you can review and potentially edit data, rules, and actions taken. To see which dataset a Count, Promote, or Facet (Text Value) monitor depends on, click Open in Worksheet, then Manage Inputs.