Elastic Load Balancing
Elastic Load Balancing (ELB) automatically distributes incoming application traffic across multiple targets and virtual appliances in one or more Availability Zones (AZs). The Observe AWS Integration collects details of Application Load Balancers (ALBs) and Network Load Balancers (NLBs.) Use Elastic Load Balancing in combination with other AWS services, such as ECS, EC2, EKS or Lambda.
Observe helps you monitor the health and activity of your load balancers with the following features:
Datasets containing the details of ALB and NLB load balancers and their target groups, allowing you to see status, attributes, and metrics.
A dashboard with at-a-glance insights, such as health checks, error and throughput rates, and request duration.
Sample Monitor configurations to alert on common problems, such as failed health checks or slow requests.
Viewing load balancer activity in Observe
To see details of your application load balancers, go to the ELB Load Balancer dataset in Observe. The ELB Dashboards provide an overview of the current state:
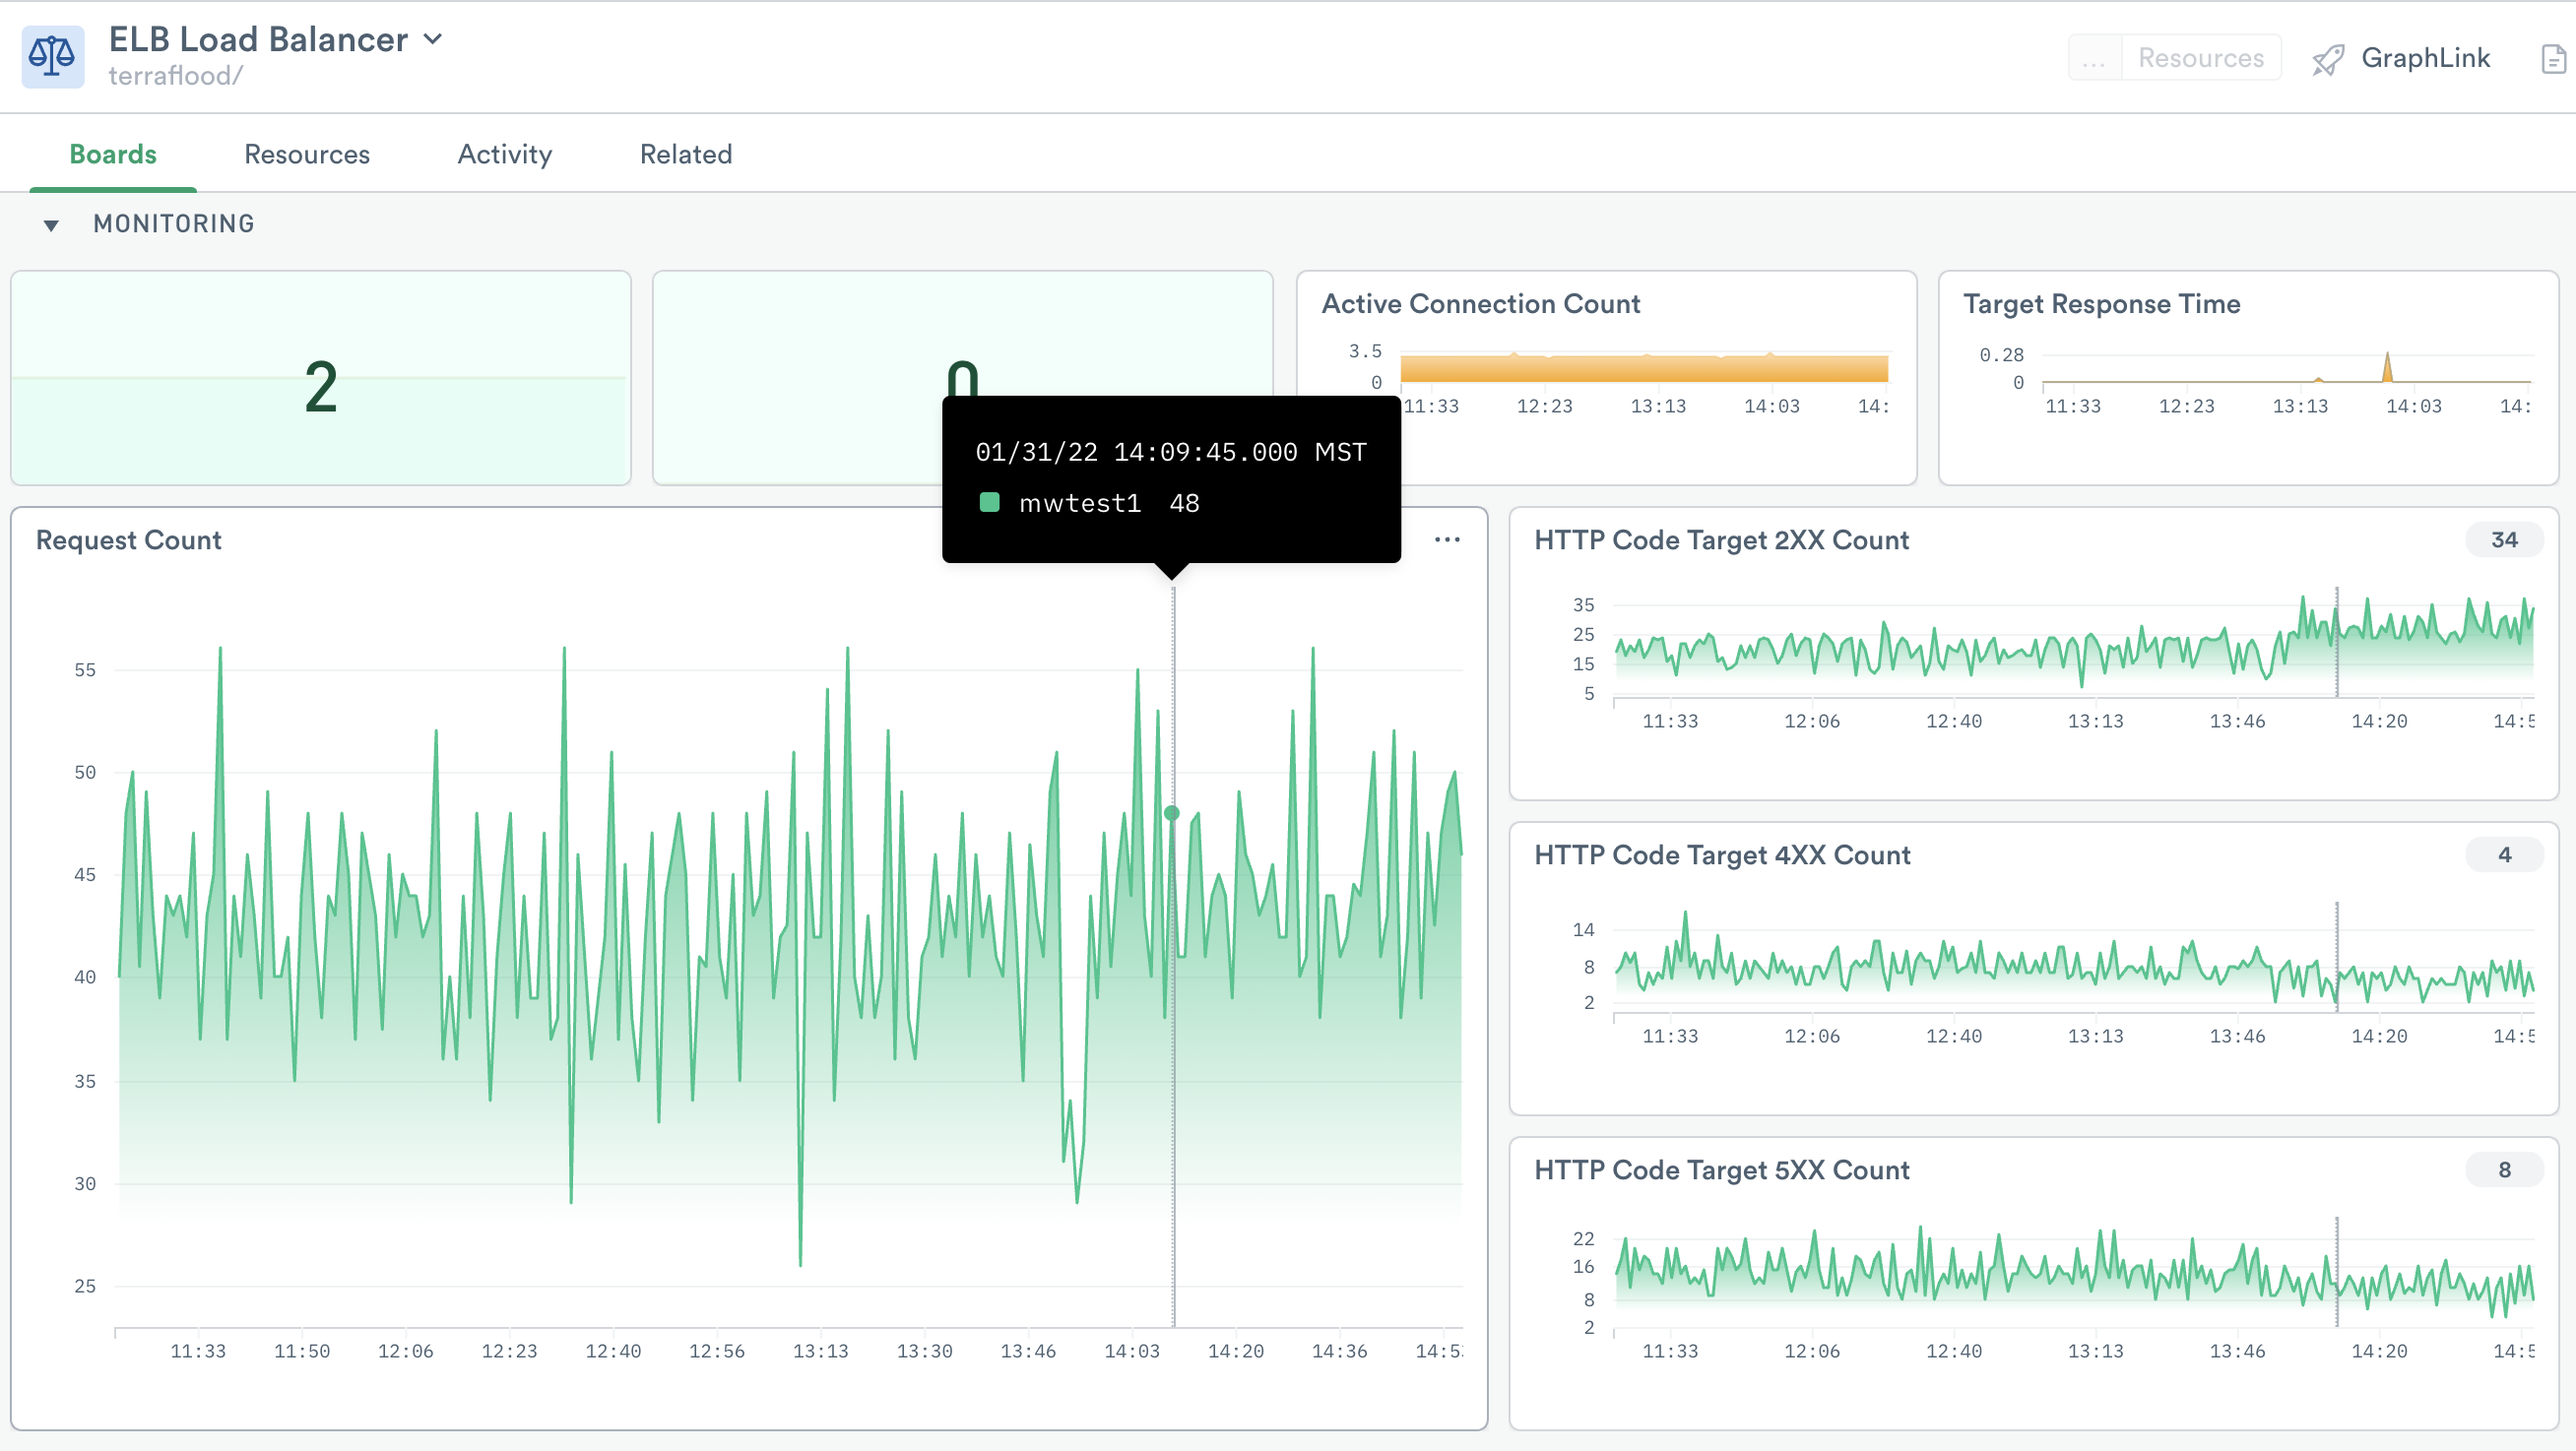
Figure 1 - Dashboard for ELB
Also, view details of network load balancers by going to the NLB Dashboard.
The dashboards include visualizations with information about application and network load balancers. Use them to answer questions such as:
What type of load balancers do I have in each account or region?
Which targets have slow response times?
How many active connections use this load balancer?
Do I have a large number of error HTTP status codes?
How busy are the load balancers?
The ELB and NLB dashboards display useful metrics, such as:
HealthyHostCountandUnhealthyHostCountActiveConnectionCountTargetResponseTimeRequest Counts by HTTP code, such as
HTTPCode_Target_5XX_Count
For a complete list of load balancer metrics collected, see Elastic Load Balancing metrics.
Monitors
The AWS Integration app includes the following templates for ELB:
Monitor Template |
Description |
|---|---|
ELB Health Check failed on at least 2 targets |
Alert if 2 or more hosts are unhealthy. |
ELB Health Check failures are increasing |
Alert if any load balancers are failing their health checks. |
ELB High Number of failed Requests |
Alert if fewer than 45% of requests are successful |
ELB Slow Response Time for Requests |
Alert if the response time is greater than or equal to 2 seconds. |
To use a template, go to the list of templates on the Monitors page and select the one you want to use. Make any desired configuration changes on the Create a Monitor page and save to enable it.
Setup
Install the Observe AWS Integration app and select ECS from the Configuration list. The installation creates corresponding datasets and Monitors.