Memorystore Redis
Google Cloud Memorystore for Redis (GCP-MS Redis) provides a fully-managed service powered by the Redis in-memory data store to build application caches that provide sub-millisecond data access.
Observe helps you monitor the health and activity of your GCP-MS Redis instances with these features:
A dataset containing the details of individual GCP-MS Redis instances, allowing you to investigate their status and attributes over time.
A dashboard with at-a-glance insights, such as CPU utilization, status check failures, and network throughput.
Sample Monitor configurations to enable proactive alerting on changes in instance health.
Observe provides these tools as part of the Observe GCP Integration. To use them in your workspace, install the GCP app.
Viewing GCP Compute Activity in Observe
The Monitoring Dashboard
To see details of your GCP-MS Redis instances, go to the GCP/Redis Instance dataset in Observe. The GCP/Redis Monitoring dashboard shows an overview of the activity and health of your GCP-MS Redis instances.
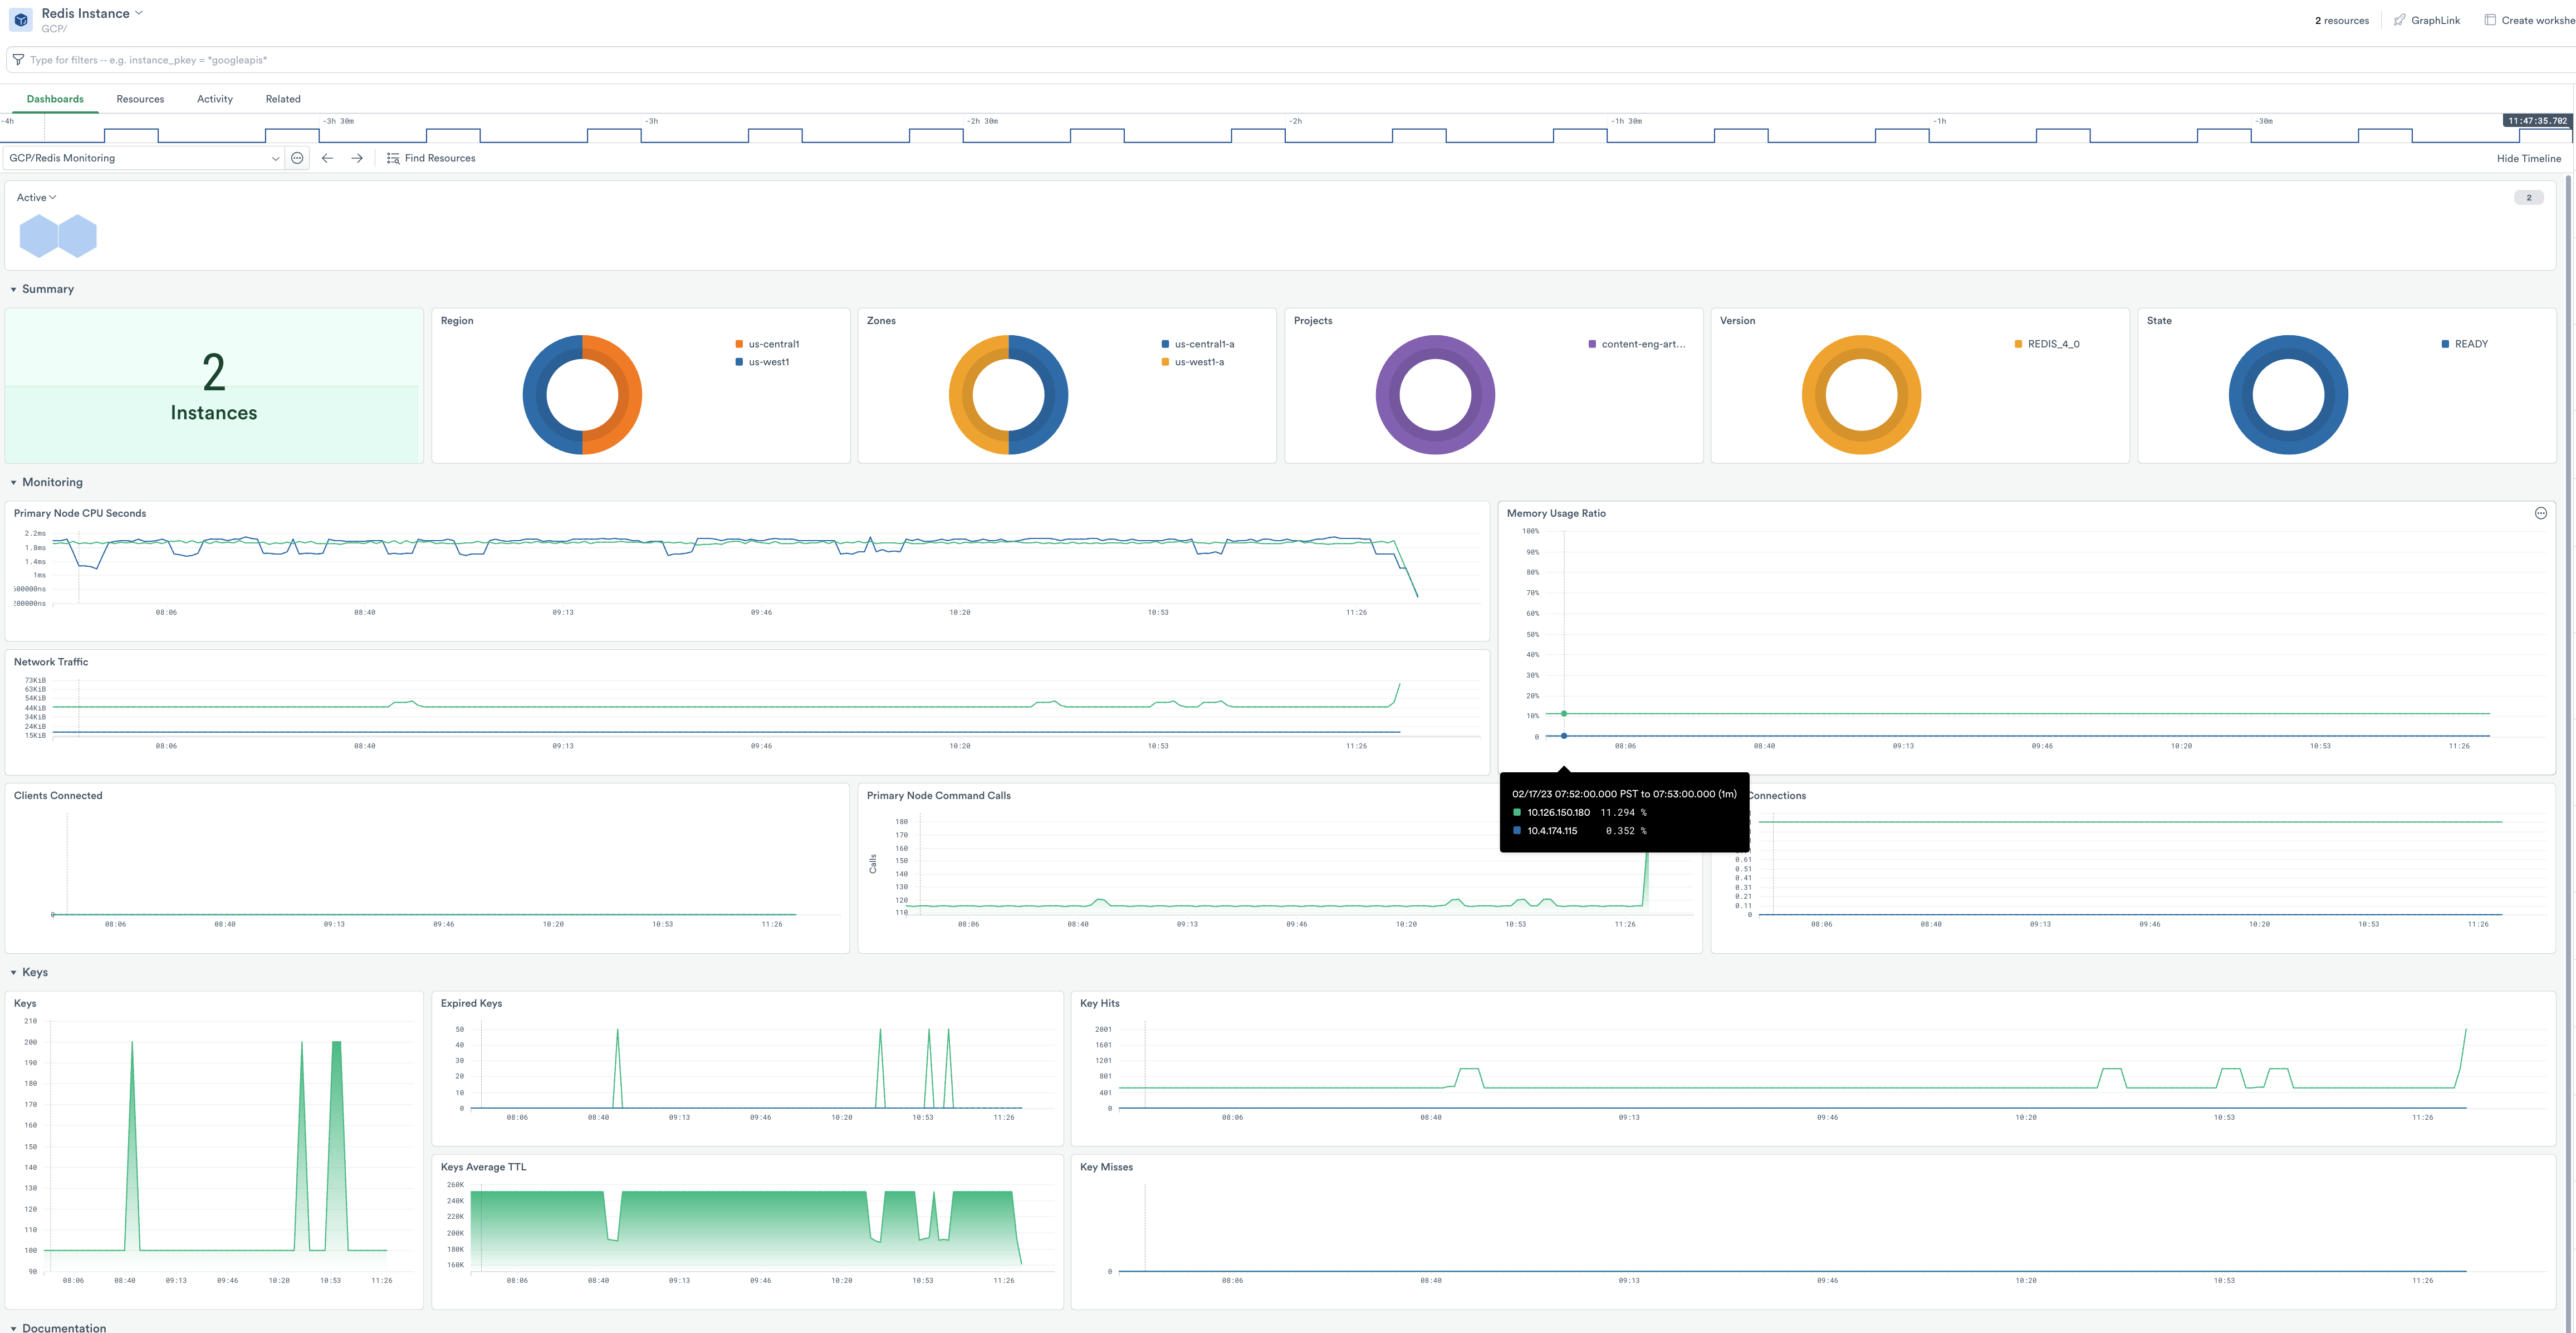
Figure 1 - The Monitoring Dashboard for GCP-MS Redis
To investigate specific instances, select one or more instance_pkey values in the right rail.
The Overview section contains location and state information.
The Monitoring section contains system load information such as:
CPU consumption
Memory Usage Ratio (%used of available)
Network throughput
Connected Clients
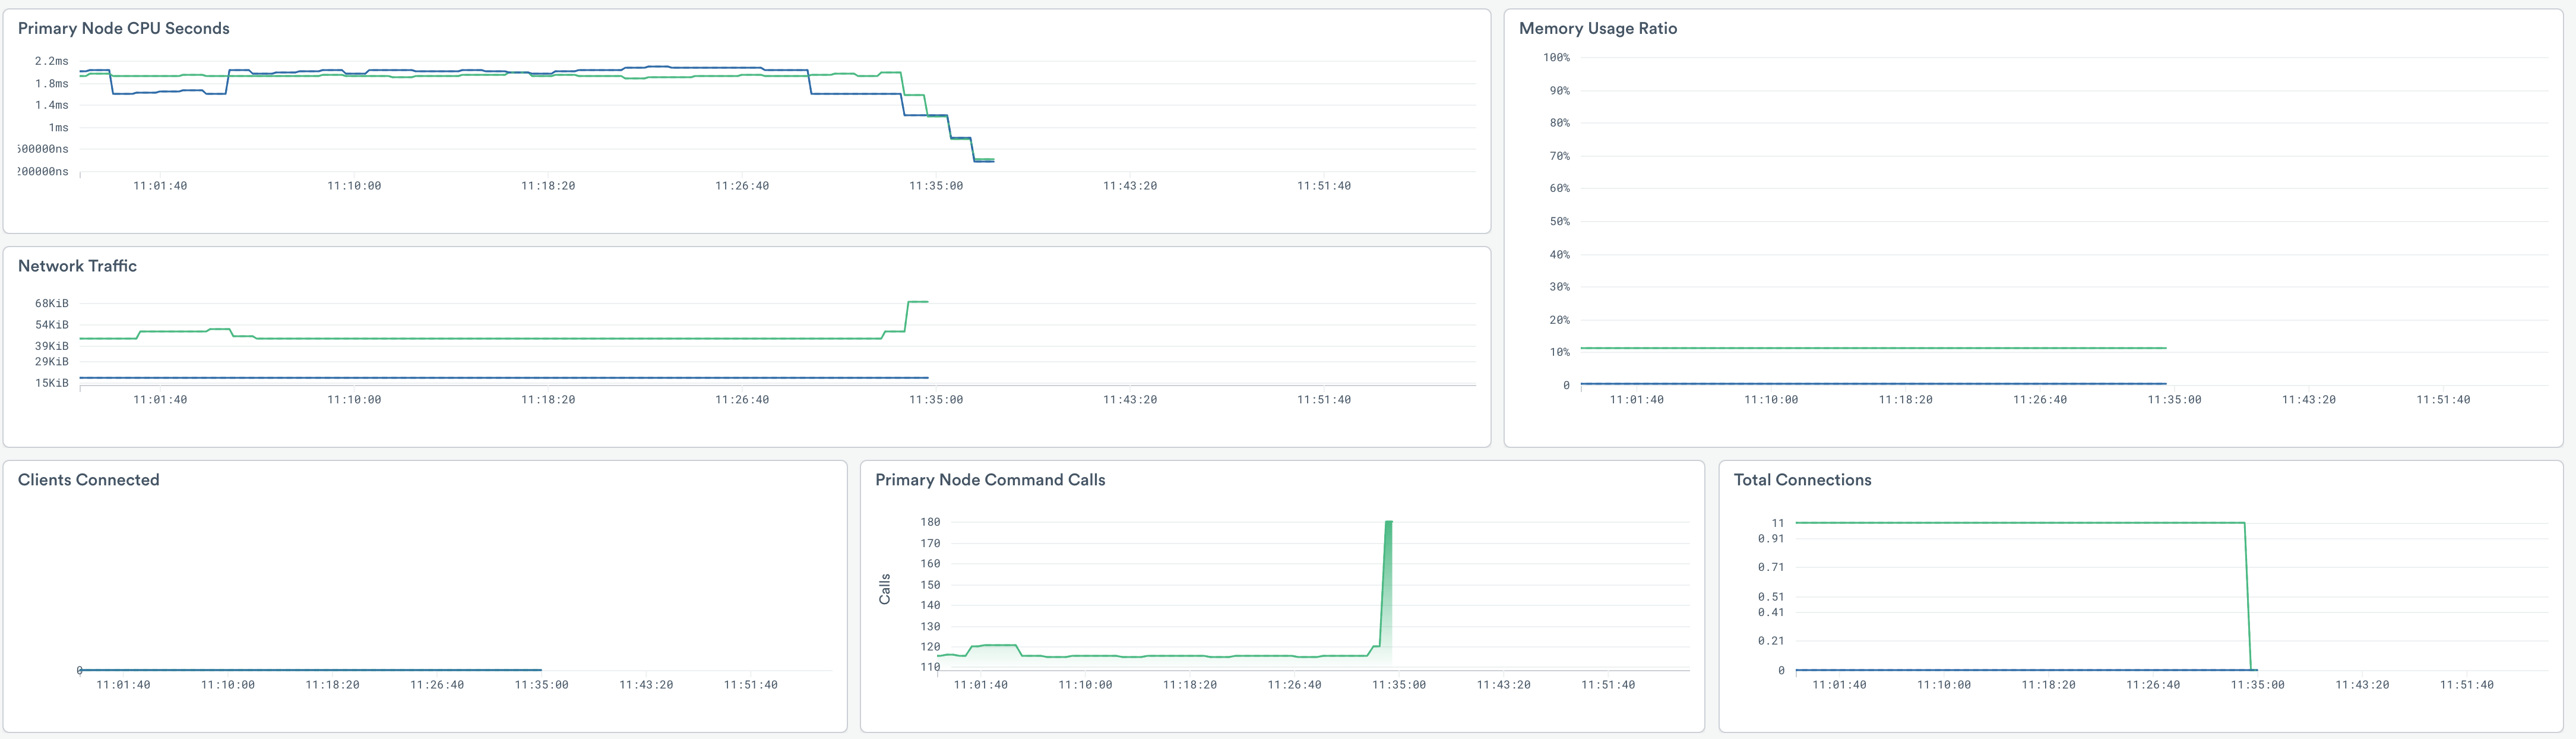
Figure 2 - Additional Monitoring Board Cards
The Keys section contains system load information such as:
Key hits
Key misses
Number of keys
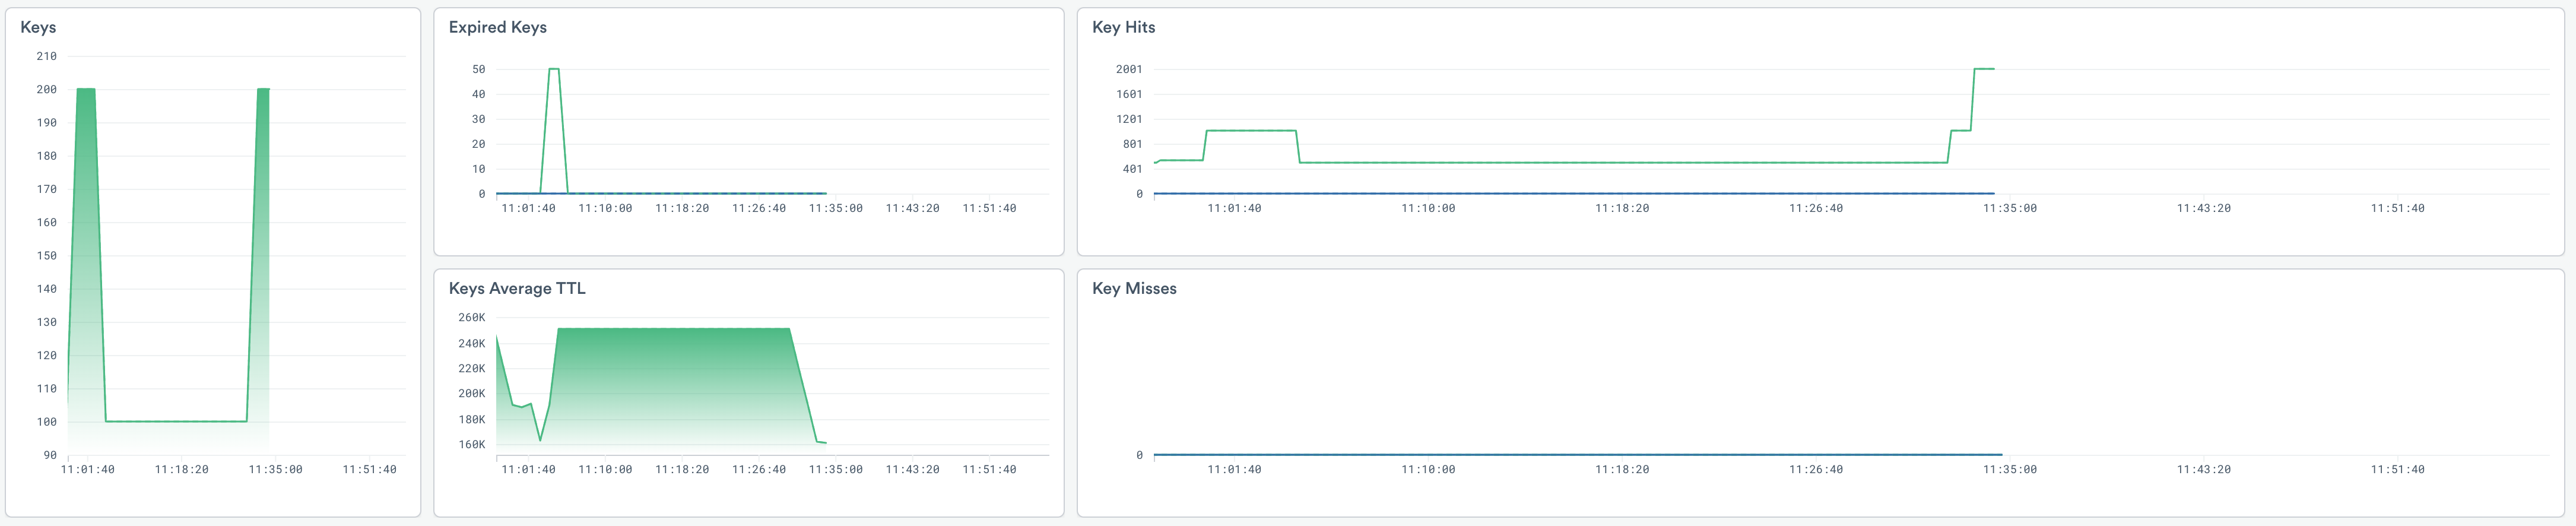
Figure 3 - Additional Monitoring Board Cards
Setup
Redis instance details are included with the Observe GCP app. If you installed the app with a custom configuration, you may need to add redis.googleapis.com/ to your poller configuration.