Amazon CloudFront
Amazon CloudFront provides a content distribution network that speeds up the distribution of your static and dynamic web content to your users. CloudFront delivers your content through a worldwide network of data centers called edge locations. When a user requests content served with CloudFront, CloudFront routes the request to the edge location with the lowest latency. This allows the delivery of your content with the best possible performance.
If the content already exists in the edge location with the lowest latency, CloudFront delivers it immediately.
If the content does not exist in that edge location, CloudFront retrieves it from a defined origin—such as an Amazon S3 bucket, a MediaPackage channel, or an HTTP server you designate as the definitive version of your content.
Observe helps you monitor the health and activity of CloudFront with the following features:
A dataset represents the core abstraction in CloudFront called a Distribution. This dataset helps you maintain an inventory of your Distributions and inspect the configurations over time.
A Monitoring Dashboard provides at-a-glance insight into the health of your distributions, for example, request error rates and origin request latencies.
Additional datasets to inspect real-time Access Logs and CloudTrail Events related to your Distributions.
Sample Monitor configurations you can configure to enable proactive alerting upon degradation of any CloudFront Distribution’s health.
The following sections describe how to configure CloudFront ingest and view details about your distributions in Observe. If you have already configured CloudFront ingest, go to Viewing CloudFront activity in Observe for more about exploring CloudFront data.
Setup
Ingesting CloudFront data with the AWS Integration
CloudFront ingest is a component of the Observe AWS integration. If you don’t have the latest version, contact Observe about updating your ingest configuration.
Because CloudFront runs as a global service, you must install the AWS Integration in the us-east-1 region. This allows the service to collect CloudFront data from all regions.
The basic CloudFront collection includes configuration snapshots and CloudWatch Metrics for AWS CloudFront. You may also enable these optional data sources:
Additional Metrics
Some metrics, such as
Origin Latency, must be enabled separately in AWS. To do this, follow the instructions at Viewing additional CloudFront distribution metrics in the AWS documentation.Real-time Access Logs
To collect detailed web access logs from your distributions, enable CloudFront real-time logs in AWS. For more information, see Amazon CloudFront announces real-time logs in the AWS documentation. Note that enabling real-time logs may incur additional AWS charges. See Enabling real-time access logs, below for instructions.
Observe does not currently support collecting CloudFront Standard Logs through an S3 bucket. Instead, Observe recommends collecting real-time logs, as log delivery provides more timely information. Real-time logs are more configurable as you can set them to log certain cache behaviors.
Important
To ingest CloudFront data, you must install the AWS Integration in us-east-1.
For more about multi-region deployments, see Collecting data from multiple regions? in the AWS integration documentation.
Enabling real-time access logs
To collect real-time access logs, you need the following resources in AWS:
A Kinesis Data Stream - serves as your real-time log configuration destination.
A Kinesis Data Delivery Stream - delivers Kinesis Data Stream records to Observe.
A CloudFront real-time log configuration - attach it to your CloudFront distribution.
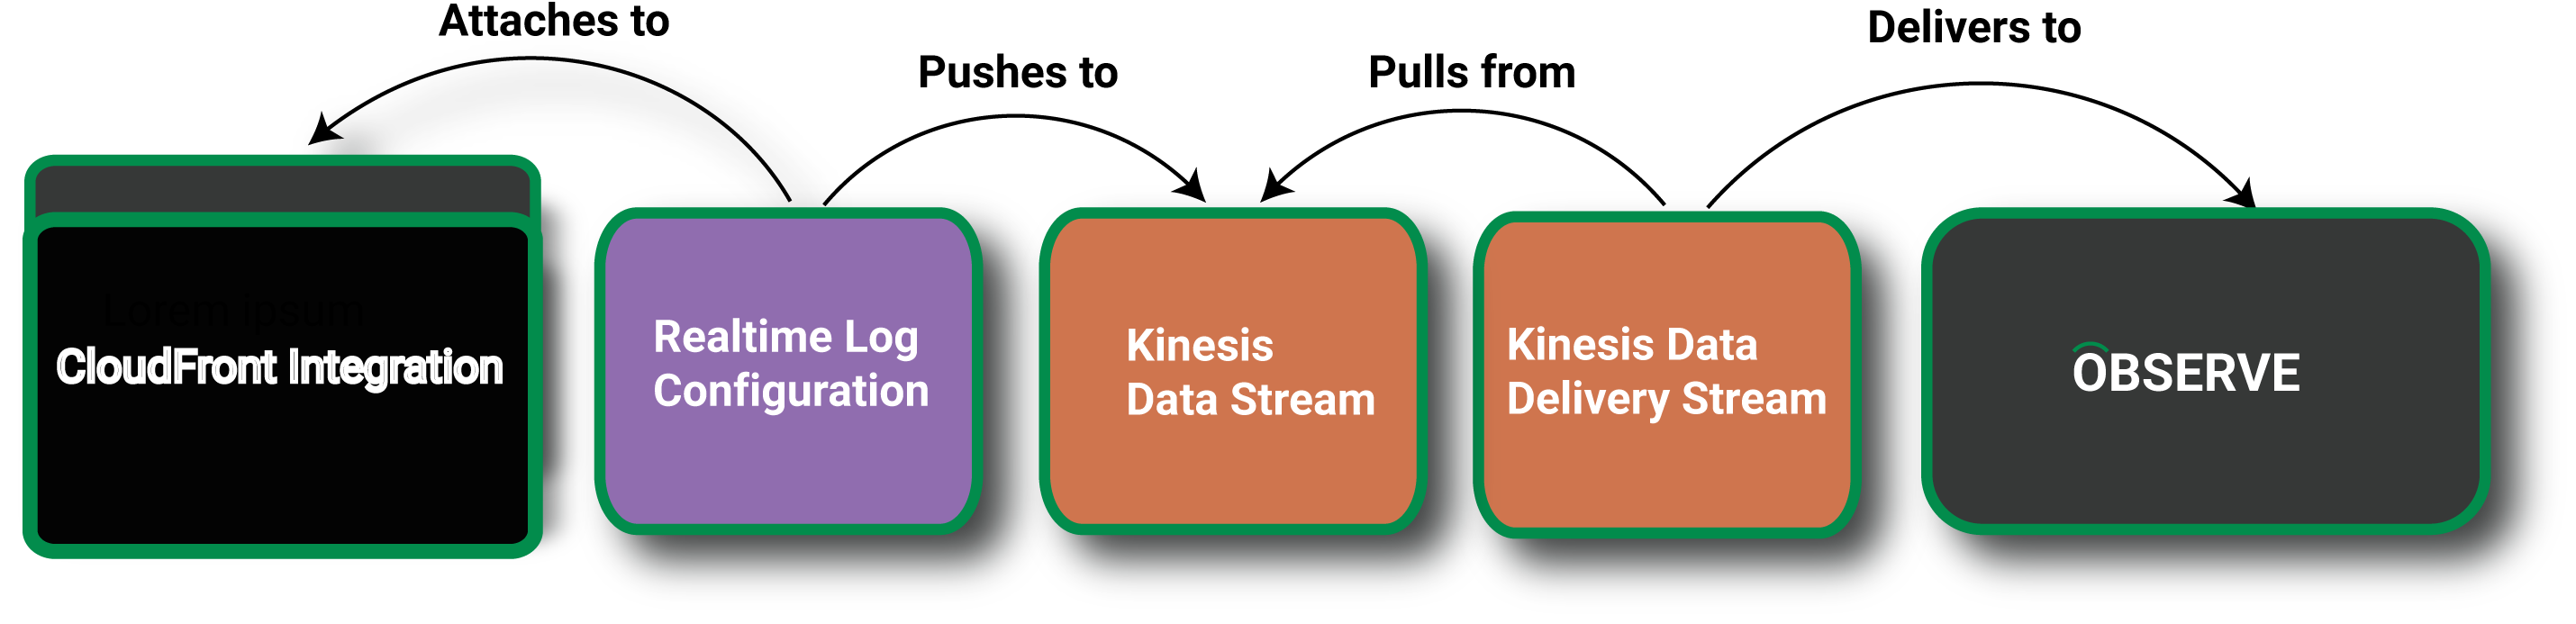
Figure 1 - Ingesting CloudFront access logs
A CloudFront distribution contains a real-time log configuration, which pushes logs to a Kinesis Data Stream. A Kinesis Data Delivery Stream pulls data from that Kinesis Data Stream and sends the data to Observe.
The instructions summarize how to create these resources in the AWS console. For additional information, see AWS CloudFront Developer Guide in the AWS documentation.
Creating a Kinesis Data Stream
Log into AWS, and locate the Kinesis service and create a Kinesis Data Stream.
Note
Because CloudFront is in the
us-east-1region, create your Kinesis Data Stream and Data Delivery Stream inus-east-1.Give the Datastream a descriptive name, such as cloudfront-to-observe. Leave all other settings at the default values.
Click Create data stream.
Creating a Kinesis Data Delivery Stream
Log into AWS, and locate the Amazon Kinesis service and create a Kinesis Data Delivery Stream.
Under Choose source and destination, select Amazon Kinesis Data Streams as the source and HTTP Endpoint as the destination.
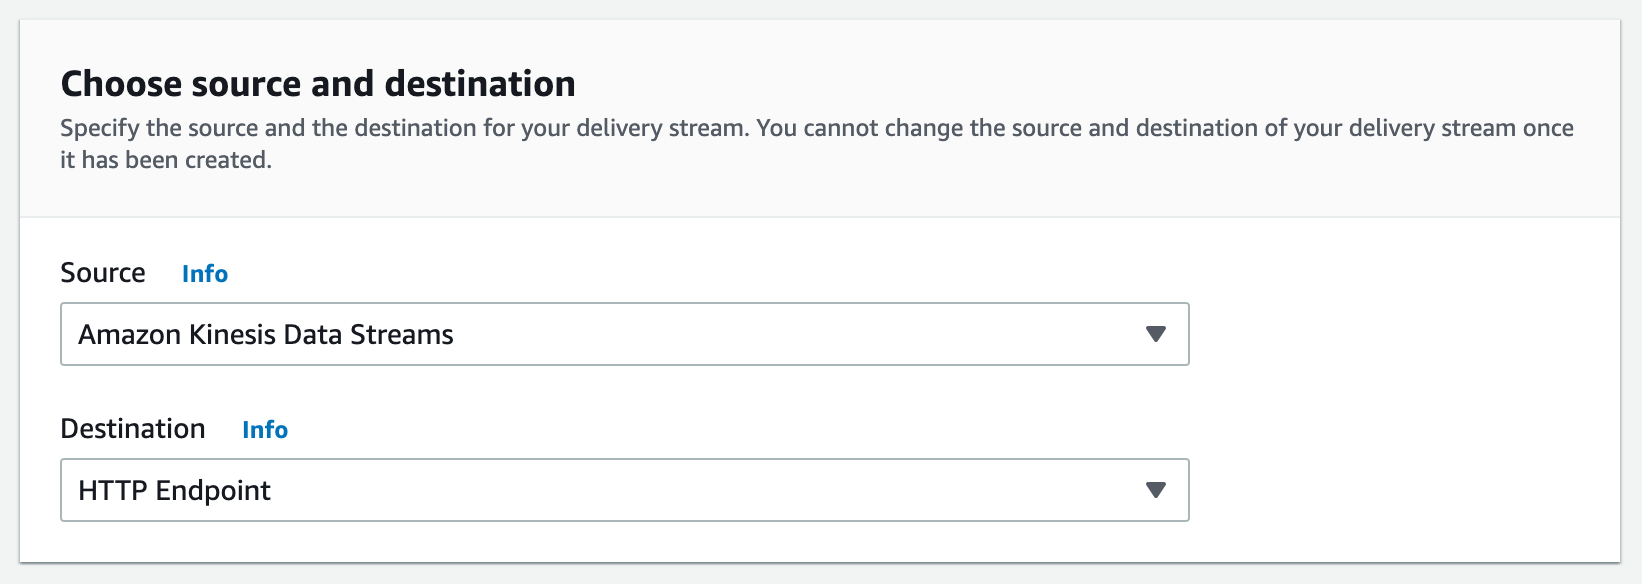
Figure 2 - Choose source and destination.
Under Source settings, click Browse, and select the Kinesis Data Stream you created in the previous section, cloudfront-to-observe.
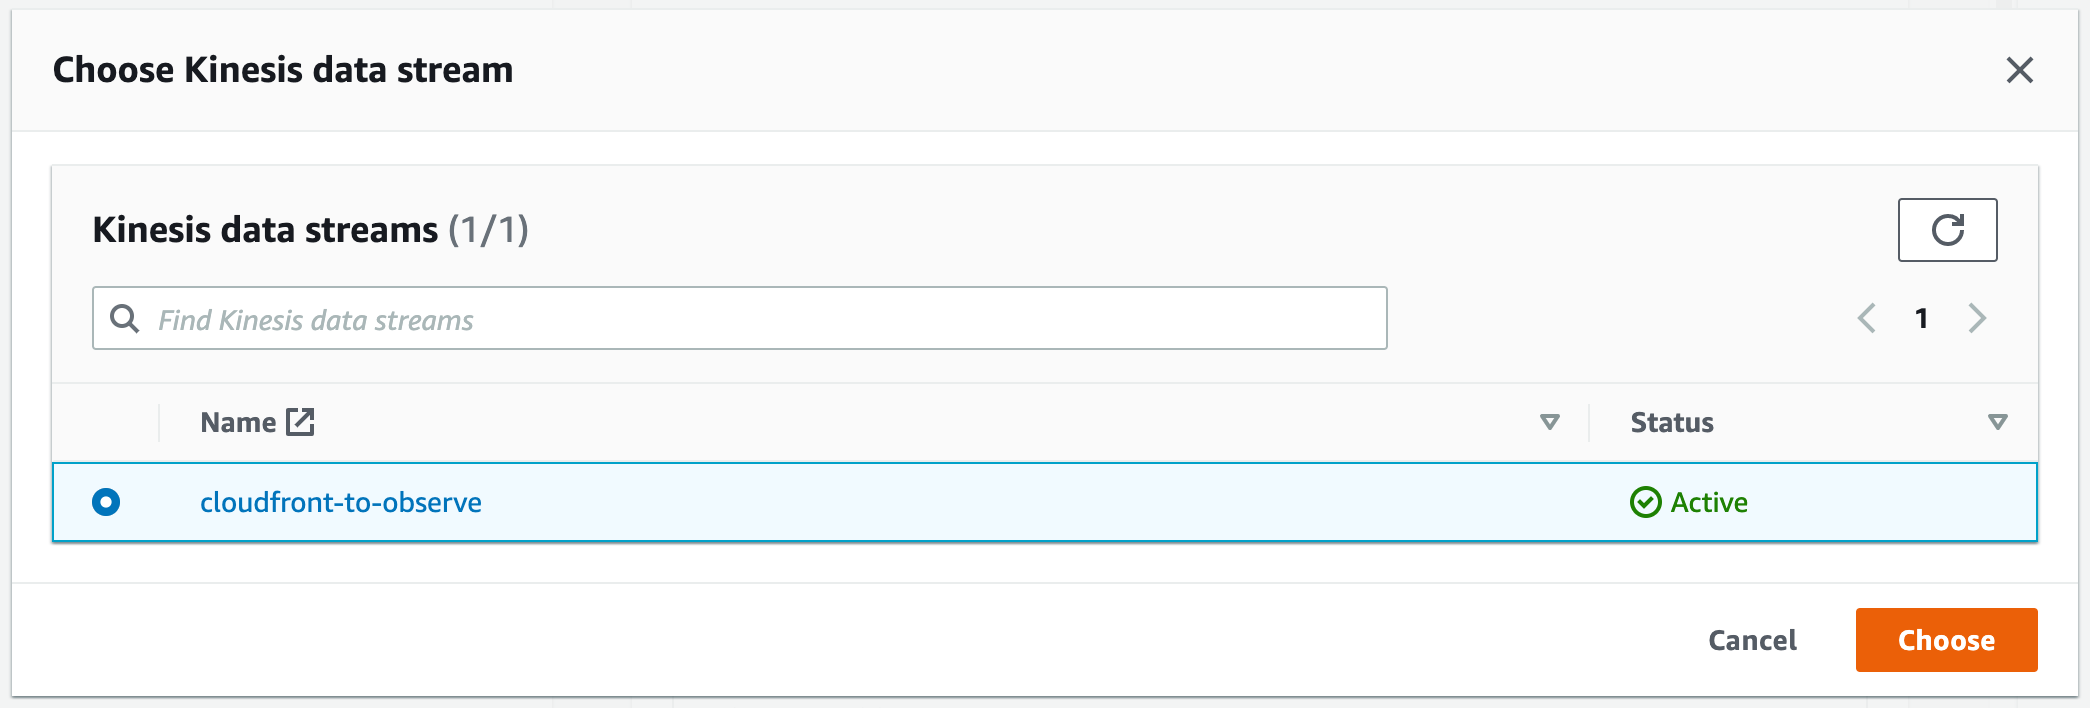
Figure 3 - Choose Kinesis data stream.
Under Delivery stream name, provide a descriptive delivery stream name, such as
cloudfront-to-observe. Leave Transform records disabled.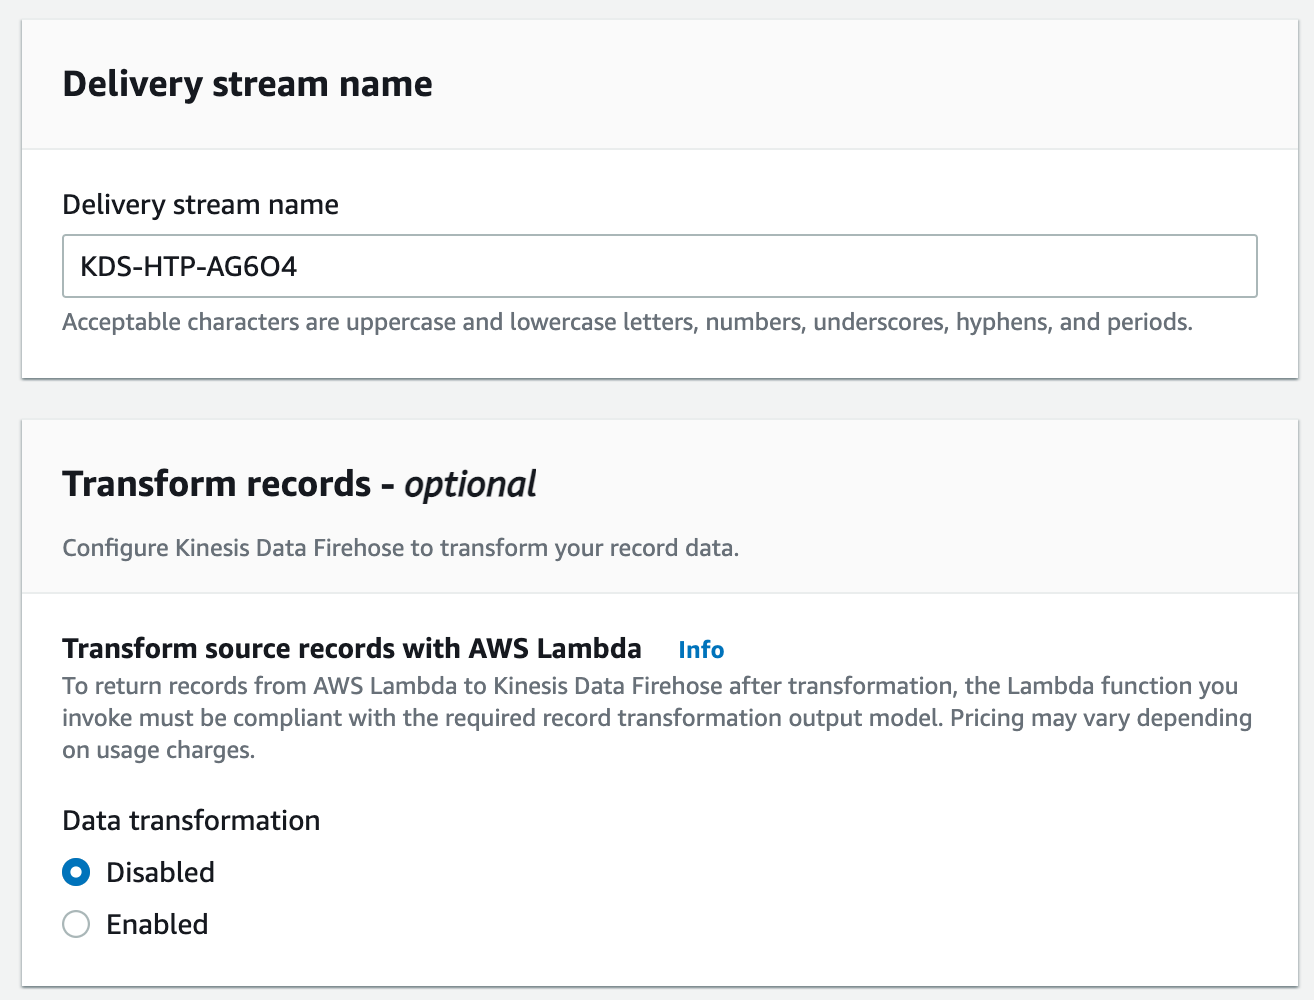
Figure 4 - Add delivery stream name.
Under Destination settings, use the following settings:
HTTP endpoint URL: https://kinesis.collect.observeinc.com.
Access key:
<CUSTOMER ID> <INGEST TOKEN>.
For example, if your customer id is 123456789012 and your ingest token is ab1cdF2GHijKLmnop34q:abcDe5f6Gh7i8JK_LmnOp9qRST1uvXYzA, you would use the following Access key: 123456789012 ab1cdF2GHijKLmnop34q:abcDe5f6Gh7i8JK_LmnOp9qRST1uvXYzA
Note
Some Observe instances may optionally use a name instead of Customer ID; if this is the case for your instance, contact your Observe Data Engineer to discuss implementation. A stem name will work as is, but a DNS redirect name may require client configuration.
6. Content encoding: GZIP
7. Retry duration: 300 seconds
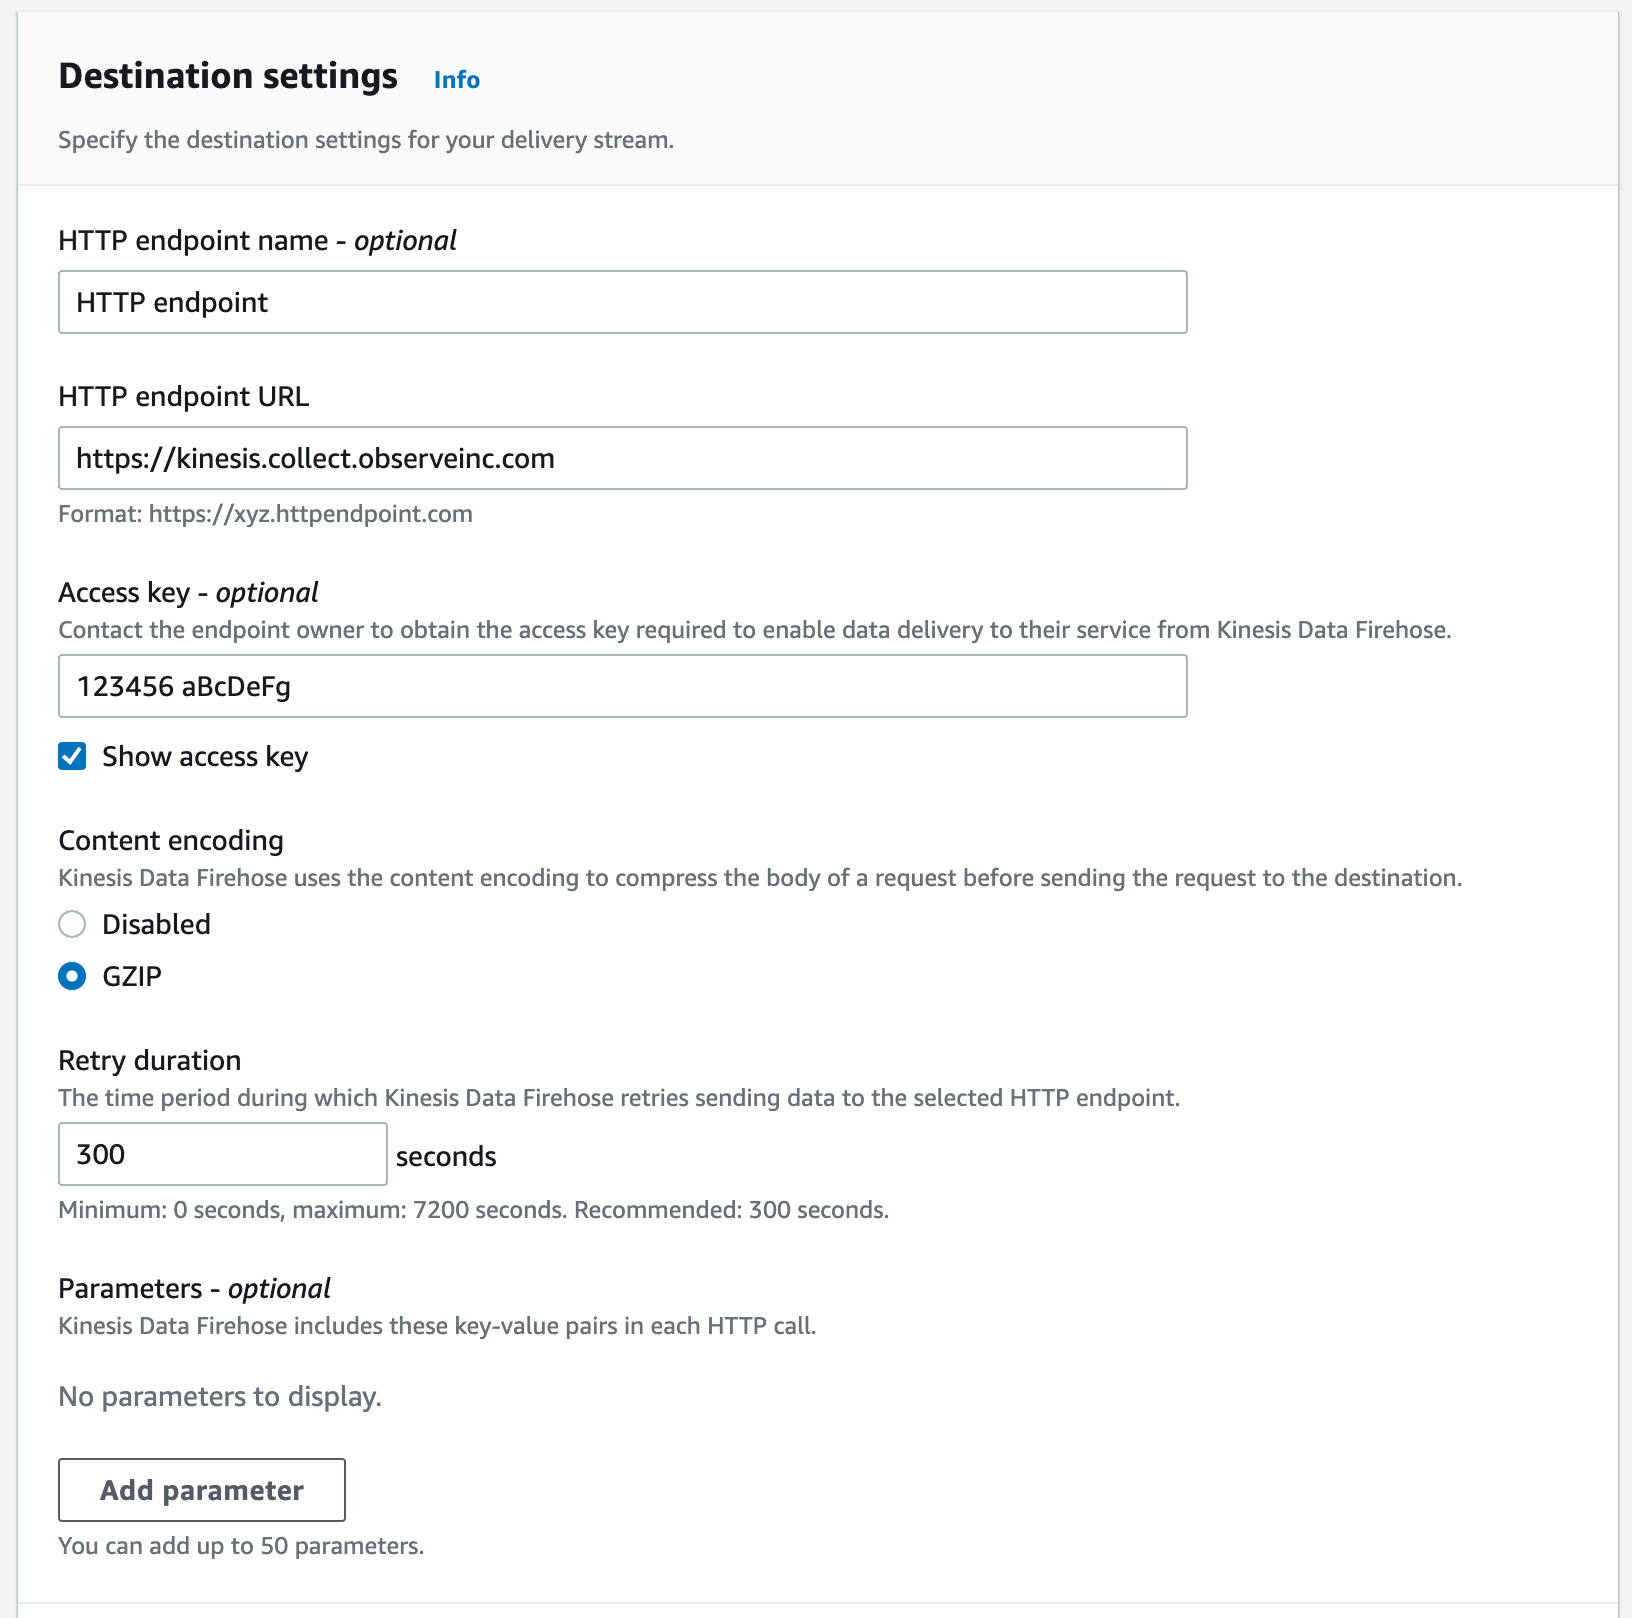
Figure 5 - Add Destination settings
8. Under Backup settings, select Failed data only.
9. If you don’t have a backup S3 bucket, create one by clicking Create. You can do this in a new browser tab.
10. Give the new bucket a unique name. For example, if your Observe Customer ID is 123456789012, you might name it cloudfront-to-observe-123456789012.
11. Optional, but strongly encouraged, to enable server-side encryption (SSE-S3 key type.)
12. Return to the previous page or browser tab to continue setting up the Kinesis Data Delivery Stream.
13. Under Backup settings, click Browse to select your backup bucket.
14. Search for the Bucket you want to use. You may need to click the “refresh” icon to see it.
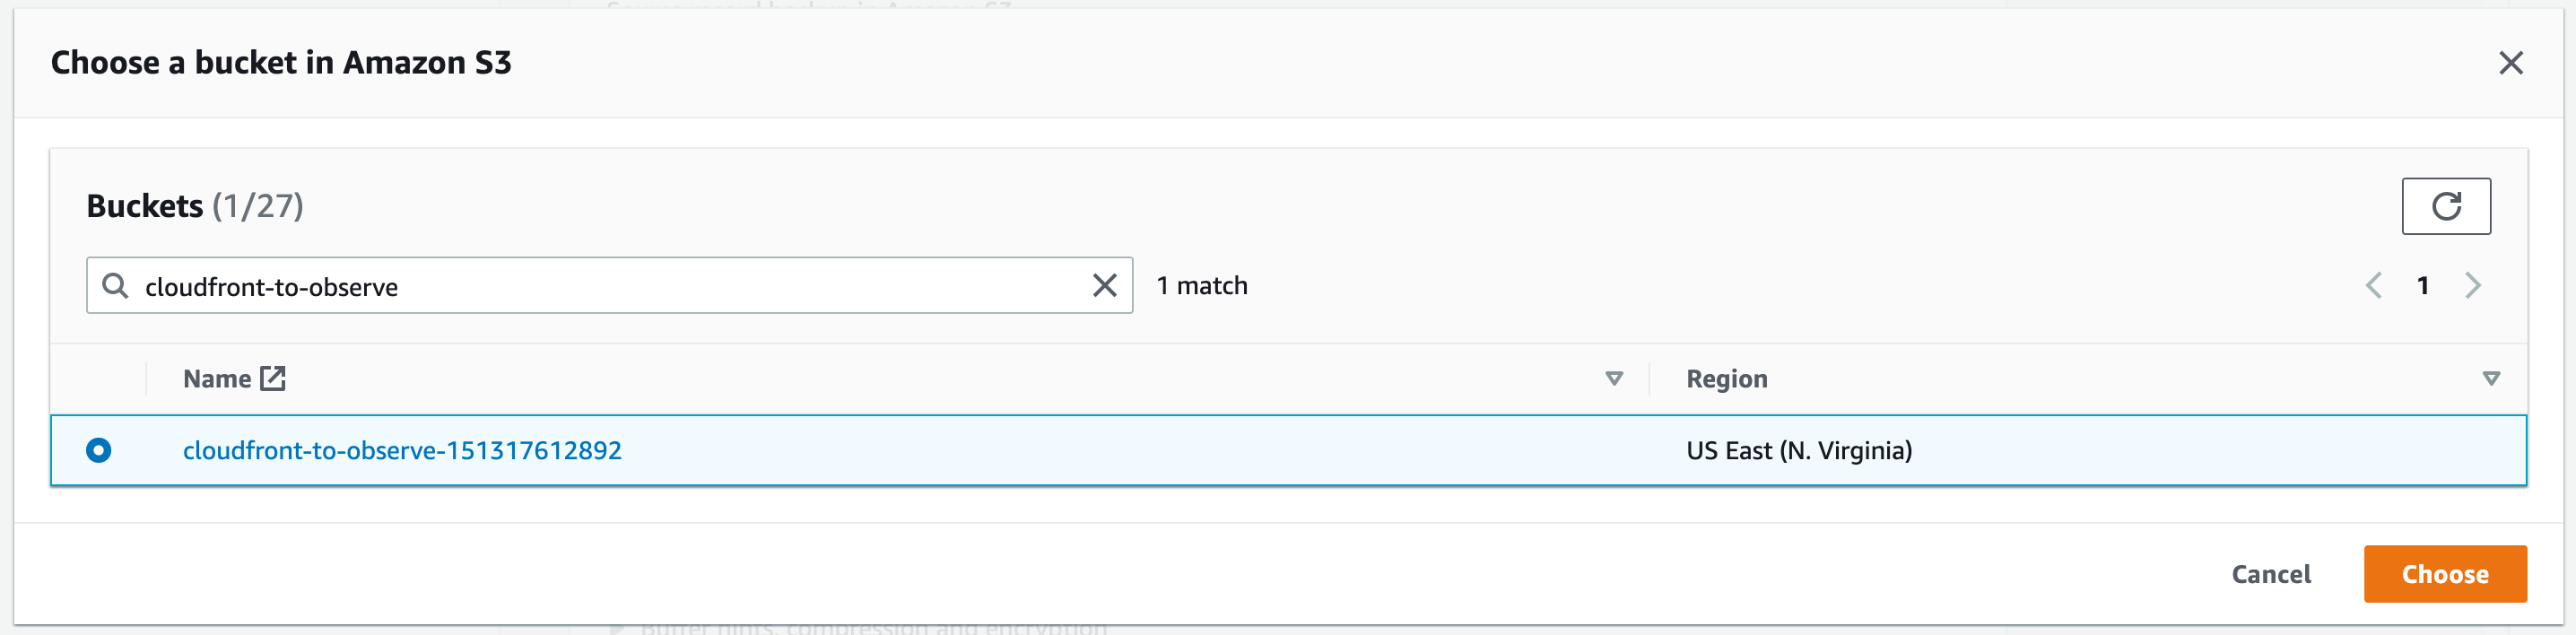
Figure 6 - Choose an Amazon S3 bucket.
15. Click Create delivery stream.
Creating a real-time log configuration
Visit https://console.aws.amazon.com/cloudfront/v3/home?region=us-east-1#/logs/create to create a CloudFront real-time log configuration.
Enter a descriptive name, for example,
cloudfront-to-observe.Enter a sampling rate.
Set the rate to 100% for distributions with modest usage. If you have concerns about additional AWS costs for real-time logging, Observe recommends starting with 1% for busy distributions. You can increase the sampling rate later.
Under Fields, select every single field.
Important
You must include every field to enable Observe to parse real-time logs correctly. AWS does not include a header with real-time logs, so Observe uses the relative position of each field to identify them in the incoming data.
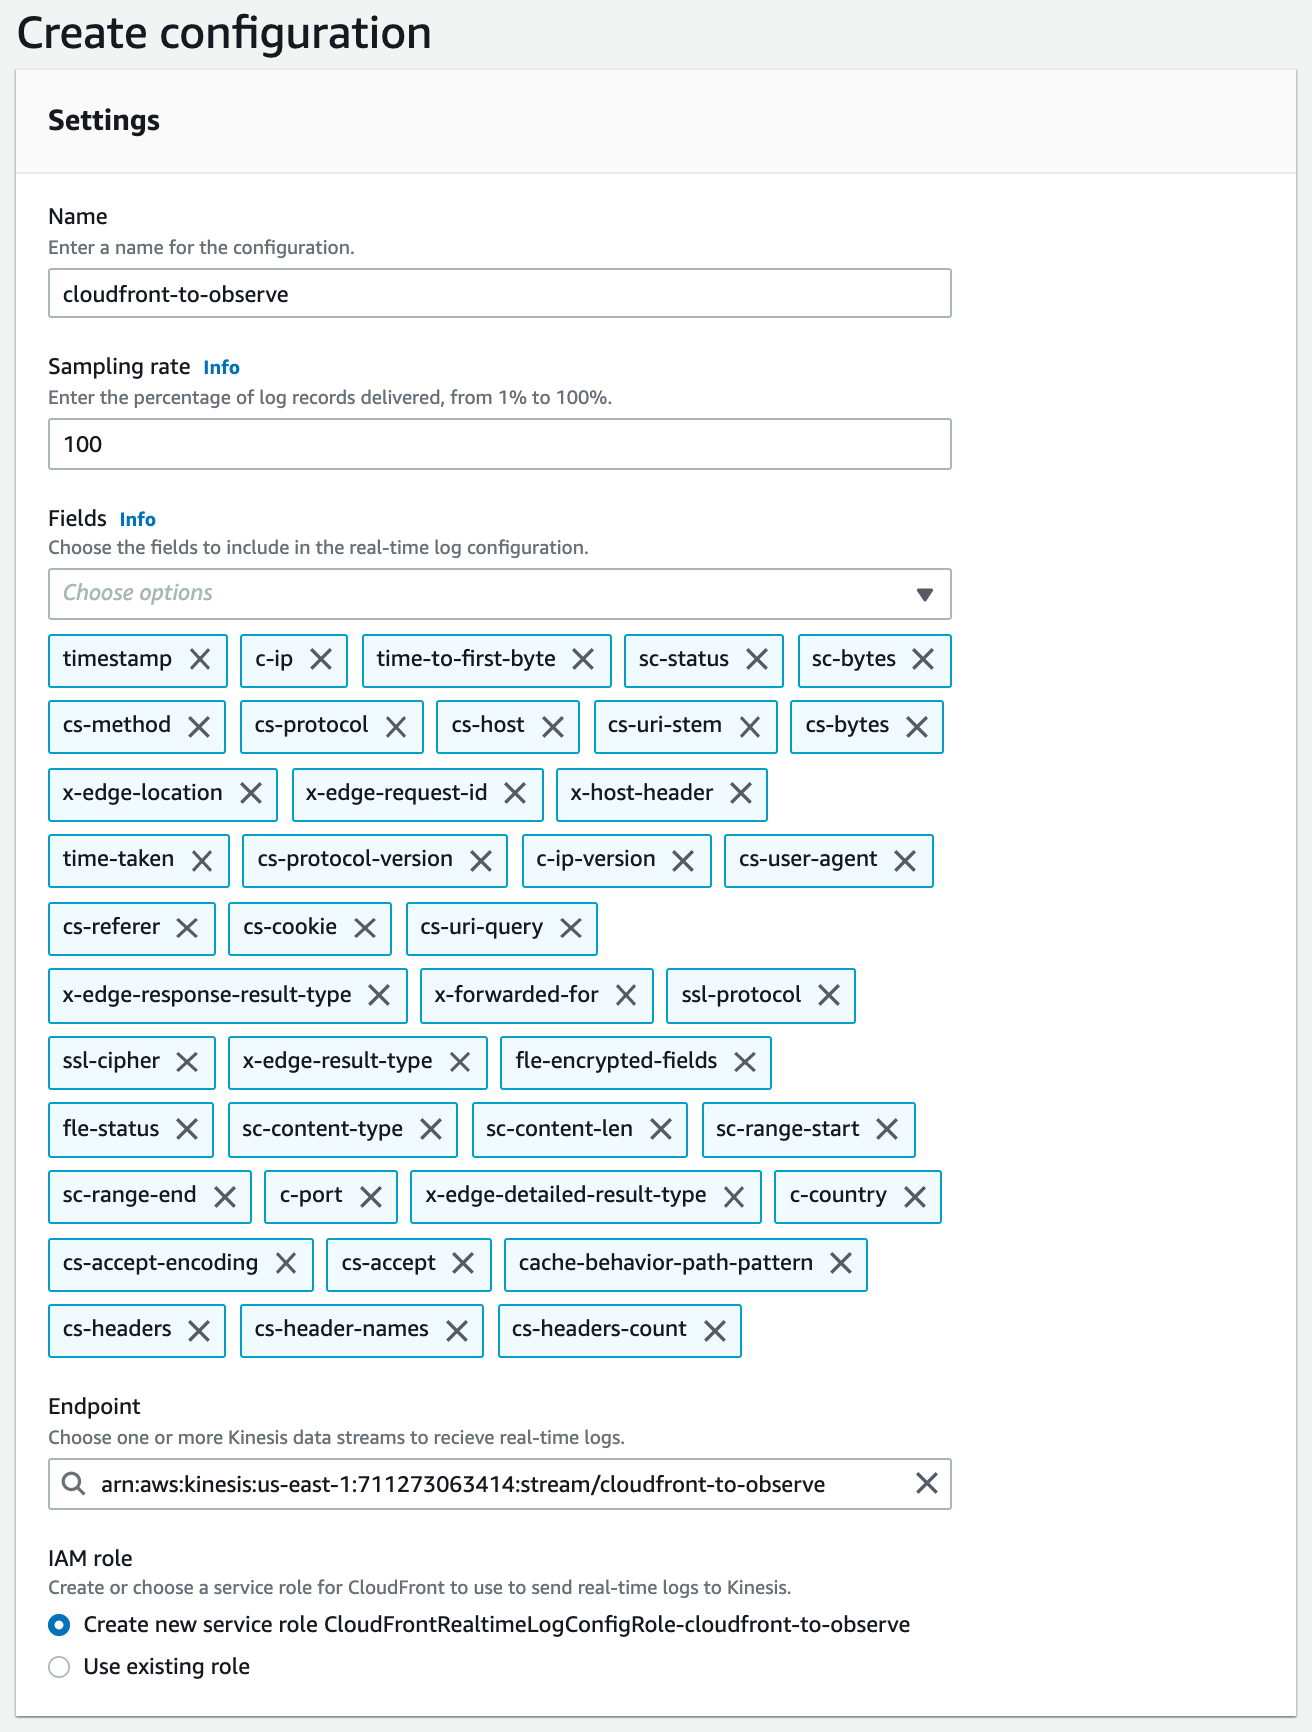
Figure 7 - Create a CloudFront real-time log.
Select one Distribution to attach this configuration. If you have multiple CloudFront Distributions you want to monitor, you can attach them in the next step.
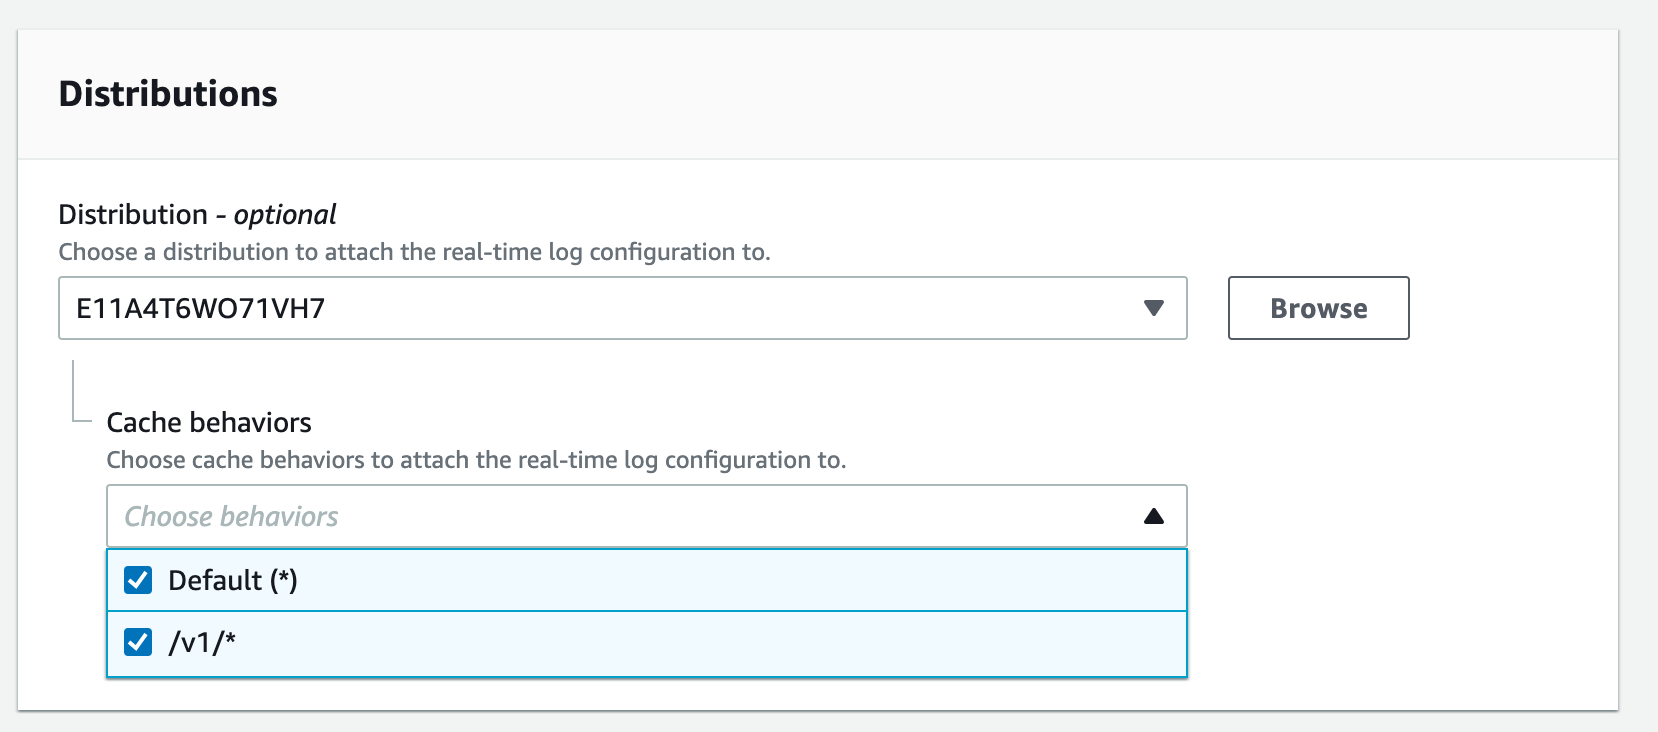
Figure 8 - CloudFront settings
To attach additional Distributions to this real-time logs configuration, navigate to CloudFront > Logs > Real-time log configurations, and click the configuration you just created.
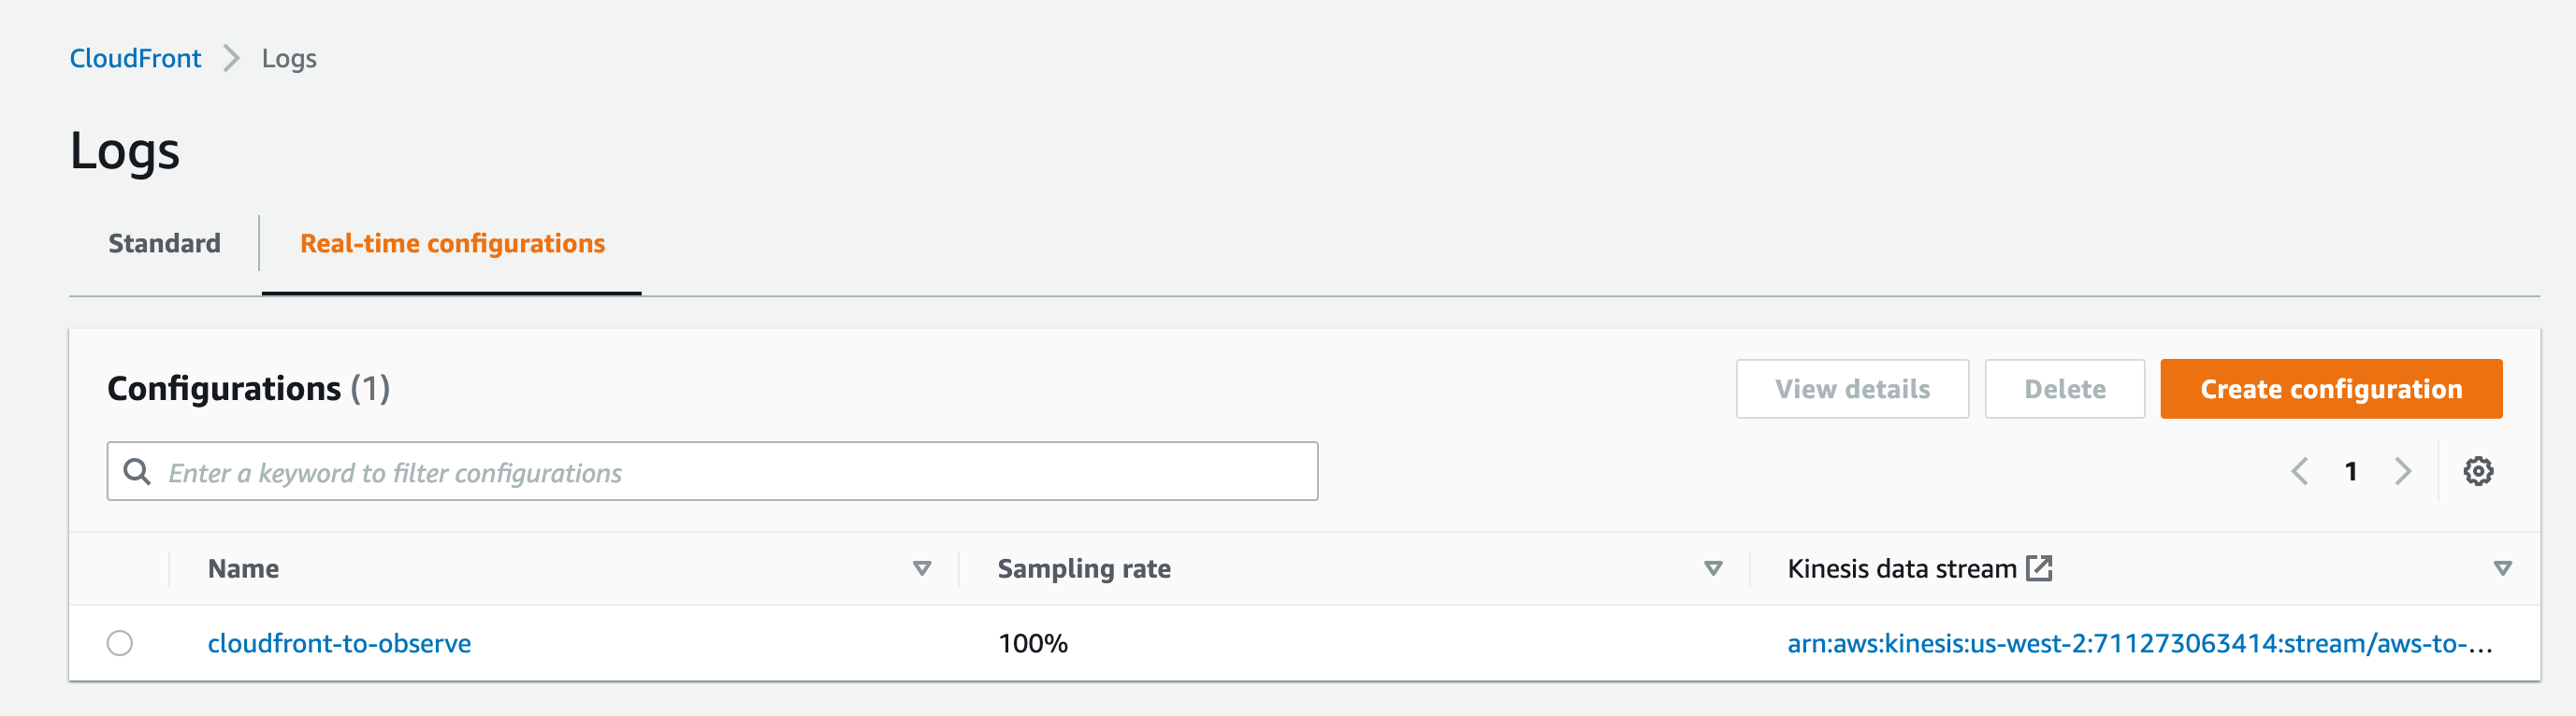
Figure 9 - CloudFront to Observe configuration
Scroll to the bottom and click Attach to distribution to attach additional distributions.
Note
A distribution may only have one real-time log configuration at a time. You may not attach more than one configuration to the same distribution.
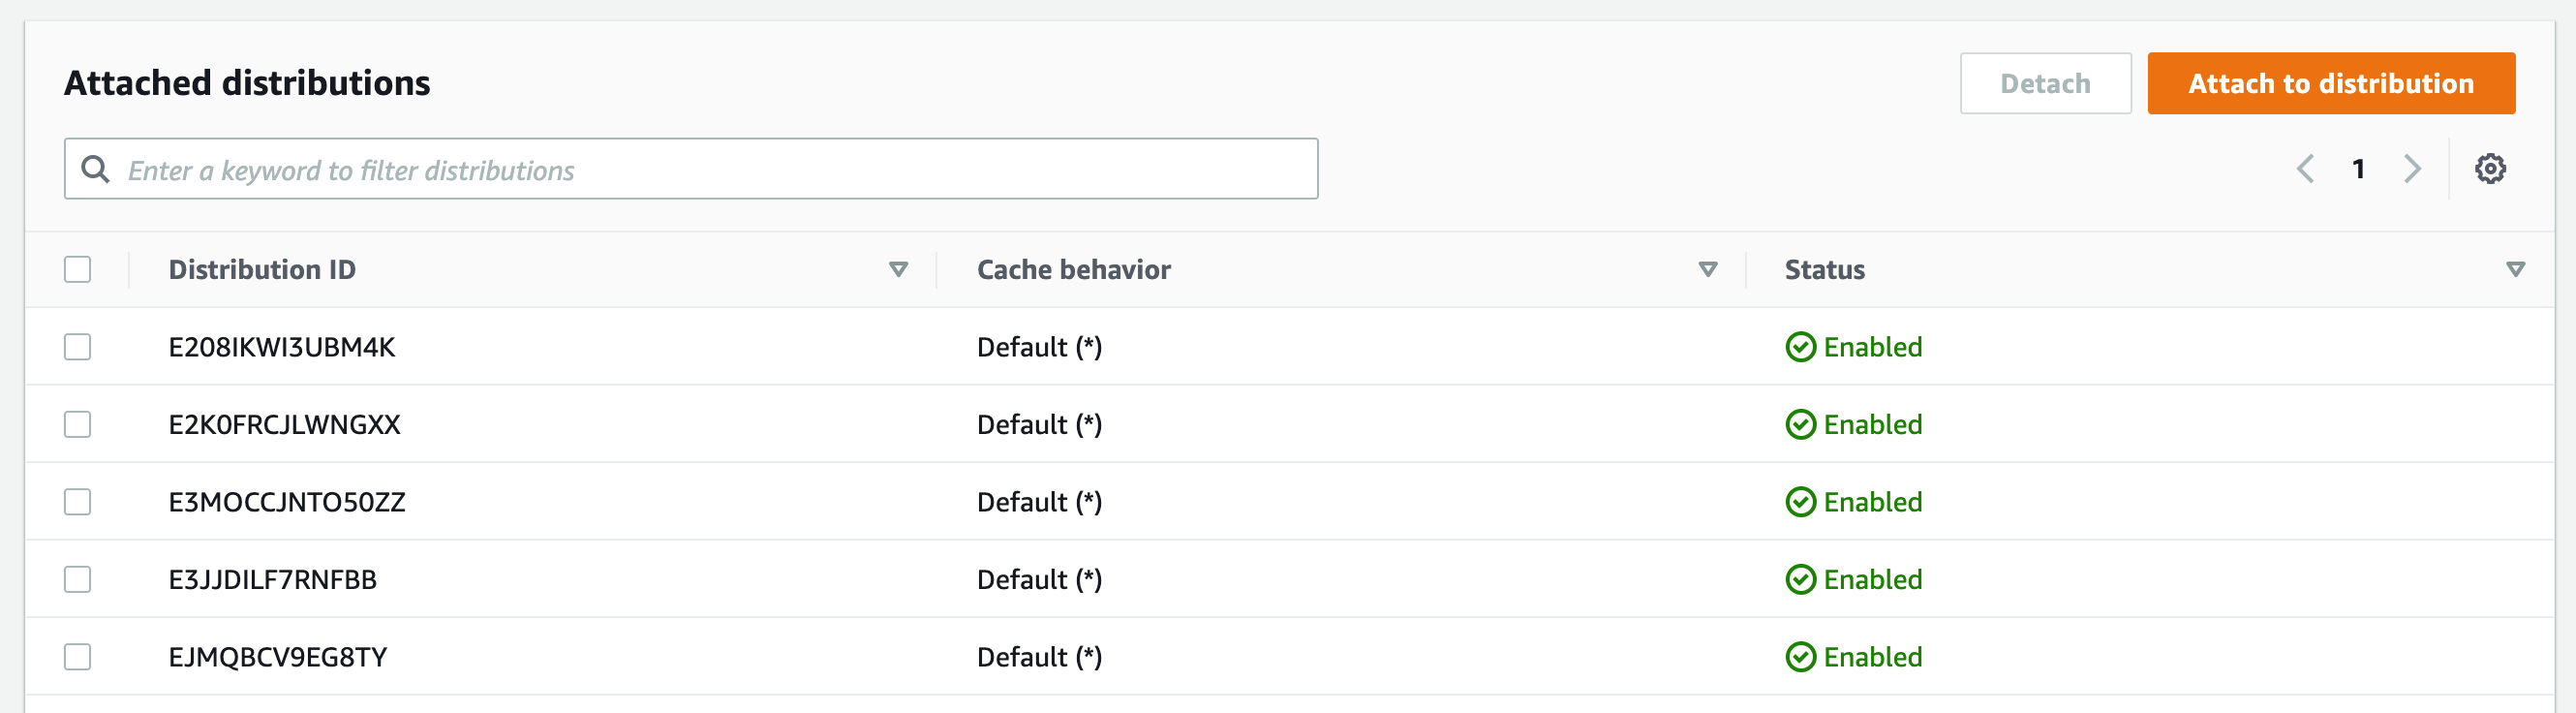
Figure 10 - List of distributions attached to the configuration.
Verifying real-time log forwarding
To verify sending the real-time logs to Observe, open the CloudFront Access Logs dataset in Observe. If you have configured everything correctly, you should see CloudFront real-time logs in this dataset within a few minutes.
If no records appear within 5-10 minutes, inspect your Kinesis Data Delivery Stream configuration in the AWS Management Console. Verify that the HTTP endpoint delivery success metric indicates 100% successful delivery.
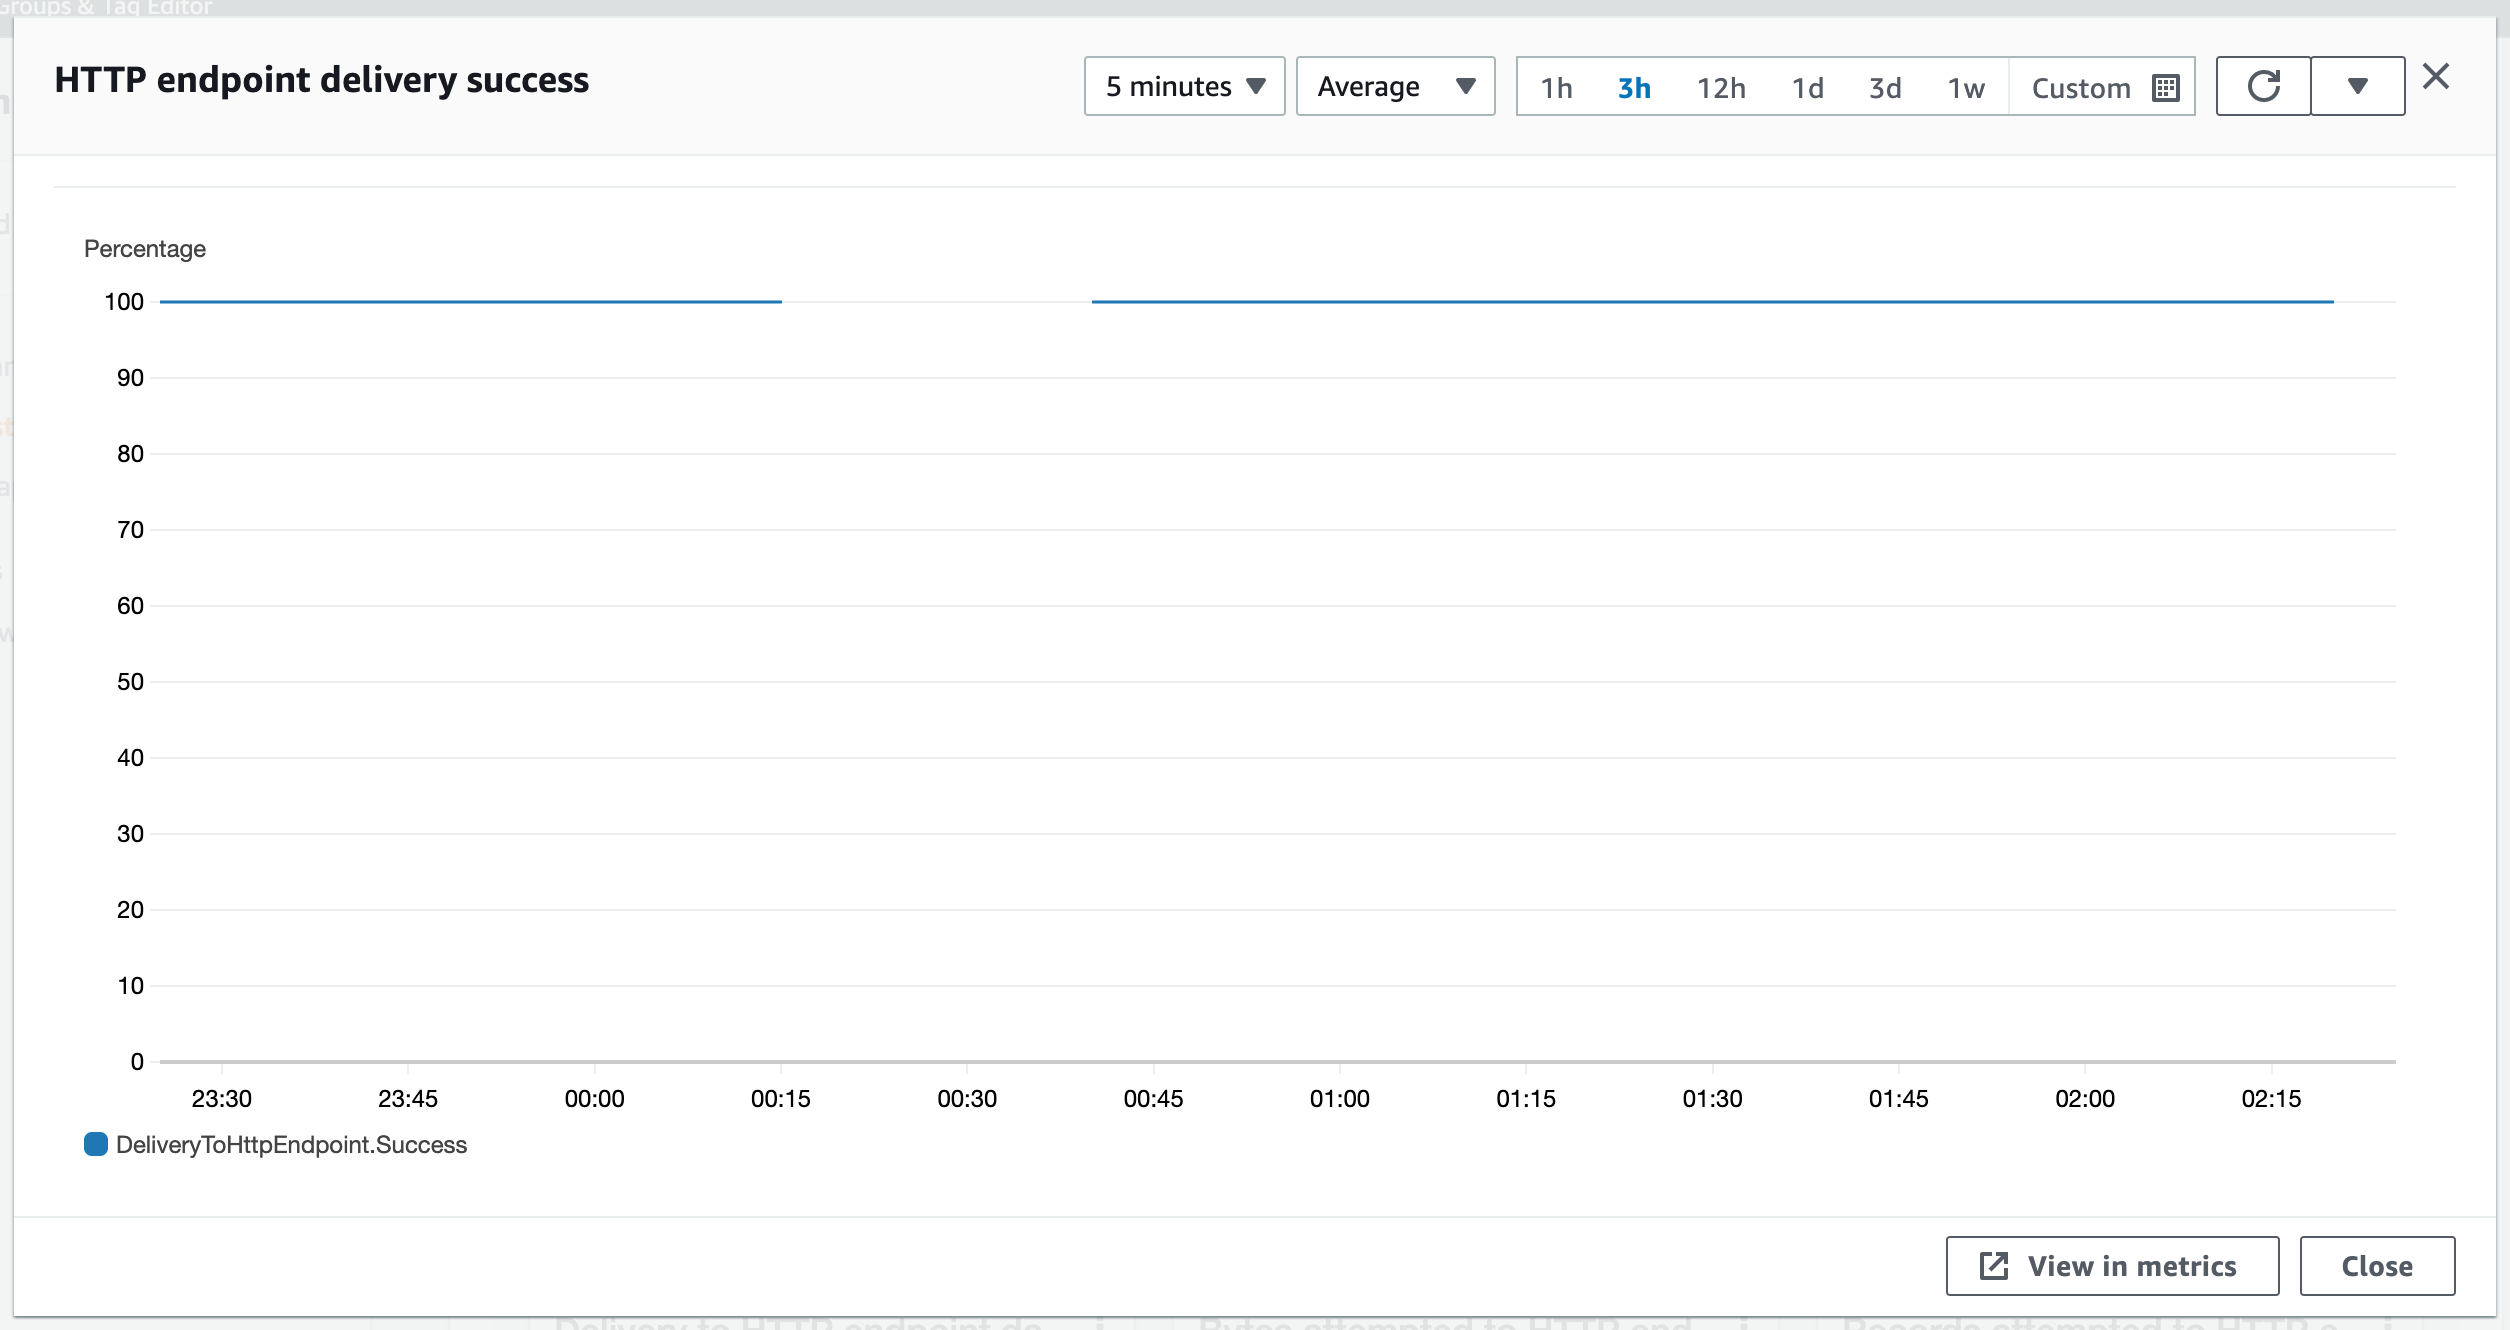
Figure 11 - HTTP endpoint delivery success
If you see a success rate of less than 100%, check the Kinesis Data Delivery Stream settings to ensure you have the correct access key.
If you don’t see data plotted, the Kinesis Data Delivery Stream isn’t receiving any data. Check your real-time logging configuration to confirm you attached it to the CloudFront Distribution in active use.
Viewing CloudFront activity in Observe
To see details of your distributions, go to the CloudFront Distributions dataset in Observe. The dashboard displays an overview of the activity and health of your CloudFront distributions.
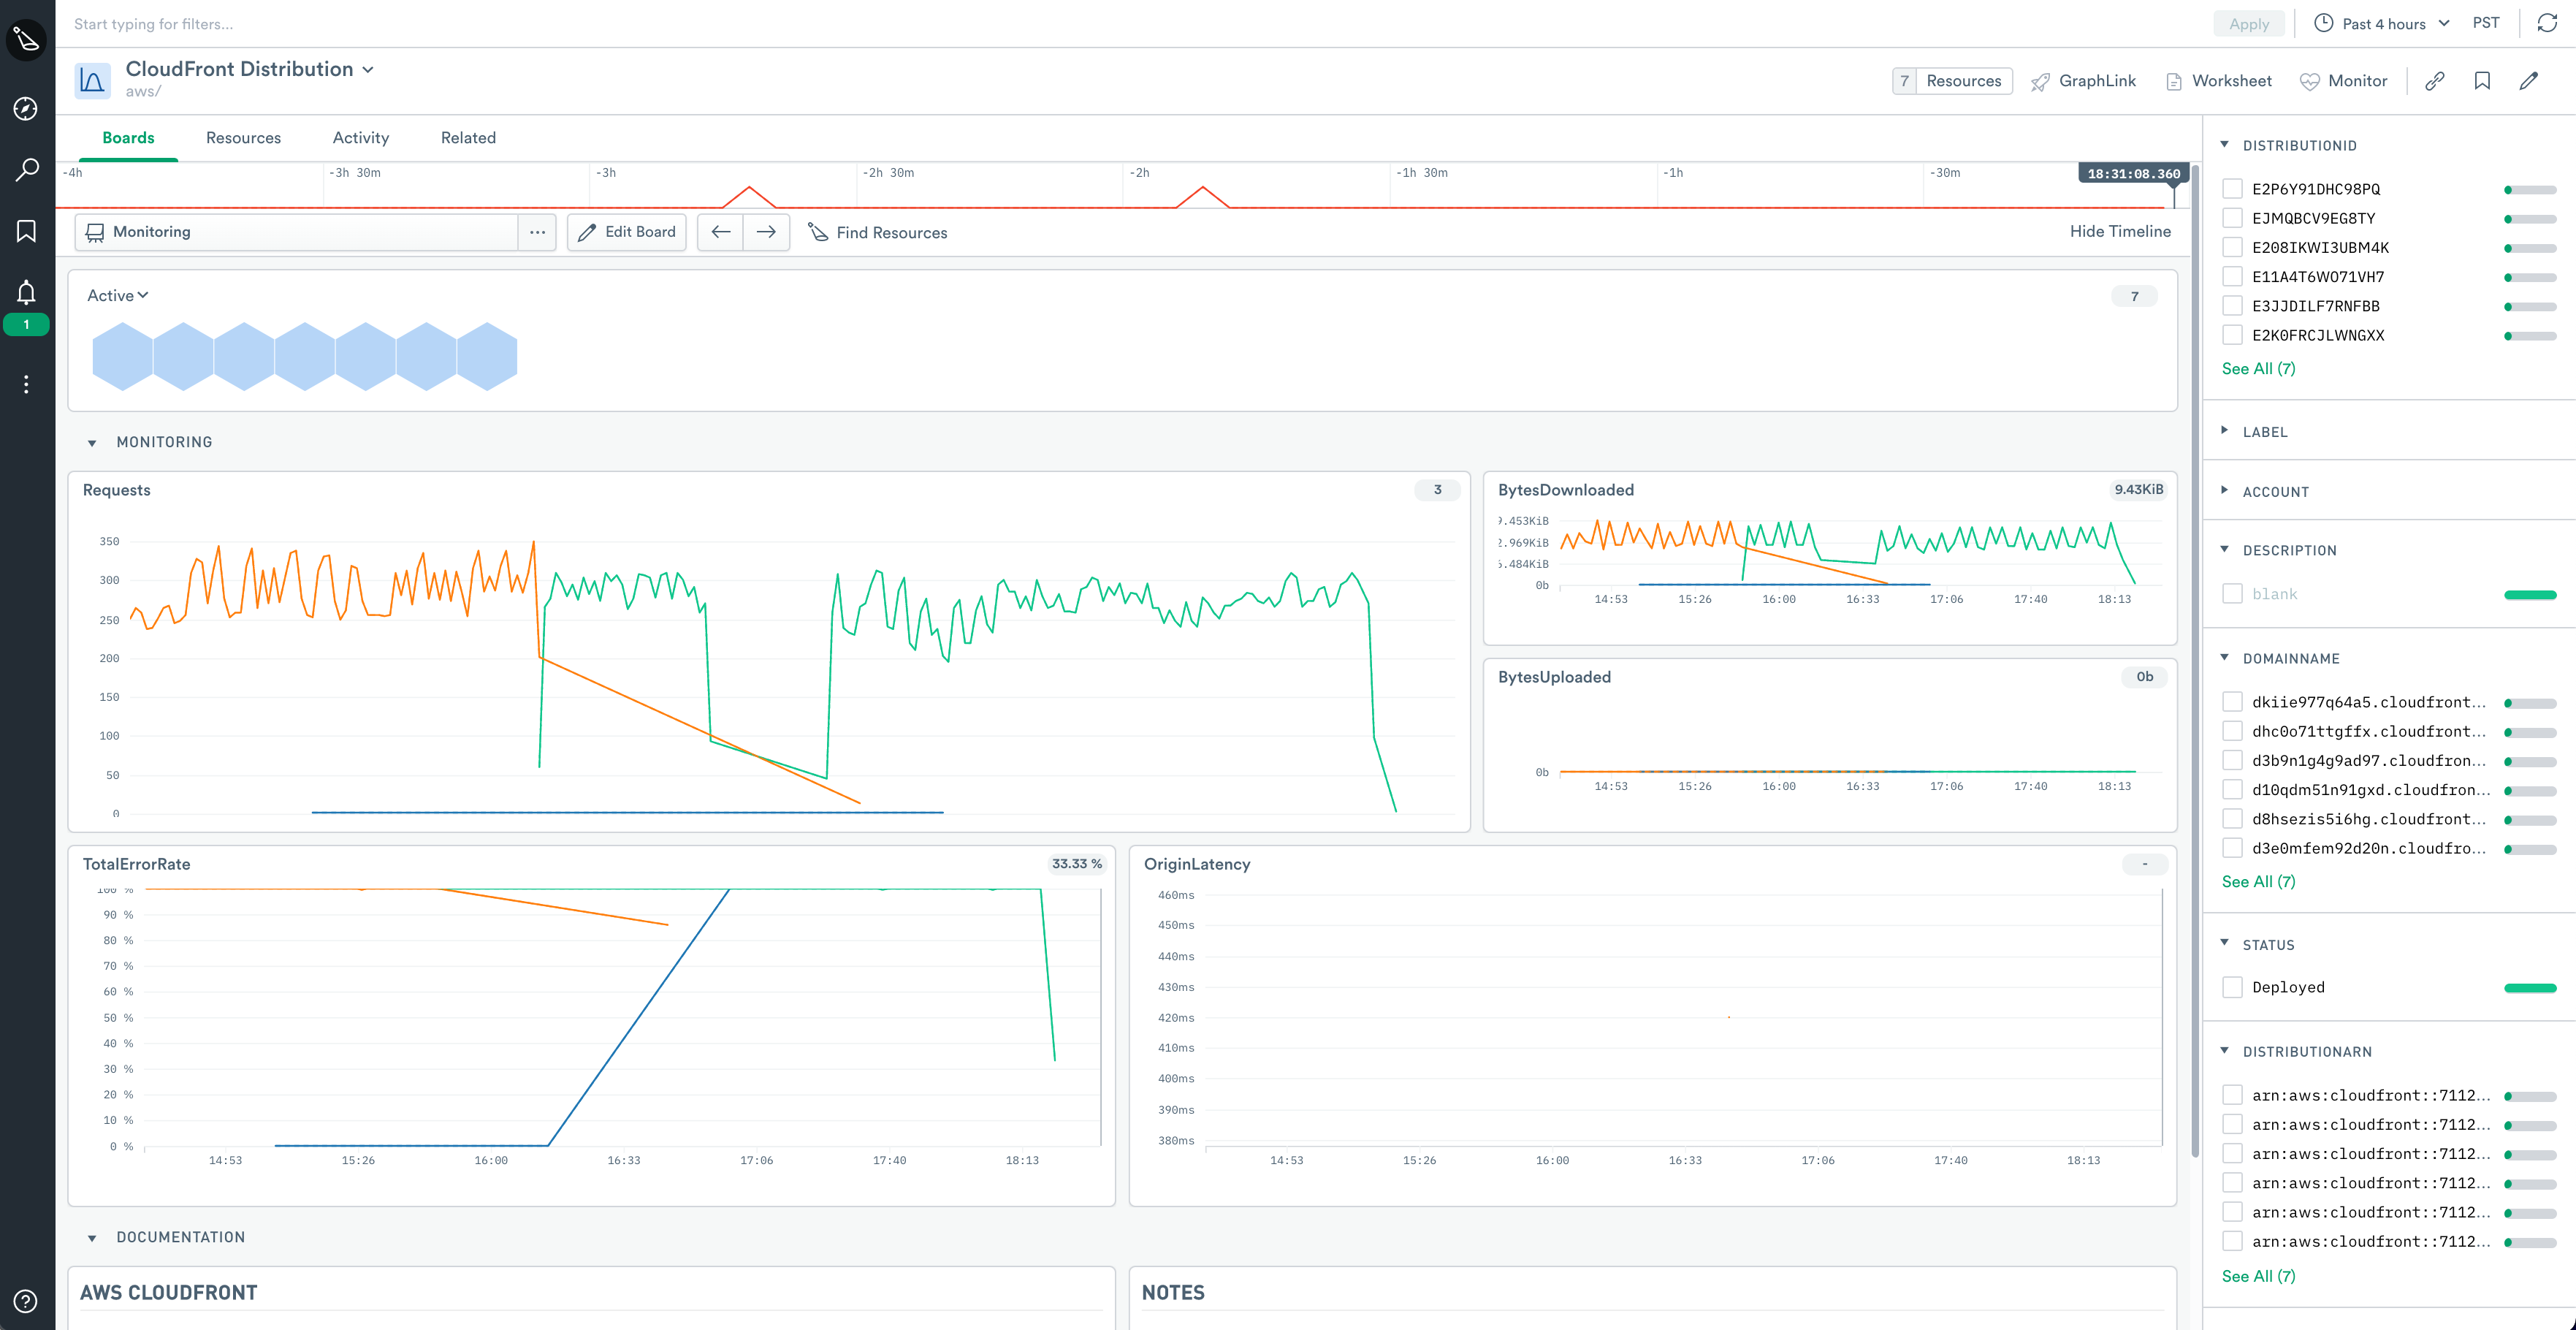
Figure 12 - CloudFront Distribution landing page in Observe
This dashboard includes metrics useful for performance and health monitoring, including the following parameters:
Requests - The number of requests your CloudFront Distribution has served over time.
TotalErrorRate - The fraction of requests that resulted in an HTTP error (4xx or 5xx).
OriginLatency - The average latency to fill cache misses from origin servers.
Access the real-time logs associated with CloudFront Distributions by either opening the CloudFront Access Logs dataset or selecting the CloudFront Access Logs dataset under the Activity tab of the CloudFront Distributions page.
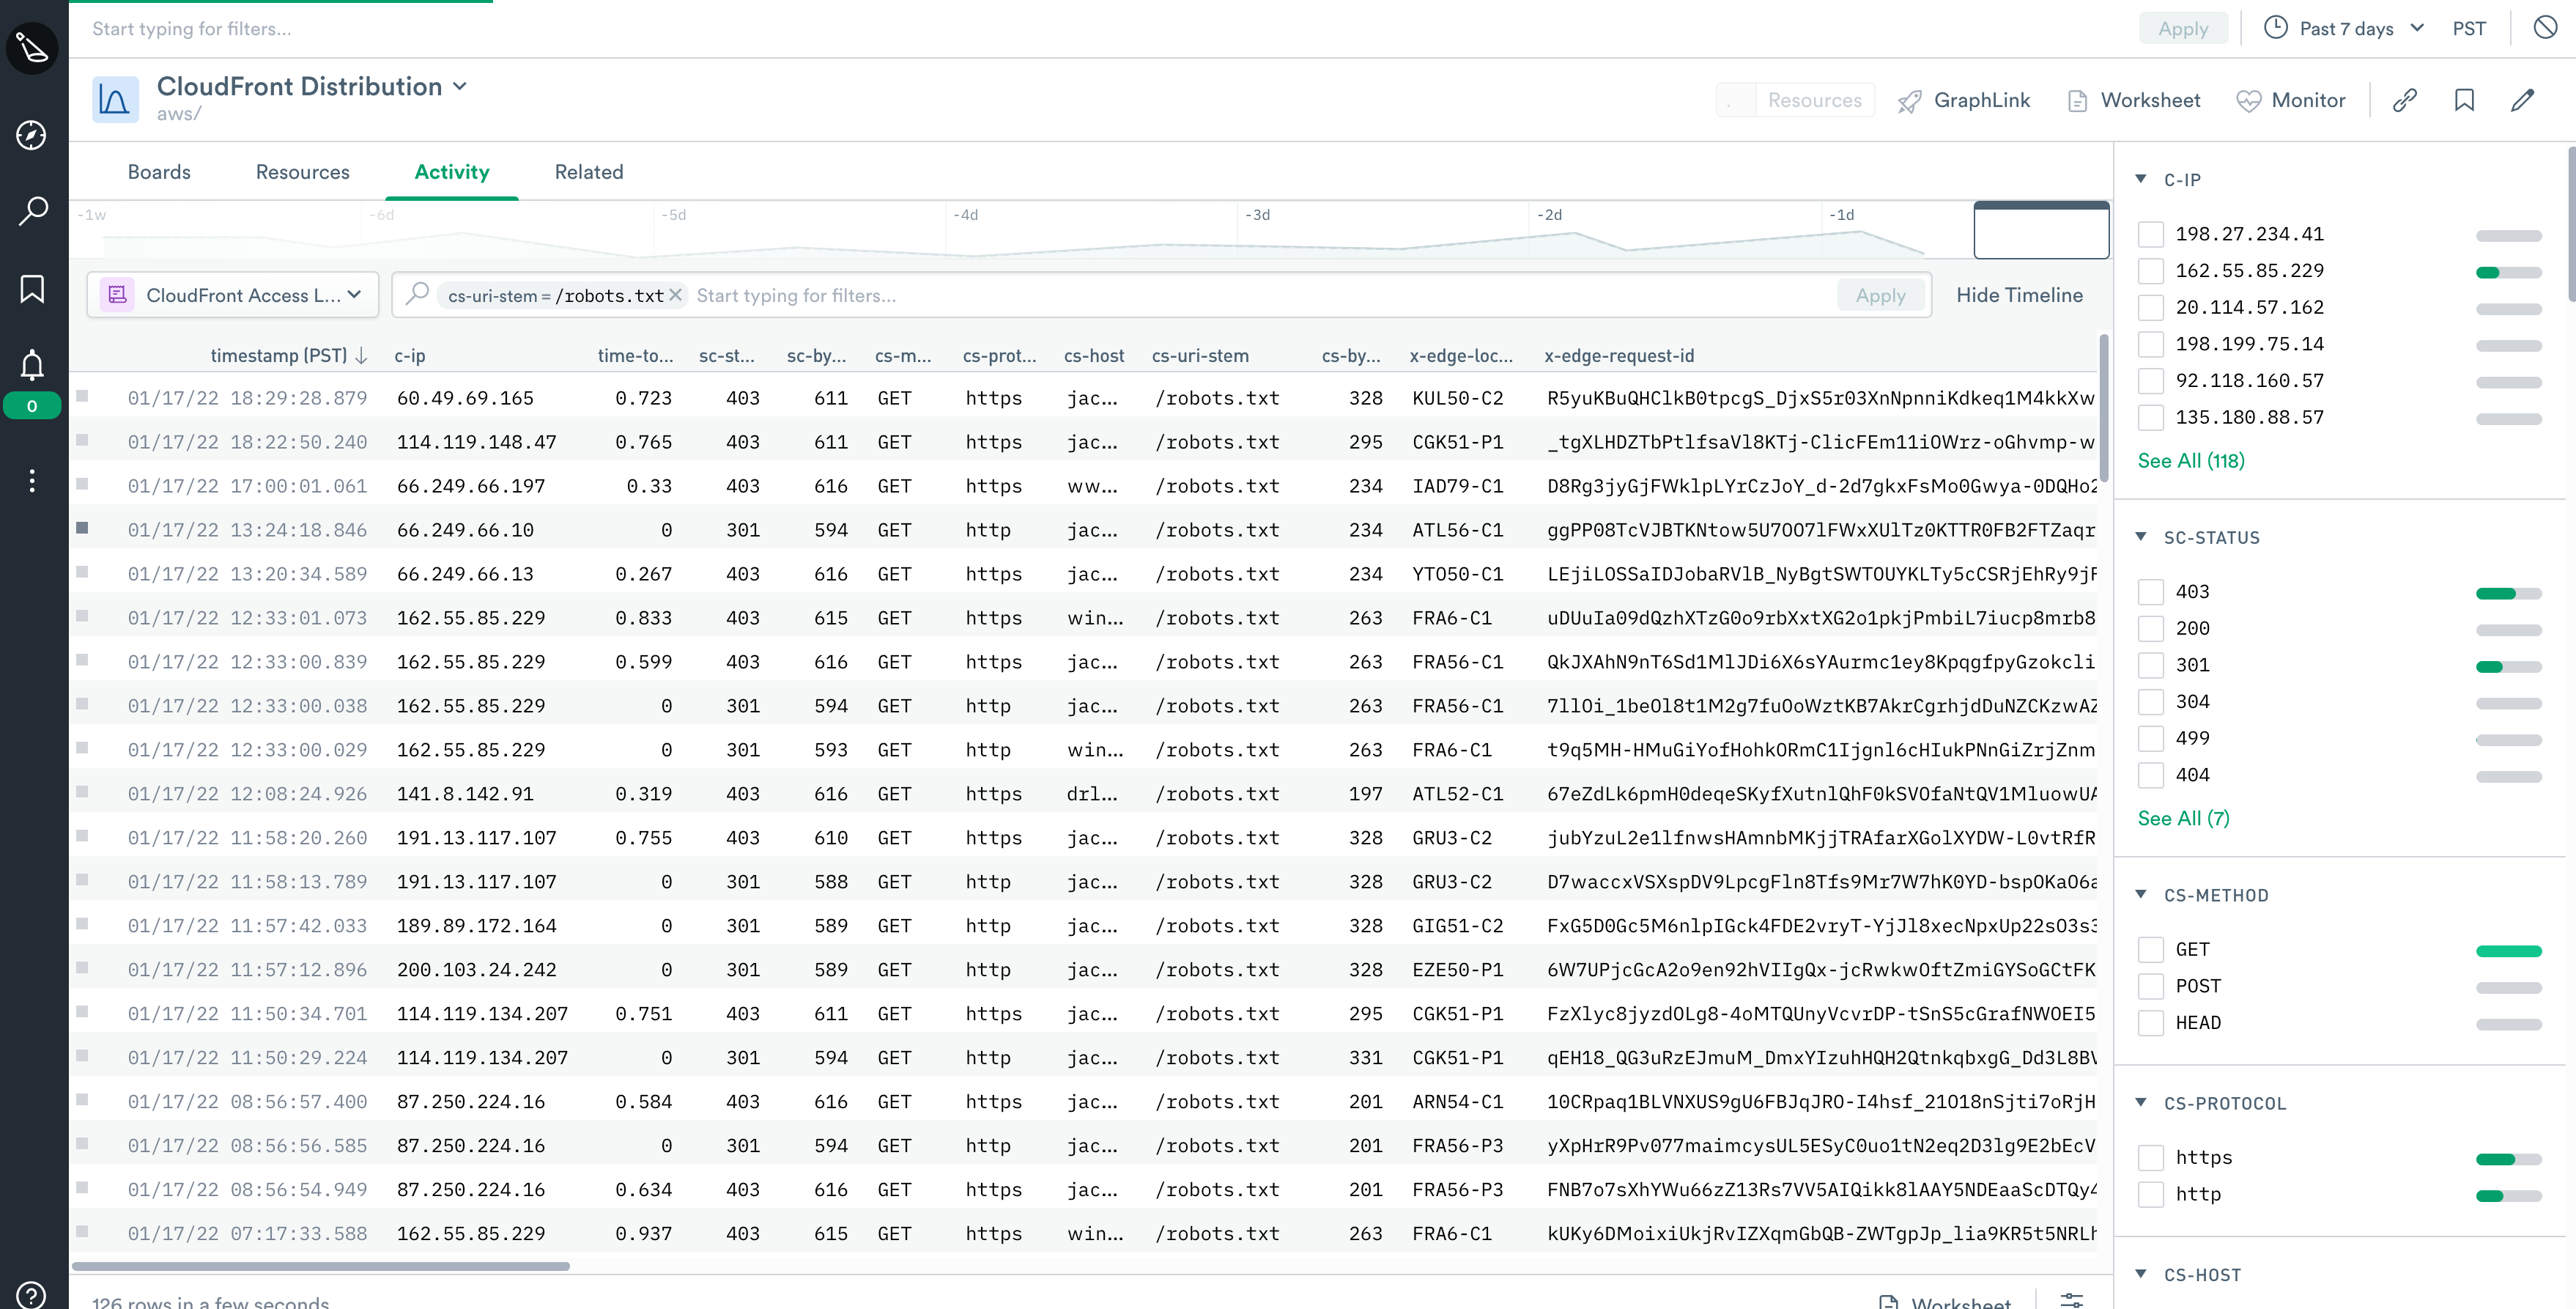
Figure 13 - CloudFront real-time access logs
Similarly, inspect configuration events related to your distributions by inspecting the CloudFront Distribution Events dataset.
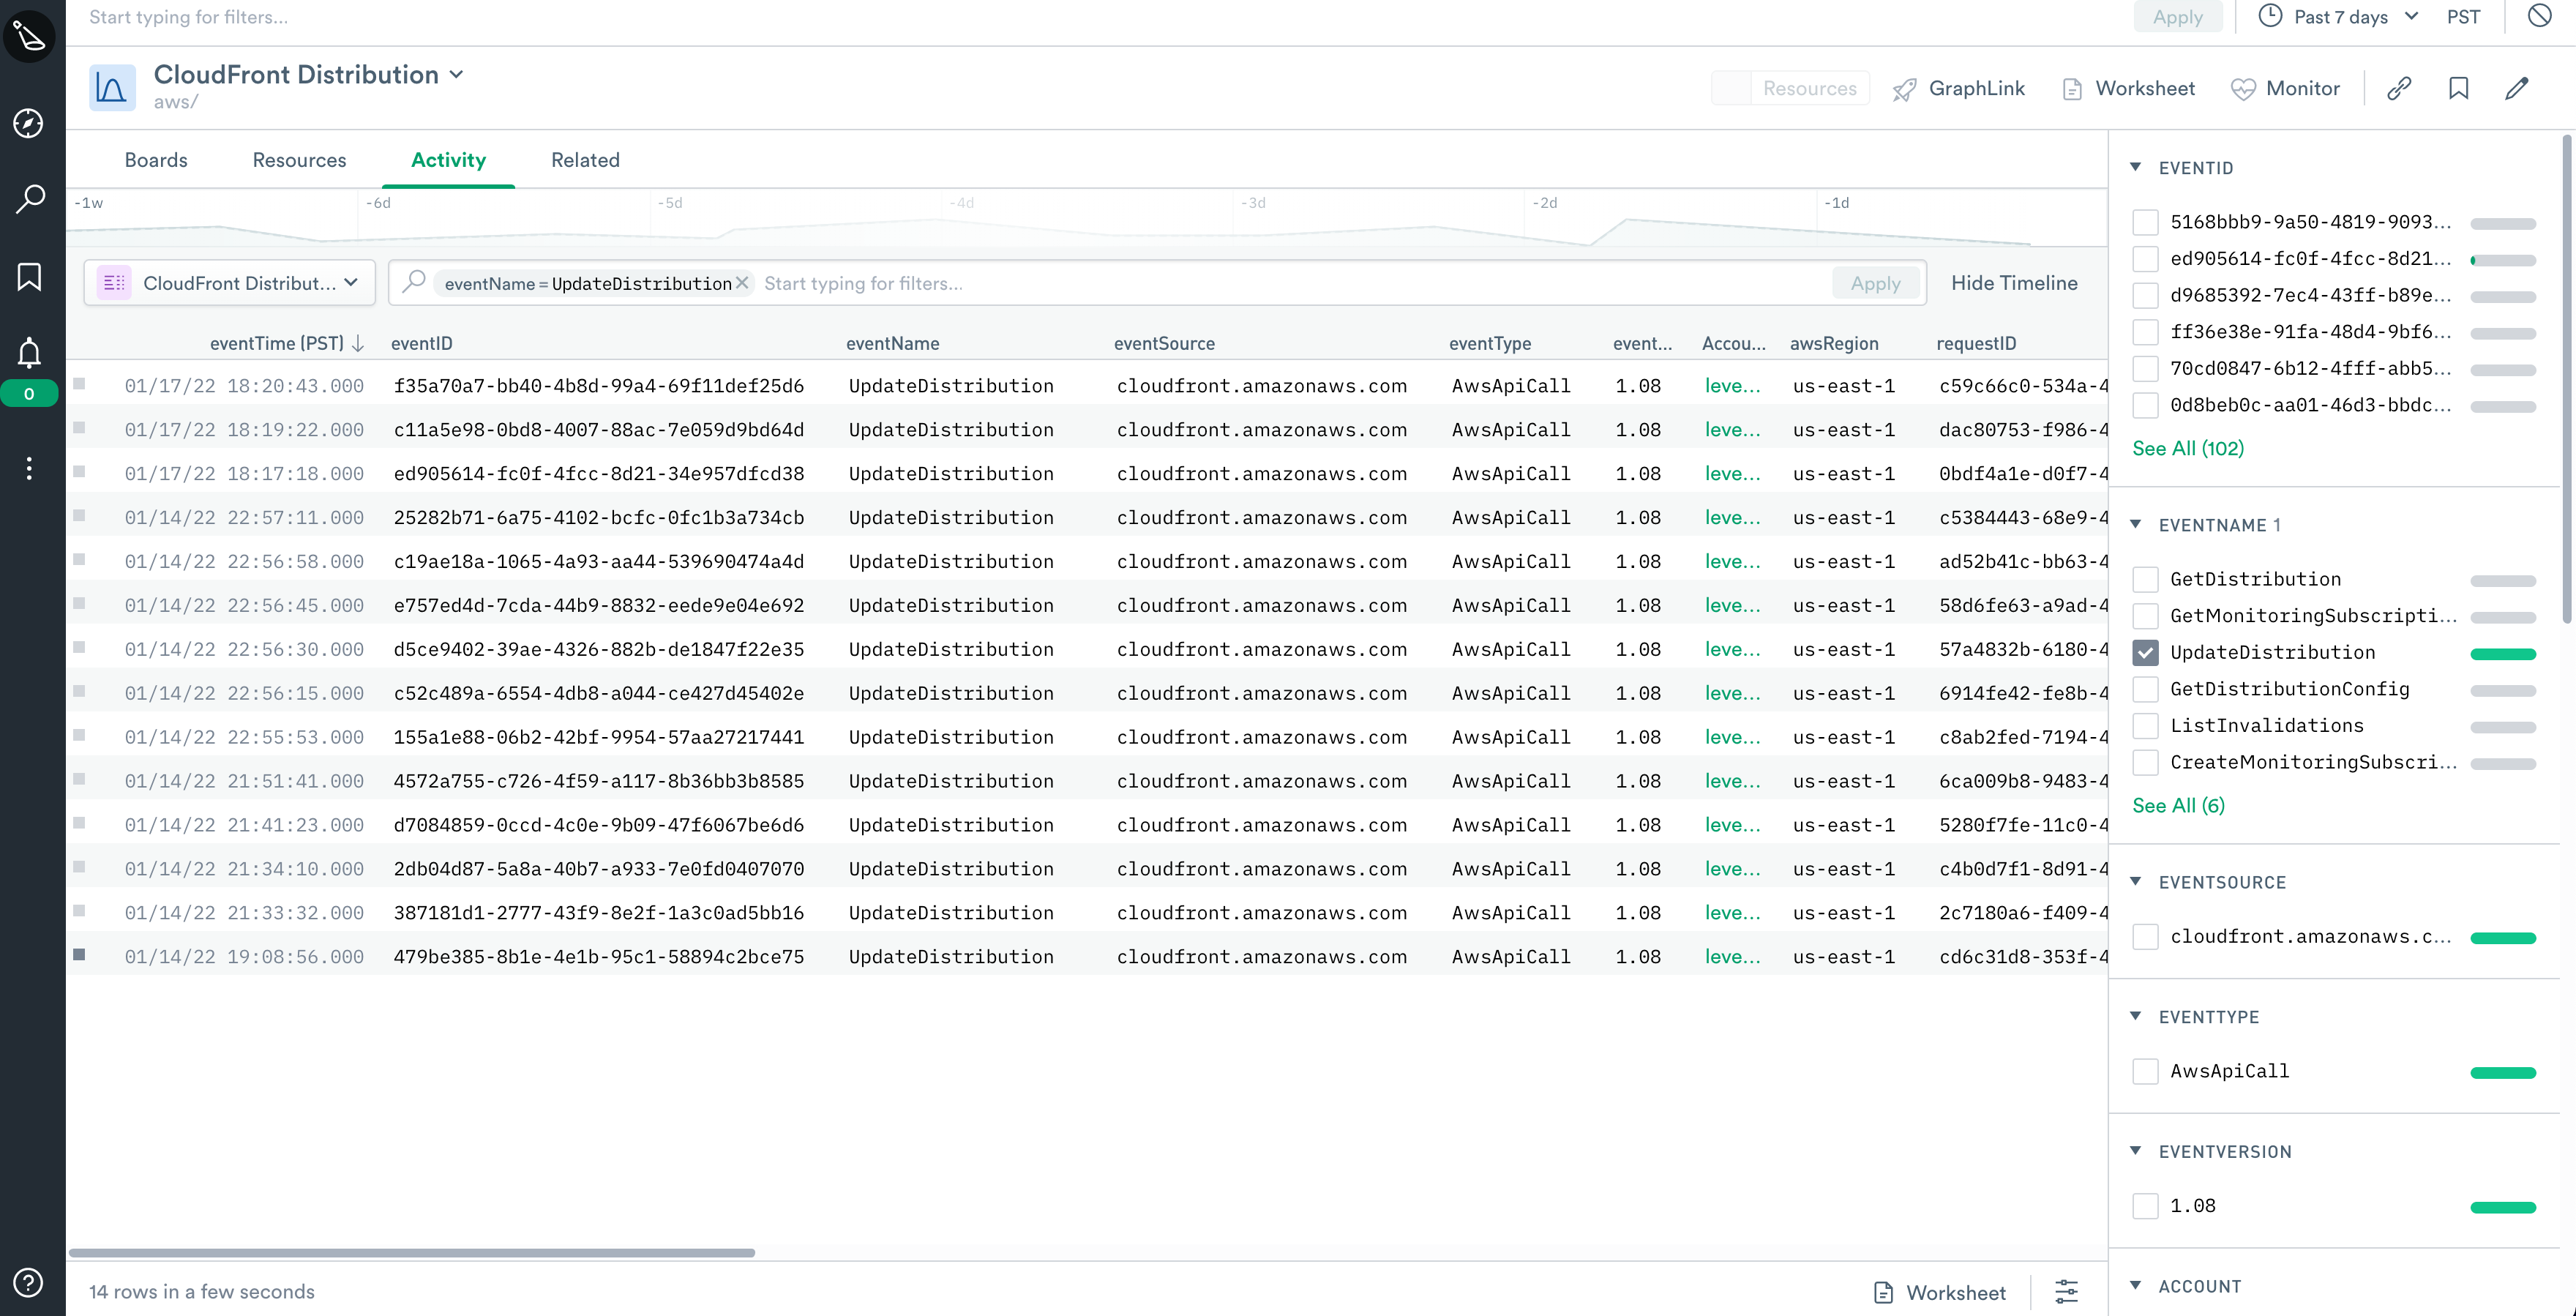
Figure 14 - CloudFront Distribution dataset
Observe provides sample Monitor templates “out-of-the-box”. To create a Monitor based on a template, go to the Monitors list page and click Templates.
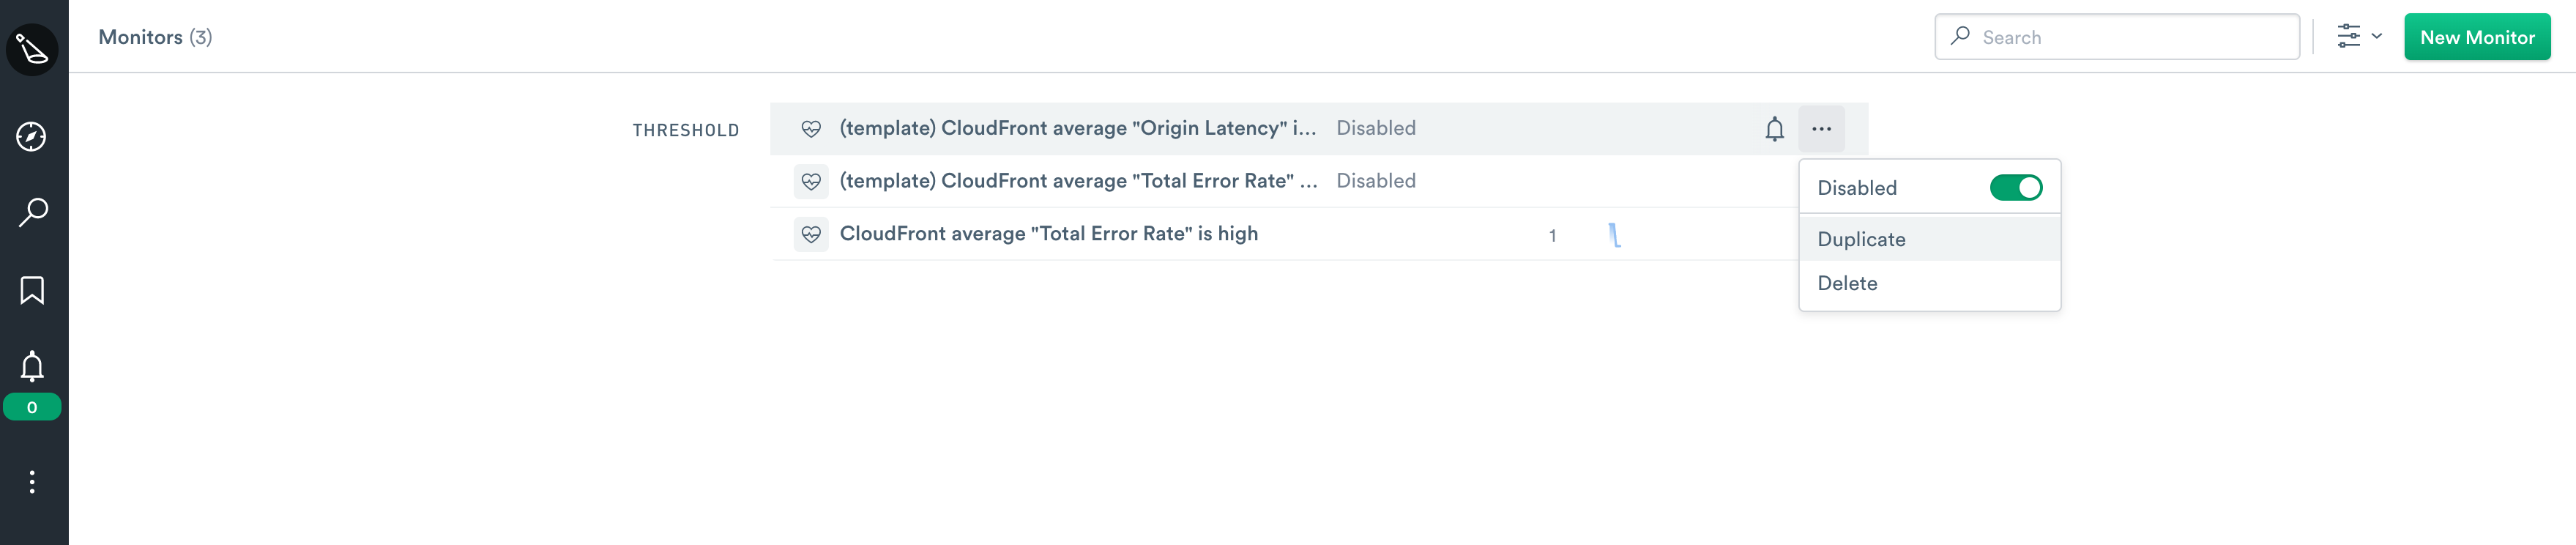
Figure 15 - List of Threshold Monitors in Observe