Installing the Host Monitoring App

The Host Monitoring Integration uses osquery, Fluent Bit, and Telegraf to send logs and metrics to Observe. For more about exploring this data, see Host Monitoring Integration.

Setup

You need the following items:

  • Your Observe Customer ID

  • An ingest token - for details on creating an ingest token for a datastream, see Data streams

  • One or more Linux or Windows hosts to monitor

The instructions below work with the following platforms:

  • Amazon Linux 2

  • Ubuntu 22.04 LTS, Ubuntu 20.04 LTS, Ubuntu 18.04 LTS

  • Centos 7+

  • Windows Server 2016+

NOTE: For Windows Server 2012 R2, please use the instructions to install manually in the Install the host monitoring agents section

Install the Observe Host Monitoring App

Install the Host Monitoring app located on the Apps page to set up host monitoring for your Linux or Windows hosts. The installation process configures the app, creates datasets, worksheets, and sample monitors, as well as prepares the app to accept data from your hosts.

Installing host monitoring using the Observe app

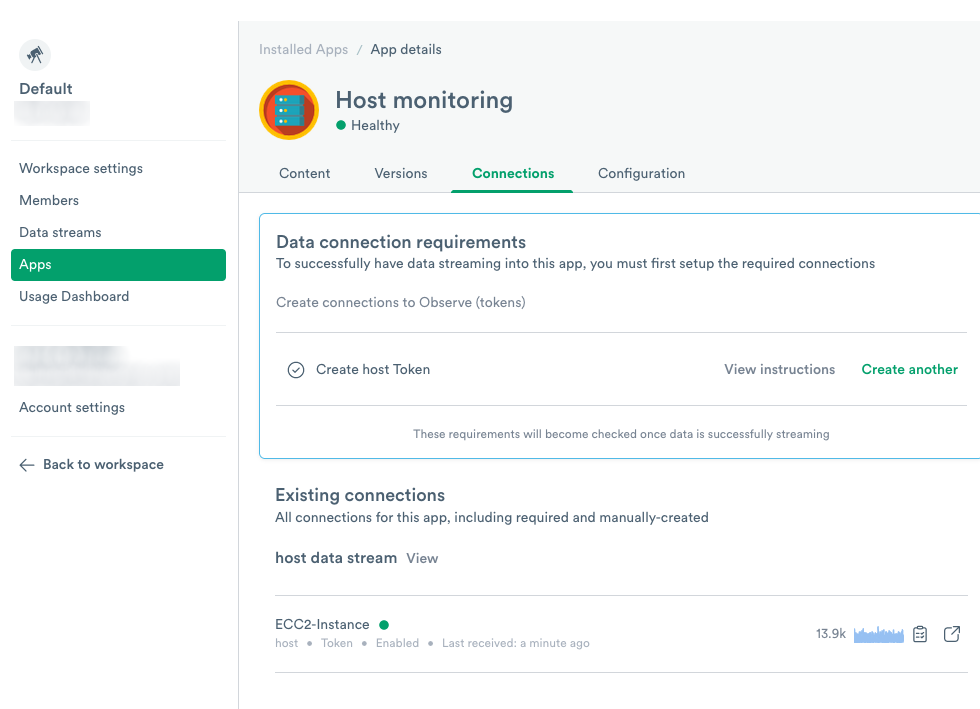
Figure 1 - The Host Monitoring App

When you click Create connection, you then create a token to use with the data stream. After you create the token, follow the instructions to install the agents on your hosts.

Creating a data stream token

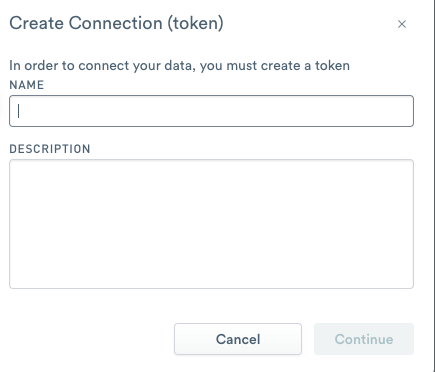
Figure 2 - Create a token for the data stream.

Install the host monitoring agents

To start sending data to Observe, install the agents on each host. You need your Observe customer ID and the data stream token you created in the previous step.

Linux

The following sample command installs osquery, Fluent Bit, and Telegraf for Linux. Replace YOUR_CUSTOMERID, YOUR_DATA_STREAM_TOKEN, MY_DATA_CENTER, and MY_APP_GROUP with appropriate values and run on each host. For full details, see Configuraton script for Linux.

curl "https://raw.githubusercontent.com/observeinc/linux-host-configuration-scripts/main/observe_configure_script.sh" | bash -s -- --customer_id YOUR_CUSTOMERID --ingest_token YOUR_DATA_STREAM_TOKEN --observe_host_name https://YOUR_CUSTOMERID.collect.observeinc.com/ --config_files_clean TRUE --ec2metadata TRUE --datacenter MY_DATA_CENTER --appgroup MY_APP_GROUP

Windows

The following sample command installs osquery, Fluent Bit, and Telegraf for Windows. Replace YOUR_CUSTOMERID and YOUR_DATA_STREAM_TOKEN with the appropriate values and run on each host. Optionally set the name of the Observe collection host by appending -observe_host_name OBSERVE_HOST_NAME. You may also set additional optional parameters, for full details, see Configuraton script for Windows.

[Net.ServicePointManager]::SecurityProtocol = "Tls, Tls11, Tls12, Ssl3"; Invoke-WebRequest -UseBasicParsing "https://raw.githubusercontent.com/observeinc/windows-host-configuration-scripts/main/agents.ps1" -outfile .\agents.ps1; .\agents.ps1  -ingest_token YOUR_DATA_STREAM_TOKEN -customer_id YOUR_CUSTOMERID

For details on installing and configuring osquery, Fluent Bit, and Telegraf individually, expand the section below, choose the desired package, and select the tab for your platform.

Individual package installation instructions
Osquery

Install the latest version of osquery on Amazon Linux 2 with the following command:

curl -L https://pkg.osquery.io/rpm/GPG | sudo tee /etc/pki/rpm-gpg/RPM-GPG-KEY-osquery
  sudo yum-config-manager --add-repo https://pkg.osquery.io/rpm/osquery-s3-rpm.repo
  sudo yum-config-manager --enable osquery-s3-rpm-repo
  sudo yum install osquery -y
  sudo service osqueryd start 2>/dev/null || true

Install the latest version of osquery on Ubuntu 20.04 with the following commands:

sudo apt-key adv --keyserver keyserver.ubuntu.com --recv-keys 1484120AC4E9F8A1A577AEEE97A80C63C9D8B80B
if ! grep -Fq https://pkg.osquery.io/deb /etc/apt/sources.list.d/osquery.list
then
  sudo tee -a /etc/apt/sources.list.d/osquery.list > /dev/null <<EOT
deb [arch=amd64] https://pkg.osquery.io/deb deb main
EOT
fi
sudo apt-get update
sudo apt-get install -y osquery
sudo service osqueryd start 2>/dev/null || true

Ubuntu on EC2 requires some additional configuration. For hosts running on AWS, add the following flags in /etc/osquery/osquery.flags:

--enable_syslog=true
--audit_allow_config=true
--audit_allow_sockets
--audit_persist=true
--disable_audit=false
--events_expiry=1
--events_Max=500000
--logger_min_status=1
--logger_plugin=filesystem
--watchdog_memory_limit=350
--watchdog_utilization_limit=130

To install the latest version of osquery on CentOS:

  1. Install the yum-utils package.

    yum install yum-utils
    
  2. Install the osquery repository:

    1. Fetch the signing key:

      curl -L https://pkg.osquery.io/rpm/GPG | tee /etc/pki/rpm-gpg/RPM-GPG-KEY-osquery
      
    2. Add the package repository:

      yum-config-manager --add-repo https://pkg.osquery.io/rpm/osquery-s3-rpm.repo
      
    3. Enable the package repository:

      yum-config-manager --enable osquery-s3-rpm-repo
      
  3. Install osquery:

    yum install osquery
    

    Respond yes when prompted to approve the package install and accept the signing key.

To install the latest version of osquery on Microsoft Windows:

  1. Download the latest MSI for Windows from the Osquery Downloads page

  2. Launch the MSI and follow the instructions on the screen.

Osquery configuration

Configure osquery using the following in /etc/osquery/osquery.conf

{
  "options": {
    "config_plugin": "filesystem",
    "logger_plugin": "filesystem",
    "database_path": "/var/osquery/osquery.db",
    "utc": "true"
  },

  "schedule": {
    "system_info": {
      "query": "SELECT hostname, cpu_brand, physical_memory FROM system_info;",
      "snapshot": true,
      "interval": 60
    },
    "mounts_snapshot": {
      "query": "SELECT device, device_alias, path, type, blocks, blocks_size, flags FROM mounts where path not like '/var/lib/%' and path not like '/run/docker/%' and path not like '/snap/%';",
      "snapshot": true,
      "interval": 60
    },
    "interfaces_snapshot": {
      "query": "SELECT interface, mac, type, mtu, metric, flags, link_speed FROM interface_details;",
      "snapshot": true,
      "interval": 60
    },
    "system_uptime": {
      "query": "SELECT * FROM uptime;",
      "snapshot": true,
      "interval": 300
    },
    "logged_in_users_snapshot": {
      "query": "SELECT type, user, tty, host, time, pid FROM logged_in_users;",
      "snapshot": true,
      "interval": 60
    },
    "shell_history": {
      "query": "SELECT * FROM users join shell_history using (uid);",
      "interval": 10
    },
    "logged_in_users": {
      "query": "SELECT type, user, tty, host, time, pid FROM logged_in_users;",
      "interval": 10
    },
    "logged_in_users_snapshot": {
      "query": "SELECT type, user, tty, host, time, pid FROM logged_in_users;",
      "snapshot": true,
      "interval": 300
    },
    "users_snapshot": {
      "query": "SELECT uid, gid, uid_signed, gid_signed, username, description, directory, shell, uuid FROM users;",
      "snapshot": true,
      "interval": 60
    }
  },
  "decorators": {
    "load": [
      "SELECT uuid AS host_uuid FROM system_info;",
      "SELECT user AS username FROM logged_in_users ORDER BY time DESC LIMIT 1;"
    ]
  },
  "packs": {
  }
}

Configure osquery by creating the following configuration in C:\Program Files\osquery\osquery.conf. (If you have installed osquery in a non-default location, create this file in your installation directory.)

{
  "options": {
    "utc": "true"
  },

  "schedule": {
    "system_info": {
      "query": "SELECT hostname, cpu_brand, physical_memory FROM system_info;",
      "snapshot": true,
      "interval": 60
    },
    "logcial_drives_snapshot": {
      "query": "SELECT boot_partition, description, device_id, file_system, size, type FROM logical_drives;",
      "snapshot": true,
      "interval": 60
    },
    "interfaces_snapshot": {
      "query": "SELECT interface, mac, type, mtu, metric, flags, speed, connection_id FROM interface_details;",
      "snapshot": true,
      "interval": 60
    },
    "system_uptime": {
      "query": "SELECT * FROM uptime;",
      "snapshot": true,
      "interval": 300
    },
    "logged_in_users_snapshot": {
      "query": "SELECT type, user, tty, host, time, pid FROM logged_in_users;",
      "snapshot": true,
      "interval": 60
    },
    "users_snapshot": {
      "query": "SELECT uid, gid, uid_signed, gid_signed, username, description, directory, shell, uuid FROM users;",
      "snapshot": true,
      "interval": 60
    },
    "os_snapshot" : {
      "query": "SELECT * FROM os_version;", 
      "snapshot": true,
      "interval": 60
    }
  },
  "decorators": {
    "load": [
      "SELECT uuid AS host_uuid FROM system_info;",
      "SELECT user AS username FROM logged_in_users ORDER BY time DESC LIMIT 1;"
    ]
  },
  "packs": {
  }
}

Once the config is written, open a PowerShell window and run the following command to restart the osquery service

Restart-Service osqueryd

To enable log rotation for osquery logs, add the following configuration in C:\Program Files\osquery\osquery.flags. The example below creates up to 3 250MB log files. Adjust as necessary for your environment.

--logger_rotate=true
--logger_rotate_size=262144000
--logger_rotate_max_files=3

Restart the service to apply your configuration changes in PowerShell:

Restart-Service osqueryd
Fluent Bit

Install the latest version of Fluent Bit on Amazon Linux 2 with the following commands:

sudo tee /etc/yum.repos.d/td-agent-bit.repo > /dev/null <<EOT
[td-agent-bit]
name = TD Agent Bit
baseurl = https://packages.fluentbit.io/amazonlinux/2/\$basearch/
gpgcheck=1
gpgkey=https://packages.fluentbit.io/fluentbit.key
enabled=1
EOT
sudo yum install td-agent-bit -y

Install the latest version of Fluent Bit on Ubuntu 20.04 with the following commands:

wget -qO - https://packages.fluentbit.io/fluentbit.key | sudo apt-key add -

Next, update your sources list: add the following line at the bottom of your /etc/apt/sources.list file:

deb https://packages.fluentbit.io/ubuntu/focal focal main
```Finally, refresh your packages and install fluentbit.
```text
sudo apt-get update
sudo apt-get install -y td-agent-bit

Note

For CentOS 7, please see the FAQ section for more about TLS certificates.

To install the latest version of Fluent Bit on CentOS:

  1. Add the td-agent-bit repository reference:

    Create a new file, td-agent-bit.repo in /etc/yum.repos.d containing the following:

    [td-agent-bit]
    name = TD Agent Bit
    baseurl = https://packages.fluentbit.io/centos/7/$basearch/
    gpgcheck=1
    gpgkey=https://packages.fluentbit.io/fluentbit.key
    enabled=1
    
  2. Install td-agent-bit:

    yum install td-agent-bit
    
  3. Start the td-agent-bit service:

    sudo service td-agent-bit start
    

Install the latest version of Fluent Bit on Windows by:

  1. Download the latest intaller EXE from the Fluent Bit Downloads Page.

  2. Double-click the installer and follow the instructions on the installation wizard.

Fluent Bit configuration

Configure Fluent Bit using the following in /etc/td-agent-bit/td-agent-bit.conf, replacing MY_CUSTOMER_ID and MY_INGEST_TOKEN with your ID and token.

Important

If you are running on AWS EC2, uncomment the AWS metatags [FILTER] block. This enables links back to your EC2 instance.

[SERVICE]
    flush        10
    daemon       Off
    log_level    info
    parsers_file parsers.conf
    parsers_file input-parsers.conf
    plugins_file plugins.conf
    http_server  Off
    http_listen  0.0.0.0
    http_port    2020
    storage.metrics on
# Uncomment the below section if using AWS EC2
#[FILTER]
#    Name aws
#    Match *
#    imds_version v1
#    az true
#    ec2_instance_id true
#    ec2_instance_type true
#    account_id true
#    hostname true
#    vpc_id true
[FILTER]
    Name record_modifier
    Match *
# if you want to group your servers into an application group
# [e.g. Proxy nodes] so you have have custom alert levels for them
# uncomment this next line
#    Record appgroup ha-proxy
    Record host ${HOSTNAME}
    Record datacenter aws
    Remove_key _MACHINE_ID
[INPUT]
    name systemd
    tag  systemd
    Read_From_Tail on
[OUTPUT]
    name        http
    match       systemd*
    host        MY_CUSTOMER_ID.collect.observeinc.com
    port        443
    URI         /v1/http/fluentbit/systemd
    Format      msgpack
    Header      X-Observe-Decoder fluent
    Compress    gzip
    http_Passwd MY_INGEST_TOKEN
    tls         on
[INPUT]
    name tail
    tag  tail_osquery_results
    Path_Key path
    path /var/log/osquery/osqueryd.results.log
    Read_from_Head False
    db      osquery-results.db
[INPUT]
    name tail
    tag  tail_osquery_snapshots
    Path_Key path
    path /var/log/osquery/osqueryd.snapshots.log
    Read_from_Head False
    db      osquery-snapshots.db
[OUTPUT]
    name        http
    match       tail*
    host        MY_CUSTOMER_ID.collect.observeinc.com
    port        443
    URI         /v1/http/fluentbit/tail
    Format      msgpack
    Header      X-Observe-Decoder fluent
    Compress    gzip
    http_Passwd MY_INGEST_TOKEN
    tls         on

Restart the service to apply the new configuration:

sudo service td-agent-bit restart

The following assumes that Fluent Bit is installed in the default location of C:\Program Files\fluent-bit.

Configure Fluent Bit using the following in C:\Program Files\fluent-bit\fluent-bit.conf, replacing MY_CUSTOMER_ID and MY_INGEST_TOKEN with your ID and token.

[SERVICE]
    flush        5
    daemon       Off
    log_level    debug  
    log_file    C:\Program Files\fluent-bit\fluent.log
[INPUT]
    Name         winlog
    Channels     Security,Application,System
    Interval_Sec 5
    DB           C:\Program Files\fluent-bit\fluent.pos
# Uncomment the below section if using AWS EC2
#[FILTER]
#    Name aws
#    Match *
#    imds_version v1
#    az true
#    ec2_instance_id true
#    ec2_instance_type true
#    account_id true
#    hostname true
#    vpc_id true
[FILTER]
    Name record_modifier
    Match *
# if you want to group your servers into an application group
# [e.g. Proxy nodes] so you have have custom alert levels for them
# uncomment this next line
#    Record appgroup ha-proxy
    Record host ${HOSTNAME}
    Record datacenter aws
    Remove_key _MACHINE_ID

[INPUT]
    name tail
    tag  tail_osquery_results
    Path_Key path
    path C:\Program Files\osquery\log\osqueryd.results.log
    Read_from_Head False
    db      osquery-results.db
[INPUT]
    name tail
    tag  tail_osquery_snapshots
    Path_Key path
    path C:\Program Files\osquery\log\osqueryd.snapshots.log
    Read_from_Head False
    db      osquery-snapshots.db
[OUTPUT]
    name        http
    match       *
    host        MY_CUSTOMER_ID.collect.observeinc.com
    port        443
    URI         /v1/http/fluentbit/tail
    Format      msgpack
    Header      X-Observe-Decoder fluent
    Compress    gzip
    http_Passwd MY_INGEST_TOKEN
    tls         on

Next, create a service with the following command in a PowerShell window:

New-Service fluent-bit -BinaryPathName "C:\Program Files\fluent-bit\bin\fluent-bit.exe" -c "C:\Program Files\fluent-bit\conf\fluent-bit.conf" -StartupType Automatic
Start-Service fluent-bit
Telegraf

Install the latest version of Telegraf on Amazon Linux 2 with the following commands:

sudo tee /etc/yum.repos.d/influxdb.repo > /dev/null <<EOT
[influxdb]
name = InfluxDB Repository - RHEL
baseurl = https://repos.influxdata.com/rhel/7/x86_64/stable/
enabled = 1
gpgcheck = 1
gpgkey = https://repos.influxdata.com/influxdb.key
EOT
sudo yum install telegraf -y

Install the latest version of Telegraf on Ubuntu 20.04 with the following commands:

wget -qO- https://repos.influxdata.com/influxdb.key | sudo apt-key add -
source /etc/lsb-release
if ! grep -Fq https://repos.influxdata.com/${DISTRIB_ID,,} /etc/apt/sources.list.d/influxdb.list
then
  sudo tee -a /etc/apt/sources.list.d/influxdb.list > /dev/null <<EOT
  deb https://repos.influxdata.com/${DISTRIB_ID,,} ${DISTRIB_CODENAME} stable
EOT
fi
sudo apt-get update
sudo apt-get install -y telegraf

Install the latest version of Telegraf on CentOS with the following commands:

cat <<EOF | sudo tee /etc/yum.repos.d/influxdb.repo
[influxdb]
name = InfluxDB Repository - RHEL \$releasever
baseurl = https://repos.influxdata.com/rhel/\$releasever/\$basearch/stable
enabled = 1
gpgcheck = 1
gpgkey = https://repos.influxdata.com/influxdb.key
EOF
sudo yum install telegraf

Then start the service:

sudo service telegraf start

Install the latest version of Telegraf by:

  1. Download the latest version of Telegraf from the InfluxData Downloads page.

  2. Extract the contents of the ZIP archive to `C:\Program Files\InfluxData\Telegraf

Telegraf Configuration

Configure Telegraf using the following in /etc/telegraf/telegraf.conf, replacing MY_CUSTOMER_ID and MY_INGEST_TOKEN with your ID and token. Also change datacenter and host to your desired values in [global_tags].

Important

If you are running on AWS EC2, uncomment the AWS metatags in the [[processors.aws_ec2]] block. This enables links back to your EC2 instance.

[global_tags]
  # update datacenter names to match Fluent Bit config
  datacenter = "aws"
[agent]
  interval = "10s"
  round_interval = true
  metric_batch_size = 1000
  metric_buffer_limit = 10000
  collection_jitter = "0s"
  flush_interval = "10s"
  flush_jitter = "0s"
  precision = ""
  omit_hostname = false
[[outputs.http]]
  url = "https://MY_CUSTOMER_ID.collect.observeinc.com:443/v1/http/telegraf"
  timeout = "5s"
  method = "POST"
  username = "MY_CUSTOMER_ID"
  password = "MY_INGEST_TOKEN"
  insecure_skip_verify = true
  data_format = "json"
  content_encoding = "gzip"
  [outputs.http.headers]
    Content-Type = "application/json"
    X-Observe-Decoder = "nested"
[[inputs.cpu]]
  percpu = true
  totalcpu = false
  collect_cpu_time = false
  report_active = false
[[inputs.disk]]
  ignore_fs = ["tmpfs", "devtmpfs", "devfs", "iso9660", "overlay", "aufs", "squashfs","tracefs"]
[[inputs.diskio]]
  # no configuration
[[inputs.net]]
  # no configuration
[[inputs.kernel]]
  # no configuration
[[inputs.mem]]
  # no configuration
[[inputs.processes]]
  # no configuration
[[inputs.swap]]
  # no configuration
[[inputs.system]]
  # no configuration
[[inputs.system]]
  # no configuration
[[inputs.linux_sysctl_fs]]
  # no configuration
#[[inputs.ntpq]]
#  dns_lookup = true
[[inputs.procstat]]
  exe = "."
  prefix = "pgrep_serviceprocess"
  interval = "60s"
  period = "60s"
# Uncomment below metatags if using AWS EC2
#[[processors.aws_ec2]]
#  imds_tags = [ "accountId", "instanceId"]
#  timeout = "10s"
#  max_parallel_calls = 10

Restart the service with

sudo service telegraf restart

To use Network Time Protocol (ntpq) to get the hostname via DNS lookup:

  1. Install ntp

    • Ubuntu

      sudo apt-get install ntp
      
    • CentOS

      yum install ntp
      
  2. Uncomment the following at the bottom of telegraf.conf:

    [[inputs.ntpq]]
      dns_lookup = true
    

Configure Telegraf using the following in C:\Program Files\InfluxData\telegraf\telegraf.conf, replacing MY_CUSTOMER_ID and MY_INGEST_TOKEN with your ID and token. Also change datacenter and host to your desired values in [global_tags].

Important

If you are running on AWS EC2, uncomment the AWS metatags in the [[processors.aws_ec2]] block. This enables links back to your EC2 instance.

[global_tags]
  # update datacenter names to match Fluent Bit config
  datacenter = "aws"
[agent]
  interval = "10s"
  round_interval = true
  metric_batch_size = 1000
  metric_buffer_limit = 10000
  collection_jitter = "0s"
  flush_interval = "10s"
  flush_jitter = "0s"
  precision = ""
  omit_hostname = false

# OUTPUT PLUGINS

[[outputs.http]]
  url = "https://<<observe_host_name>>:443/v1/http/telegraf"
  timeout = "5s"
  method = "POST"
  username = "<<customer_id>>"
  password = "<<ingest_token>>"
  insecure_skip_verify = true
  data_format = "json"
  content_encoding = "gzip"
  [outputs.http.headers]
    Content-Type = "application/json"
    X-Observe-Decoder = "nested"

# INPUT PLUGINS 

[[inputs.cpu]]
  percpu = true
  totalcpu = false
  collect_cpu_time = false
  report_active = false
[[inputs.disk]]
  # no configuration
[[inputs.diskio]]
  # no configuration
[[inputs.net]]
  # no configuration
[[inputs.mem]]
  # no configuration
[[inputs.processes]]
  # no configuration
[[inputs.swap]]
  # no configuration
[[inputs.system]]
  # no configuration
[[inputs.system]]
  # no configuration
#[[inputs.ntpq]]
#  dns_lookup = true
[[inputs.win_perf_counters]]
UseWildcardsExpansion = true
  [[inputs.win_perf_counters.object]]
    ObjectName = "Process"
    Counters = ["% Processor Time","Handle Count","Private Bytes","Thread Count","Virtual Bytes","Working Set","ID Process"]
    #Counters = ["*"]
    Instances = ["*"]
    Measurement = "win_proc"
    #IncludeTotal=false #Set to true to include _Total instance when querying for all (*).
[[inputs.win_services]]
  # no configurations
# Uncomment below metatags if using AWS EC2
#[[processors.aws_ec2]]
#  imds_tags = [ "accountId", "instanceId"]
#  timeout = "10s"
#  max_parallel_calls = 10

Create the service by opening up a command prompt and entering the following:

cd "C:\Program Files\InfluxData\telegraf\"
.\telegraf.exe --service install --config "C:\Program Files\InfluxData\telegraf\telegraf.conf"
.\telegraf.exe --service start

Note

A host must use the same hostname for both Fluent Bit and Telegraf. To manually set the hostname in telegraf.conf, specify it in [global_tags] instead of using NTP dns_lookup:

[global_tags]
  datacenter = "test-datacenter"
  # Set the hostname manually
  host = "test-host"

Confirm sending data to Observe

To test that the forwarders send data to Observe, look for /telegraf and /fluentbit in the EXTRA field of the associated data stream:

Filter dialog open for the EXTRA column, with "/telegraf", "/fluentbit/systemd", and "/fluentbit/tail" selected.

You can also check the status of the services on your hosts:

sudo service telegraf status
sudo service osqueryd status
sudo service td-agent-bit status

In a PowerShell window, run the following commands:

Get-Service telegraf
Get-Service osquerd
Get-Service fluent-bit

Next Steps

The Host Integration works with the datasets in your workspace. Contact us for assistance creating datasets and modeling additional relationships between them. We can automate many common data modeling tasks for you, ensuring an accurate picture of your infrastructure. We can also update your workspace with improved and new datasets, troubleshooting boards, and out-of-the-box monitors as we release new functionality for this integration.

FAQ

CentOS 7 certificates

If you use CentOS 7 and cannot update the default (expired) Root CA X3 certificate, you may see an error from Fluent Bit.

While we don’t recommend disabling TLS, if you need to temporarily do so you can add the following at the bottom of both [OUTPUT] stanzas in your td-agent-bit.conf:

# Turn transport layer security off - use common sense and make sure you don't send sensitive log content
tls.verify  off

Adding a custom log file or entire directory

If you want to monitor a custom log file and forward log entries to Observe as they are added to the file, add the following section to your /etc/td-agent-bit/td-agent-bit.conf:

[INPUT]
    name tail
    # specify a logfile tag
    tag  tail_myfile
    Path_Key path
    # specify the correct path or directory structure
    #path /var/log/containers/*.log
    path /var/log/myfile.log
    Read_from_Head False
    #provide a unique fluentbit checkpoint name
    db      myfilelog.db
[OUTPUT]
    name        http
    match       tail*
    host        MY_CUSTOMER_ID.collect.observeinc.com
    port        443
    URI         /v1/http/fluentbit/tailmylog
    Format      msgpack
    Header      X-Observe-Decoder fluent
    Compress    gzip
    http_Passwd MY_INGEST_TOKEN
    tls         on

Restart the service to apply the new configuration:

sudo service td-agent-bit restart

Sending data through a proxy

If your Linux hosts cannot directly communicate with Observe endpoints, add a proxy configuration for systemd. The following example is for AWS Linux hosts:

For Fluent Bit, modify /usr/lib/systemd/system/td-agent-bit.service to include the proxy settings similar to the example below:

[Unit]
Description=TD Agent Bit
Requires=network.target
After=network.target

[Service]
Type=simple
Environment="HTTP_PROXY=http://172.31.33.33:3128/"
Environment="HTTPS_PROXY=http://172.31.33.33:3128/" 
ExecStart=/opt/td-agent-bit/bin/td-agent-bit -c /etc/td-agent-bit/td-agent-bit.conf
Restart=always

[Install]
WantedBy=multi-user.target

For Telegraf, modify /etc/systemd/system/multi-user.target.wants/telegraf.service:

[Unit]
Description=The plugin-driven server agent for reporting metrics into InfluxDB
Documentation=https://github.com/influxdata/telegraf
After=network.target

[Service]
EnvironmentFile=-/etc/default/telegraf
User=telegraf
Environment="HTTP_PROXY=http://172.31.33.33:3128/"
Environment="HTTPS_PROXY=http://172.31.33.33:3128/" 
ExecStart=/usr/bin/telegraf -config /etc/telegraf/telegraf.conf -config-directory /etc/telegraf/telegraf.d $TELEGRAF_OPTS
ExecReload=/bin/kill -HUP $MAINPID
Restart=on-failure
RestartForceExitStatus=SIGPIPE
KillMode=control-group

[Install]
WantedBy=multi-user.target