Get started with Observe
Overview
As a Site Reliability Engineer (SRE) for your online retail company, Astronomy Shop, you ensure site uptime and accessibility for your customers. The Astronomy Shop services are running in Kubernetes, and have been instrumented with OpenTelemetry. You’ve been receiving problem reports from customers indicating that the new and important “You May Also Like” feature may be broken. As no alerts have fired yet, you will want to do some initial triage of the issue via Observe.
What is in this data?
For this tutorial, you will be using Datasets bundled with the Demo data app. These datasets receive logs, metrics and traces from Astronomy shop services in real time. You can interact with the application by going to https://astronomy.sandbox.sockshop.biz/. After logging into Observe and locating the Demo data/Container Log Dataset in Logs Explorer, open it and perform a few simple operations to better assess the situation.
Note
This tutorial is based on data bundled with the Observe free trial, via the Demodata app. The Demodata app is a fork of Observe’s Kubernetes app, and is purely for educational purposes.
Let’s Get Started
Ad-hoc Log Investigation
Log into Observe and click Investigate > Logs.
Enter
Demodata/Containerin the Search bar.
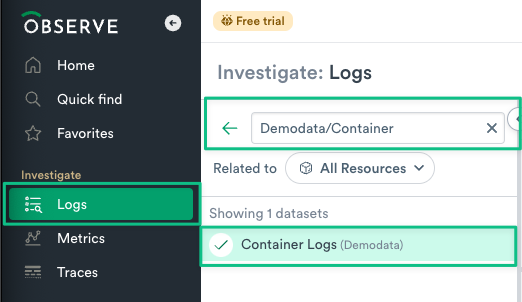
Figure 1 - Search for Container Logs Dataset
3. Click on the Container Logs Dataset to open it.
4. You should now see a list of Containers on the left side of Logs Explorer. Adjust the time range to Past 4 hours, and select recommendationservice from your list of containers. Note that the Query Builder bar is automatically updated to reflect your selection. This filters the logs down to just the recommendationservice Container, and provides logs from the last 4 hours. You can also filter on specific column values via the filter action in each column, try filtering down to just stderr in the stream column.
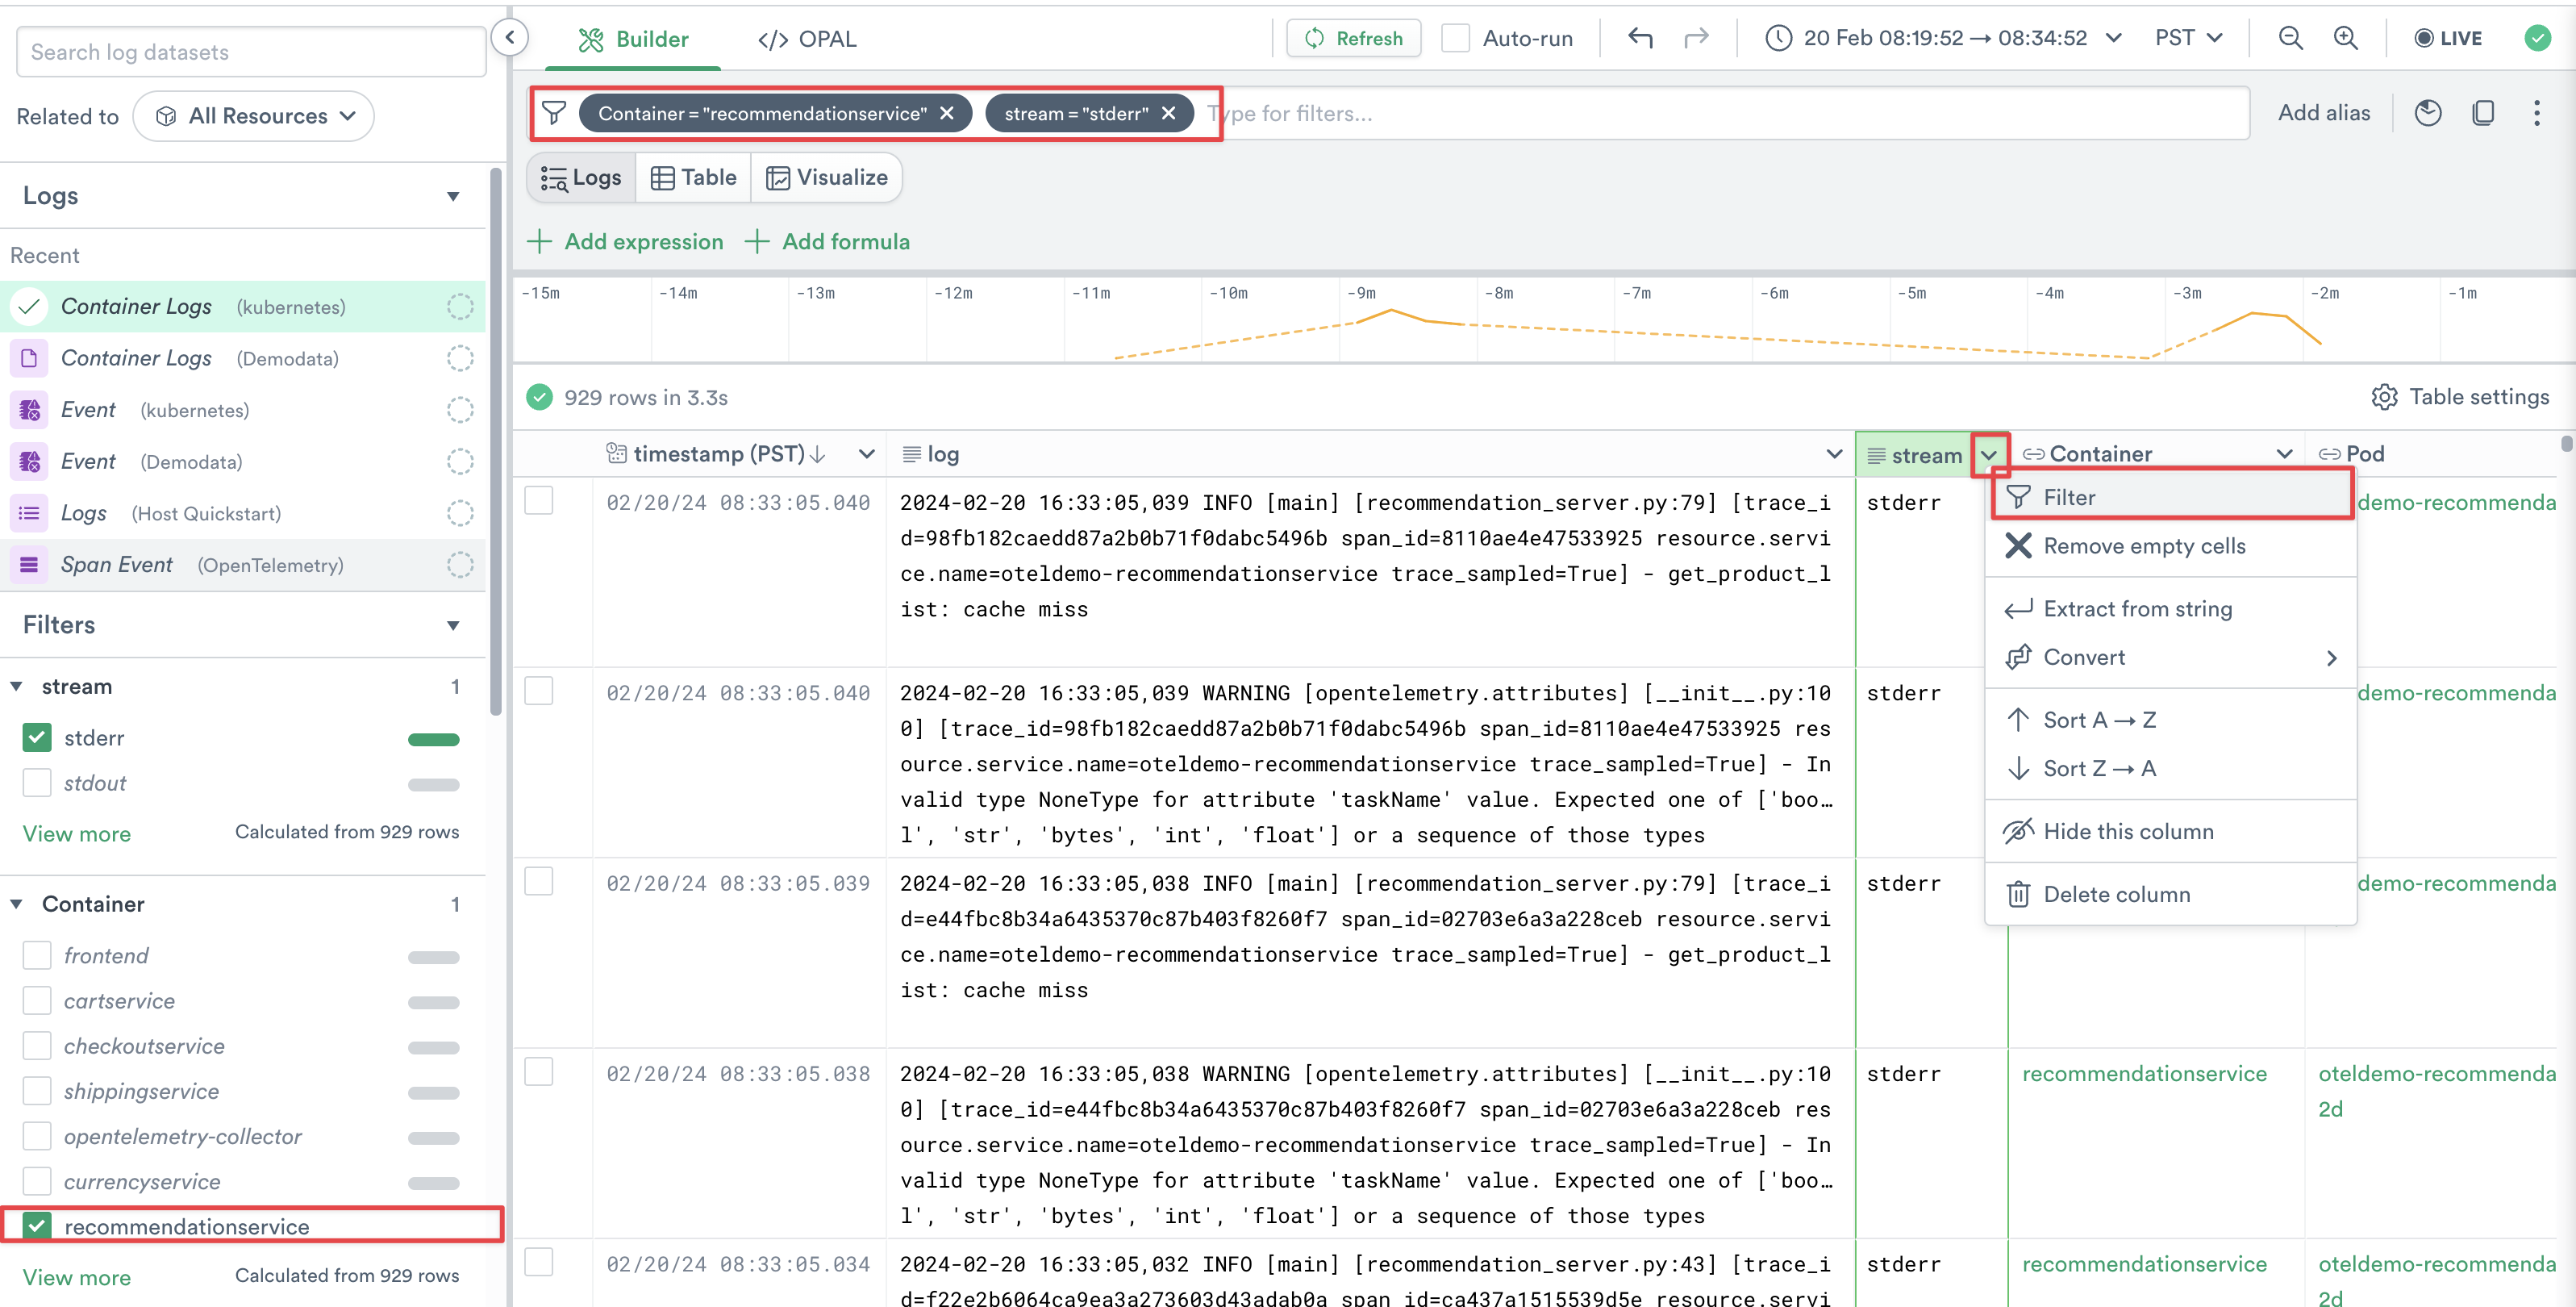
Figure 2 - Filter down to recommendationservice & expand time range
5. In the Query Builder bar type the term WARNING, and select the option Contains warning.
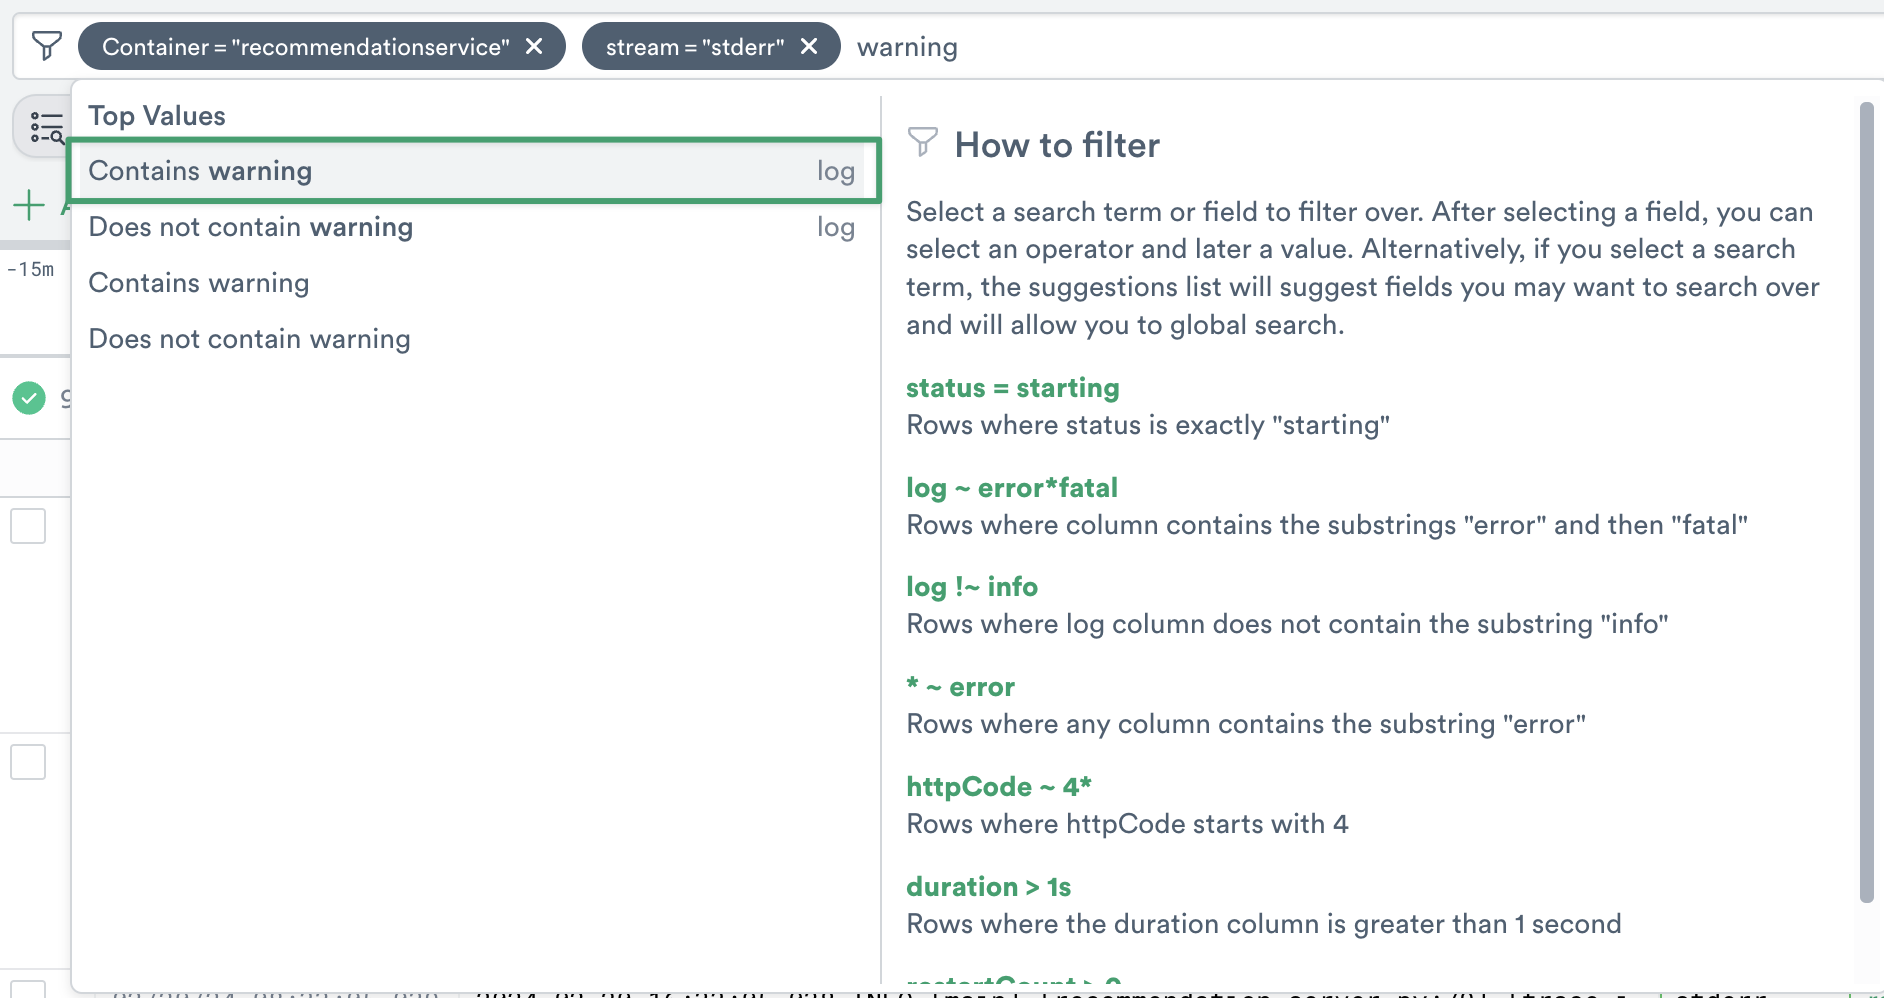
Figure 3 - Search for the term WARNING in container logs
Pivot to Metrics
1. Based on the initial set of logs, there’s no obvious root cause indicated. You will now use Observe’s pivot functionality by hovering over a table cell in the Container column, and clicking the green context menu (you can also double-click the cell) and selecting Inspect.
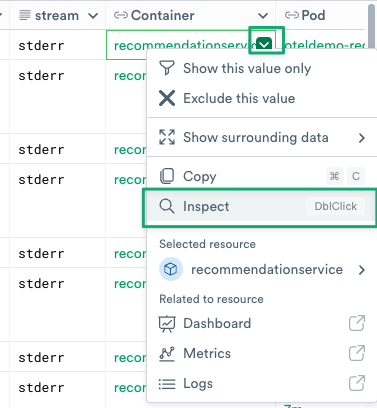
Figure 4 - Pivot into details about recommendationservice container
2. You should now see the Inspect Rail on the right side of the screen. Click the Metrics tab and type memory into the search box.
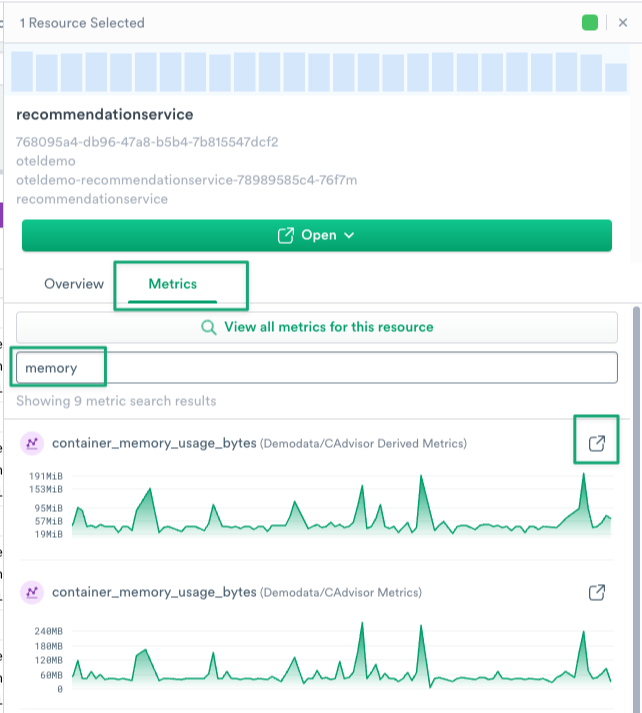
Figure 5 - Inspect metrics for recommendation service from Log Explorer
3. At a glance we can see that memory utilization for recommendationservice is spiking at regular intervals. To drill down further you can open a direct link to the Metrics Explorer by clicking the open in new tab icon next to any metric name.
4. In your new tab, you will see Metrics Explorer, with the proper metric selected, filtered to your recommendationservice container, and using the same time range that was used for your Log Explorer query.
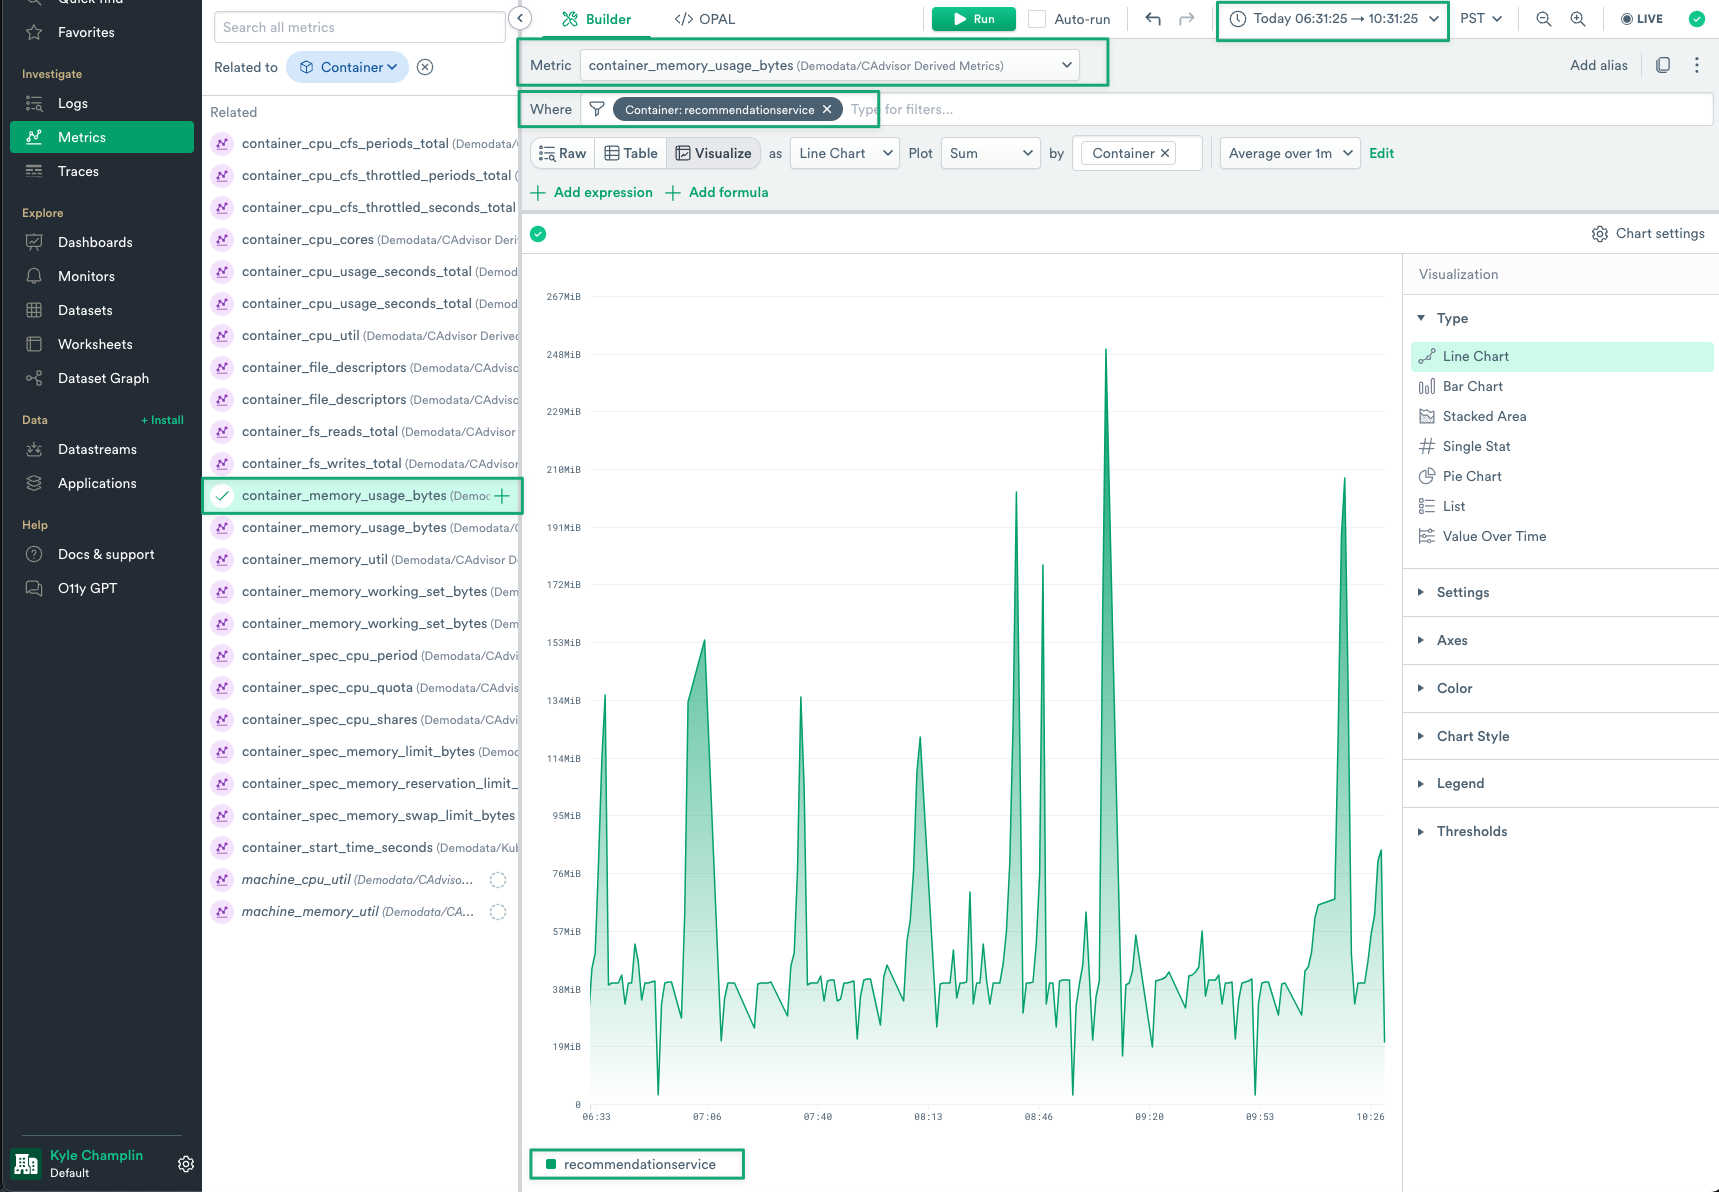
Figure 6 - Metrics Explorer Drill Down
Create a dashboard
1. Now that we’ve seen some unexpected behavior with recommendationservice, it makes sense to save this as a Dashboard to refer back to in the future. Click the Actions menu in the top right of Metrics Explorer, and select Add to dashboard. Then select Create new dashboard.
Note
There are multiple ways to share context in Observe, when doing ad-hoc investigation. While dashboards are very common, you can also save any Metric or Log query as a monitor, or simply share your current query and associated context as a link.
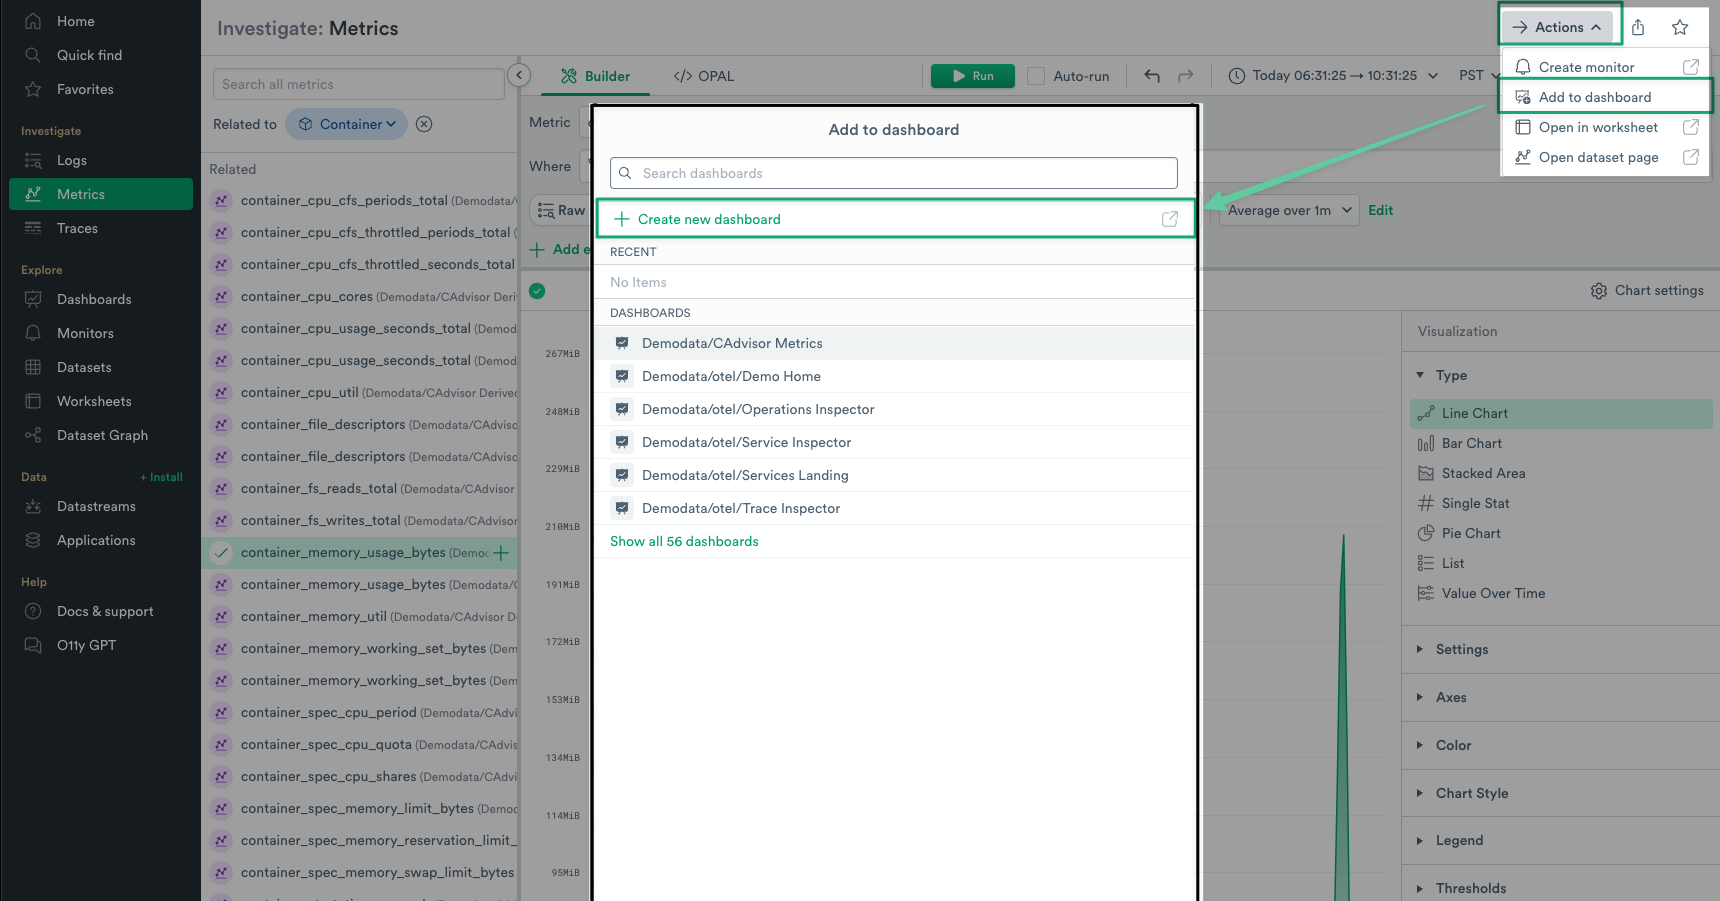
Figure 7 - Add Metrics Explorer Query to Dashboard
2. In a new tab you will see an unnamed dashboard. Click the pencil icon in the title field and rename your dashboard to Reco Service Memory. You can see that your time range was carried over, but editable. You can edit your new Metric Explorer panel, as well as add additional panels from other datasets (logs, traces, resources, etc.). Remember to click Save changes in the top right, and then Leave editor.
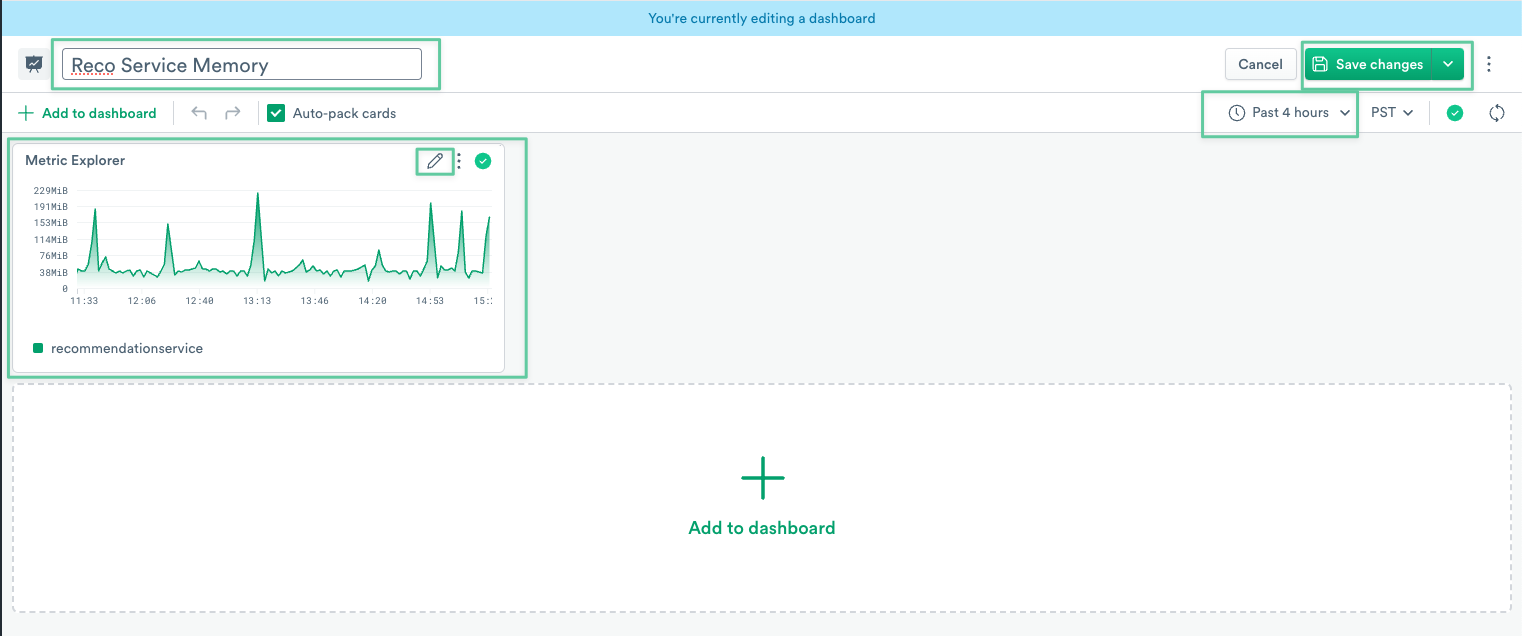
Figure 8 - Reco Service Memory Dashboard
Shaping and Joining Data
Now that you’ve uncovered one potential symptom, let’s use Observe to create a custom Log Dataset that joins in Span and Trace data for your Recommendation Service.
1. Navigate to the Datasets lister page and find the Container Logs dataset under the Demodata namespace. Click the “Open in New Worksheet” icon,
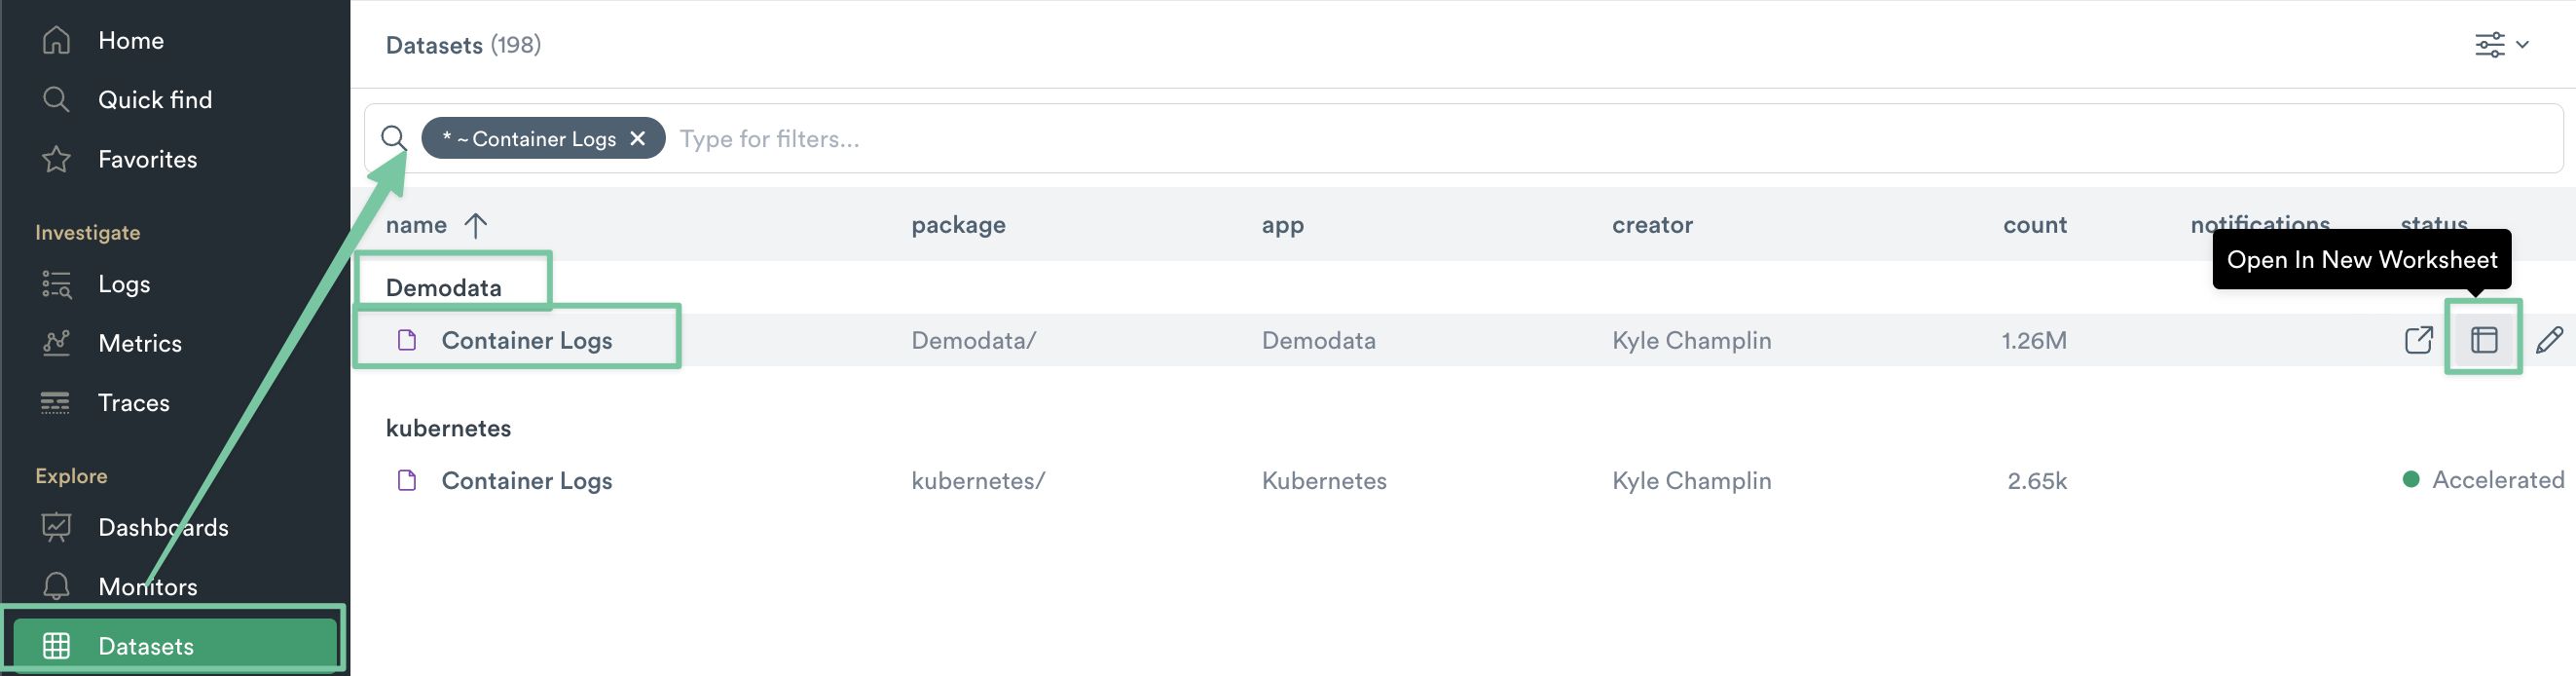
Figure 9 - Open Container Logs in a New Worksheet
2. With your Worksheet open, bring up the OPAL Console from the bottom of the page, and select the Inputs tab. Click Add Input and search for Trace, then select the Trace dataset under the Demodata/otel namespace. Repeat this for the Span Dataset as well, again selecting from the Demodata/otel namespace.
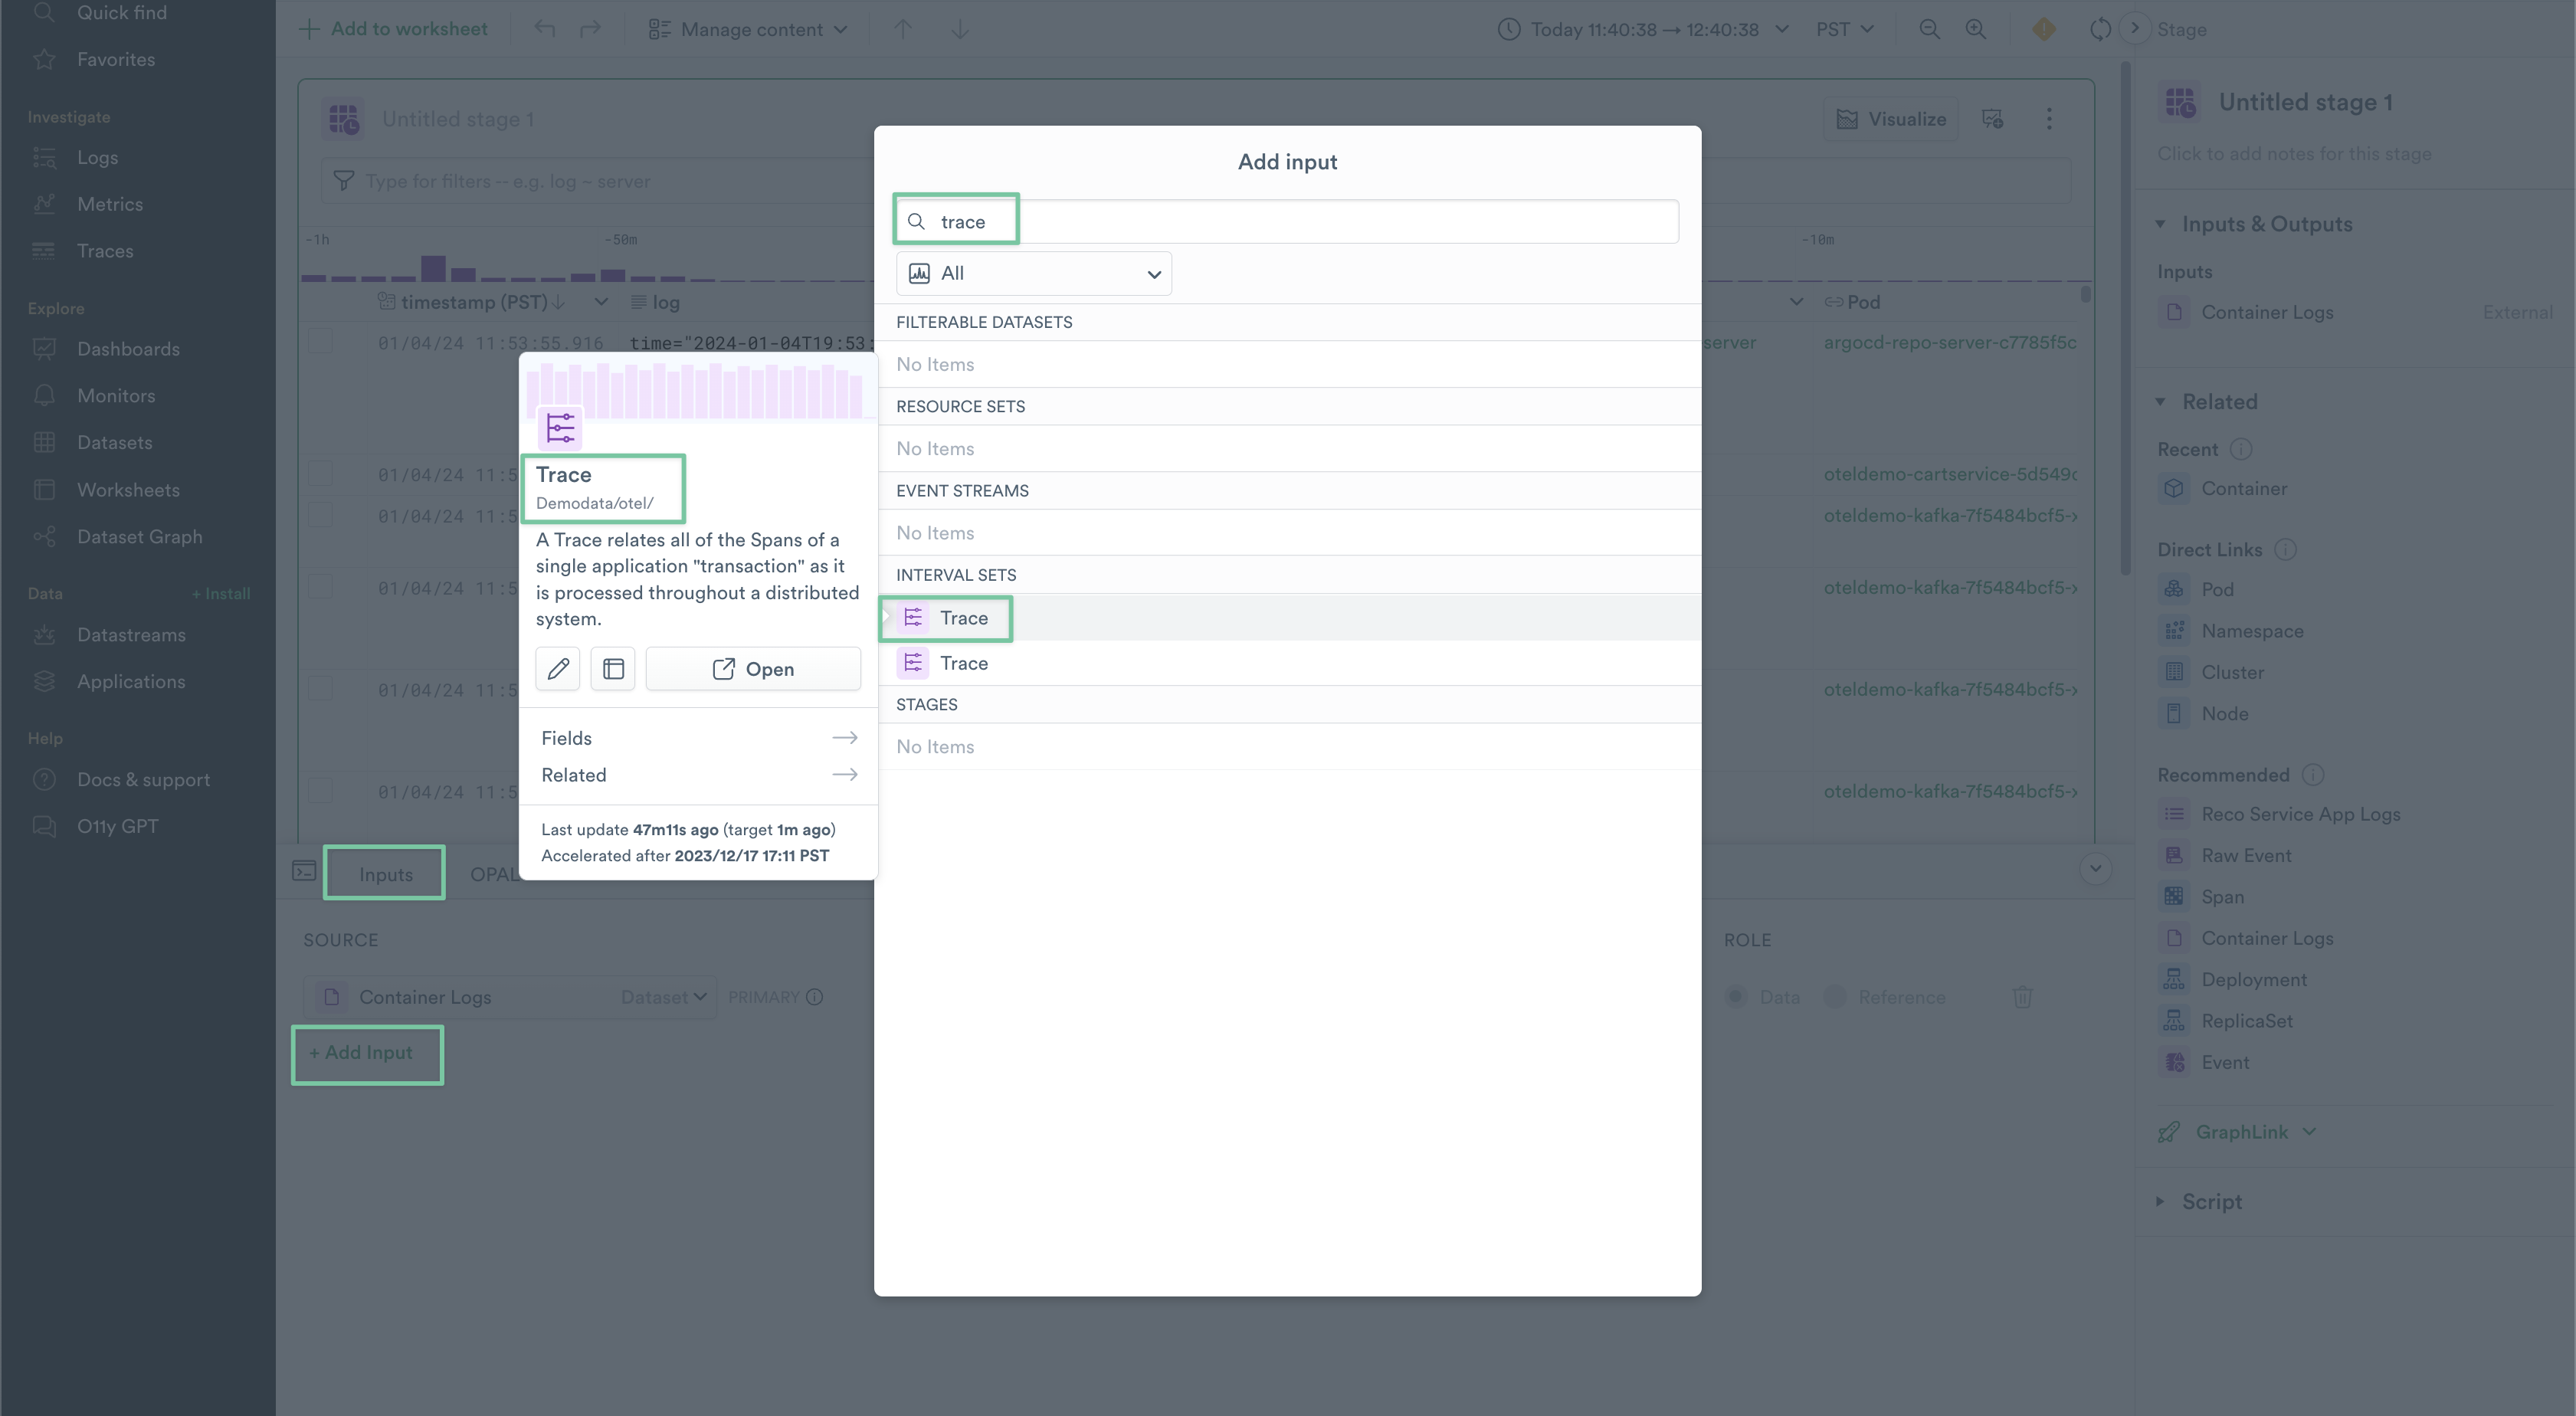
Figure 10 - Adding an Input to a worksheet
3. Update the name values for your new inputs to be trace and span, and set their Role to be Reference.
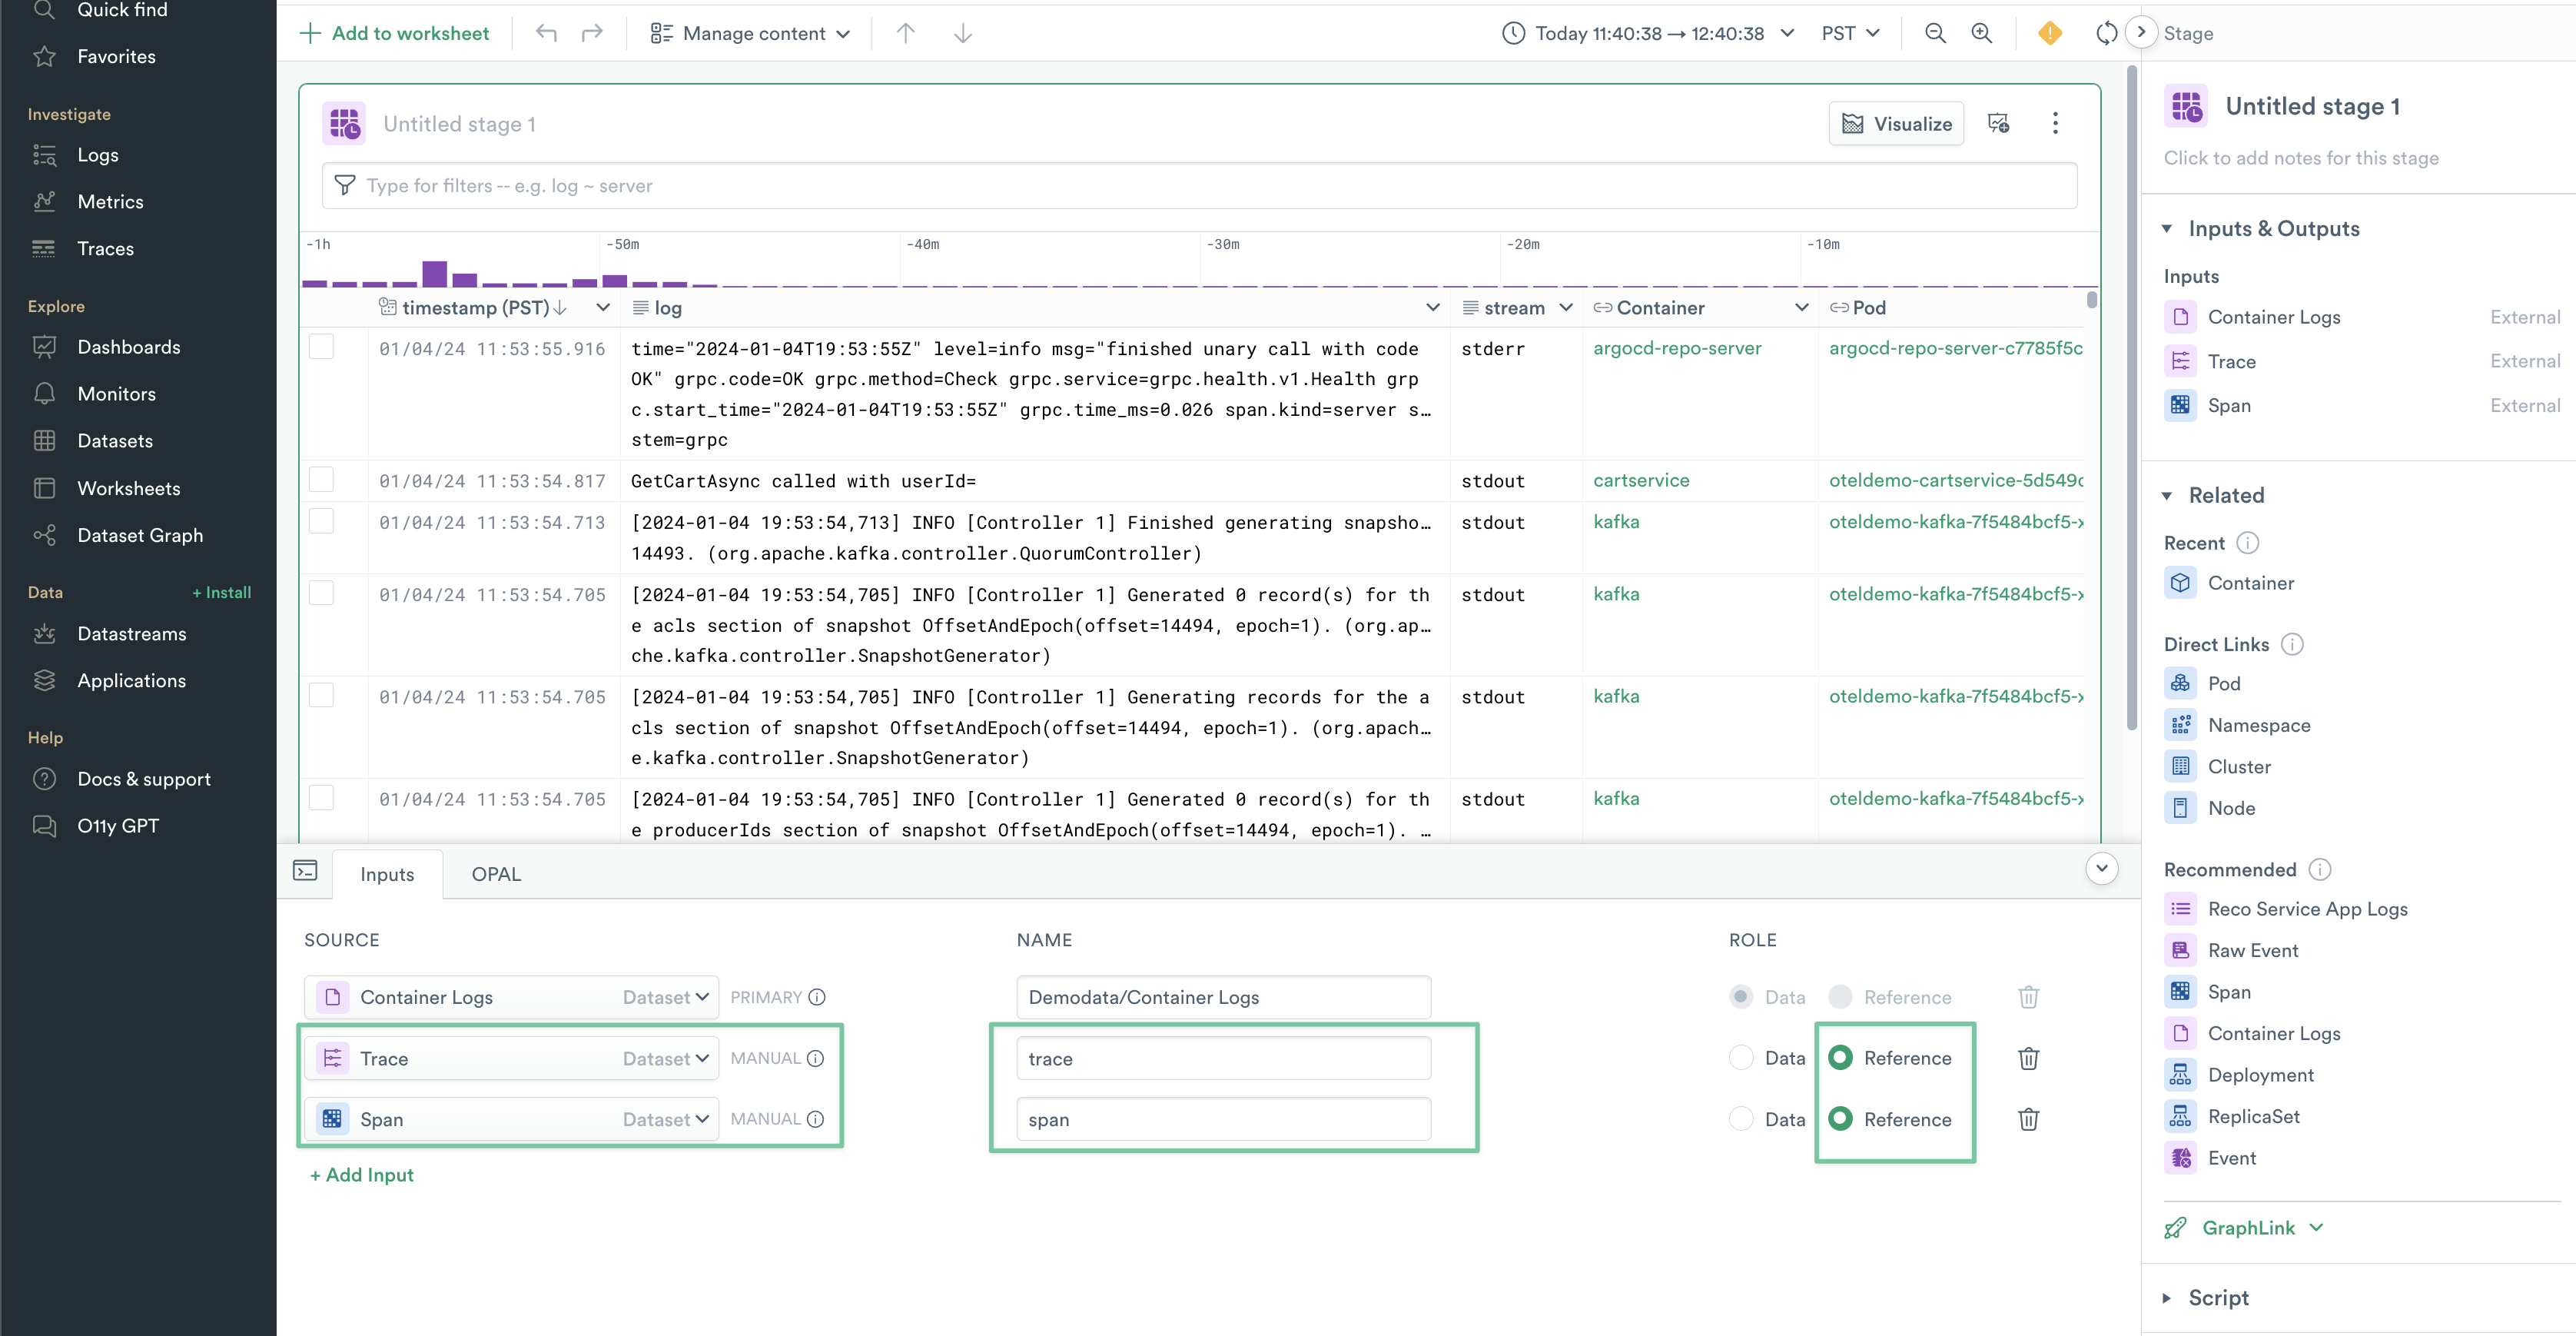
Figure 11 - Rename your newly added Worksheet sources
4. Switch to the OPAL tab in the console, paste the following OPAL script in, and click run.
//filter down to just your reccomendation service container logs
filter label(^Container)="recommendationservice"
// parse the raw log message and extract your span and trace IDs
make_col log_reco: parse_json(log)
make_col otelTraceID:string(log_reco.otelTraceID),
            otelSpanID:string(log_reco.otelSpanID),
           appmessage:string(log_reco.message)
// filter logs that don't have traces
filter not is_null(otelTraceID)
// hide your parsed values, just to keep things tidy
set_col_visible log_reco:false
// use the power of linking / joining to wire in your trace and span info directly to your logs
set_link ^"Demodata/otel/Trace", otelTraceID: @trace.trace_id
set_link ^"Demodata/otel/Span", otelSpanID: @span.span_id, otelTraceID:@span.trace_id
// export this to the Explorer via the interface verb
interface "log", "log":log
Each major section has comments explaining what each OPAL command is doing to shape the data. The most powerful command in your script is set_link, which is creating two Linked Columns; Demodata/otel/Trace and Demodata/otel/Span, which joins your Trace and Span datasets to the Logs emitted by recommendationservice.
You can now publish your newly shaped logs by clicking Publish New Dataset. Name the new Dataset Demodata/Reco Service App Logs.
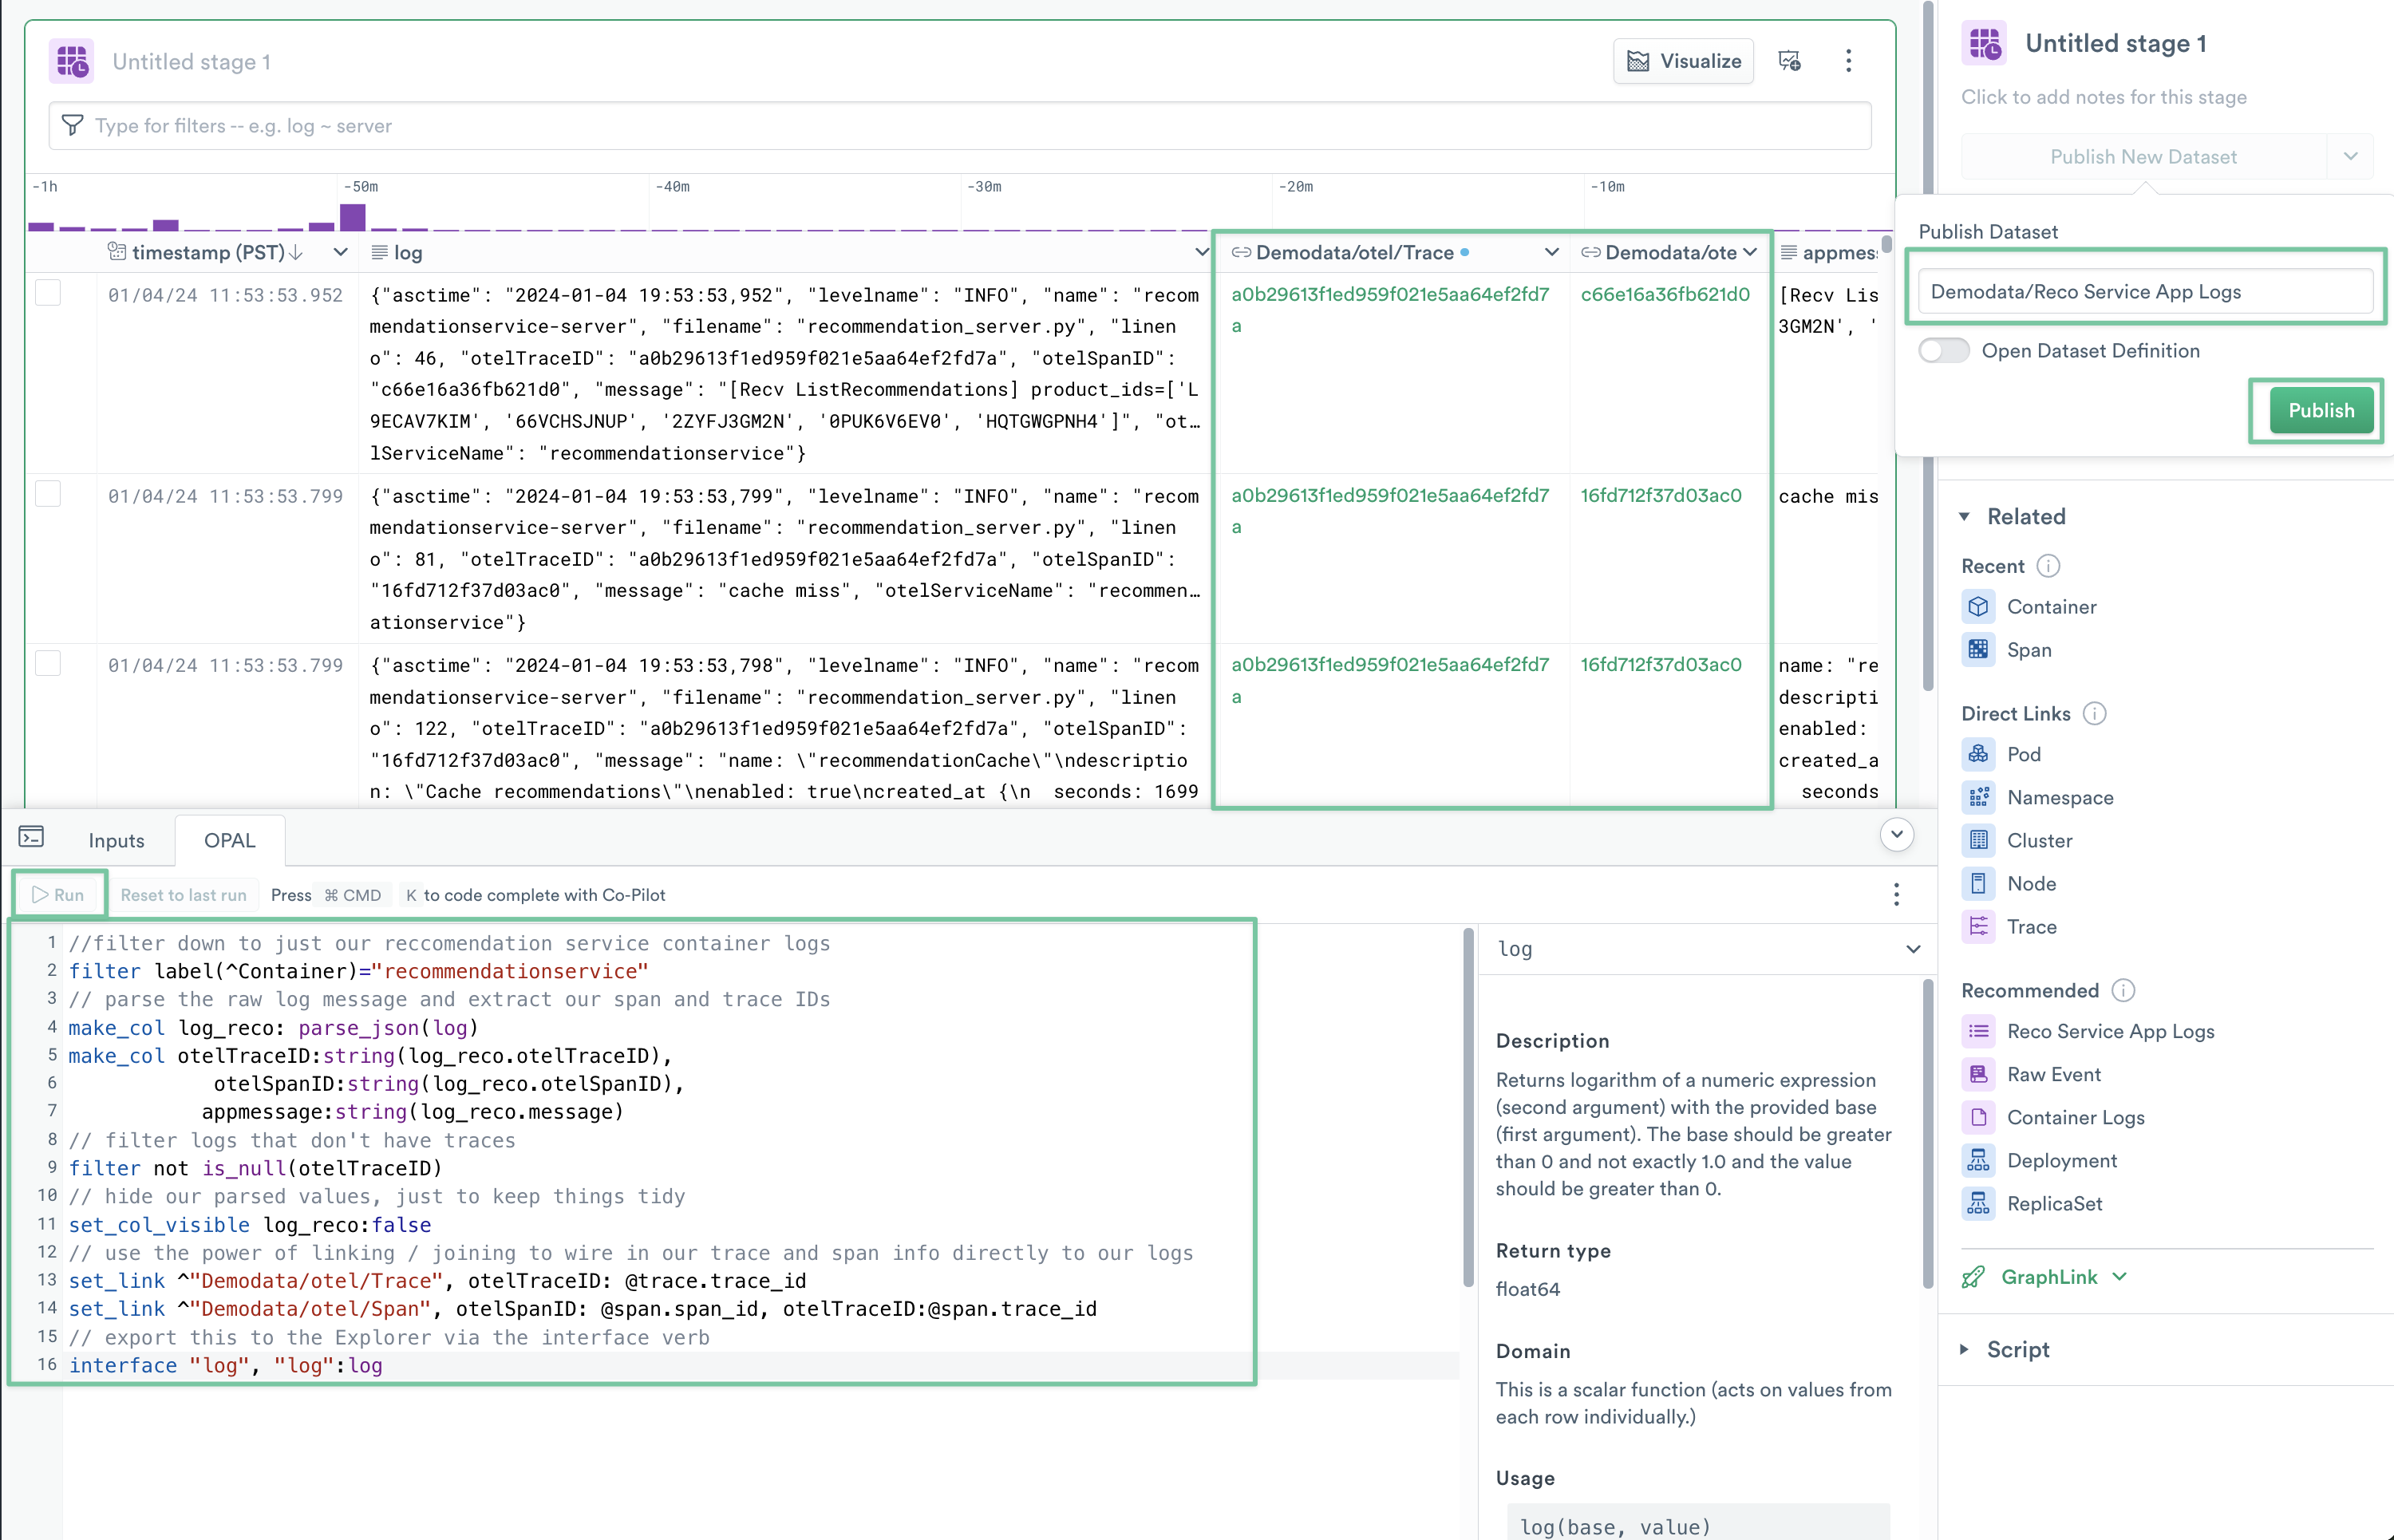
Figure 12 - Shaping, Linking and Publishing your new Logs
5. Navigate back to Logs Explorer, and locate your newly published Demodata/Reco Service App Logs. Your new columns are now available to pivot from, and you have also successfully parsed the message field into its own column appmessage. Click the drop-down arrow in the top right of one of the cells in the Demodata/otel/Trace column, and click the Trace ID under Selected resource > Instance Page. This should open a new tab.
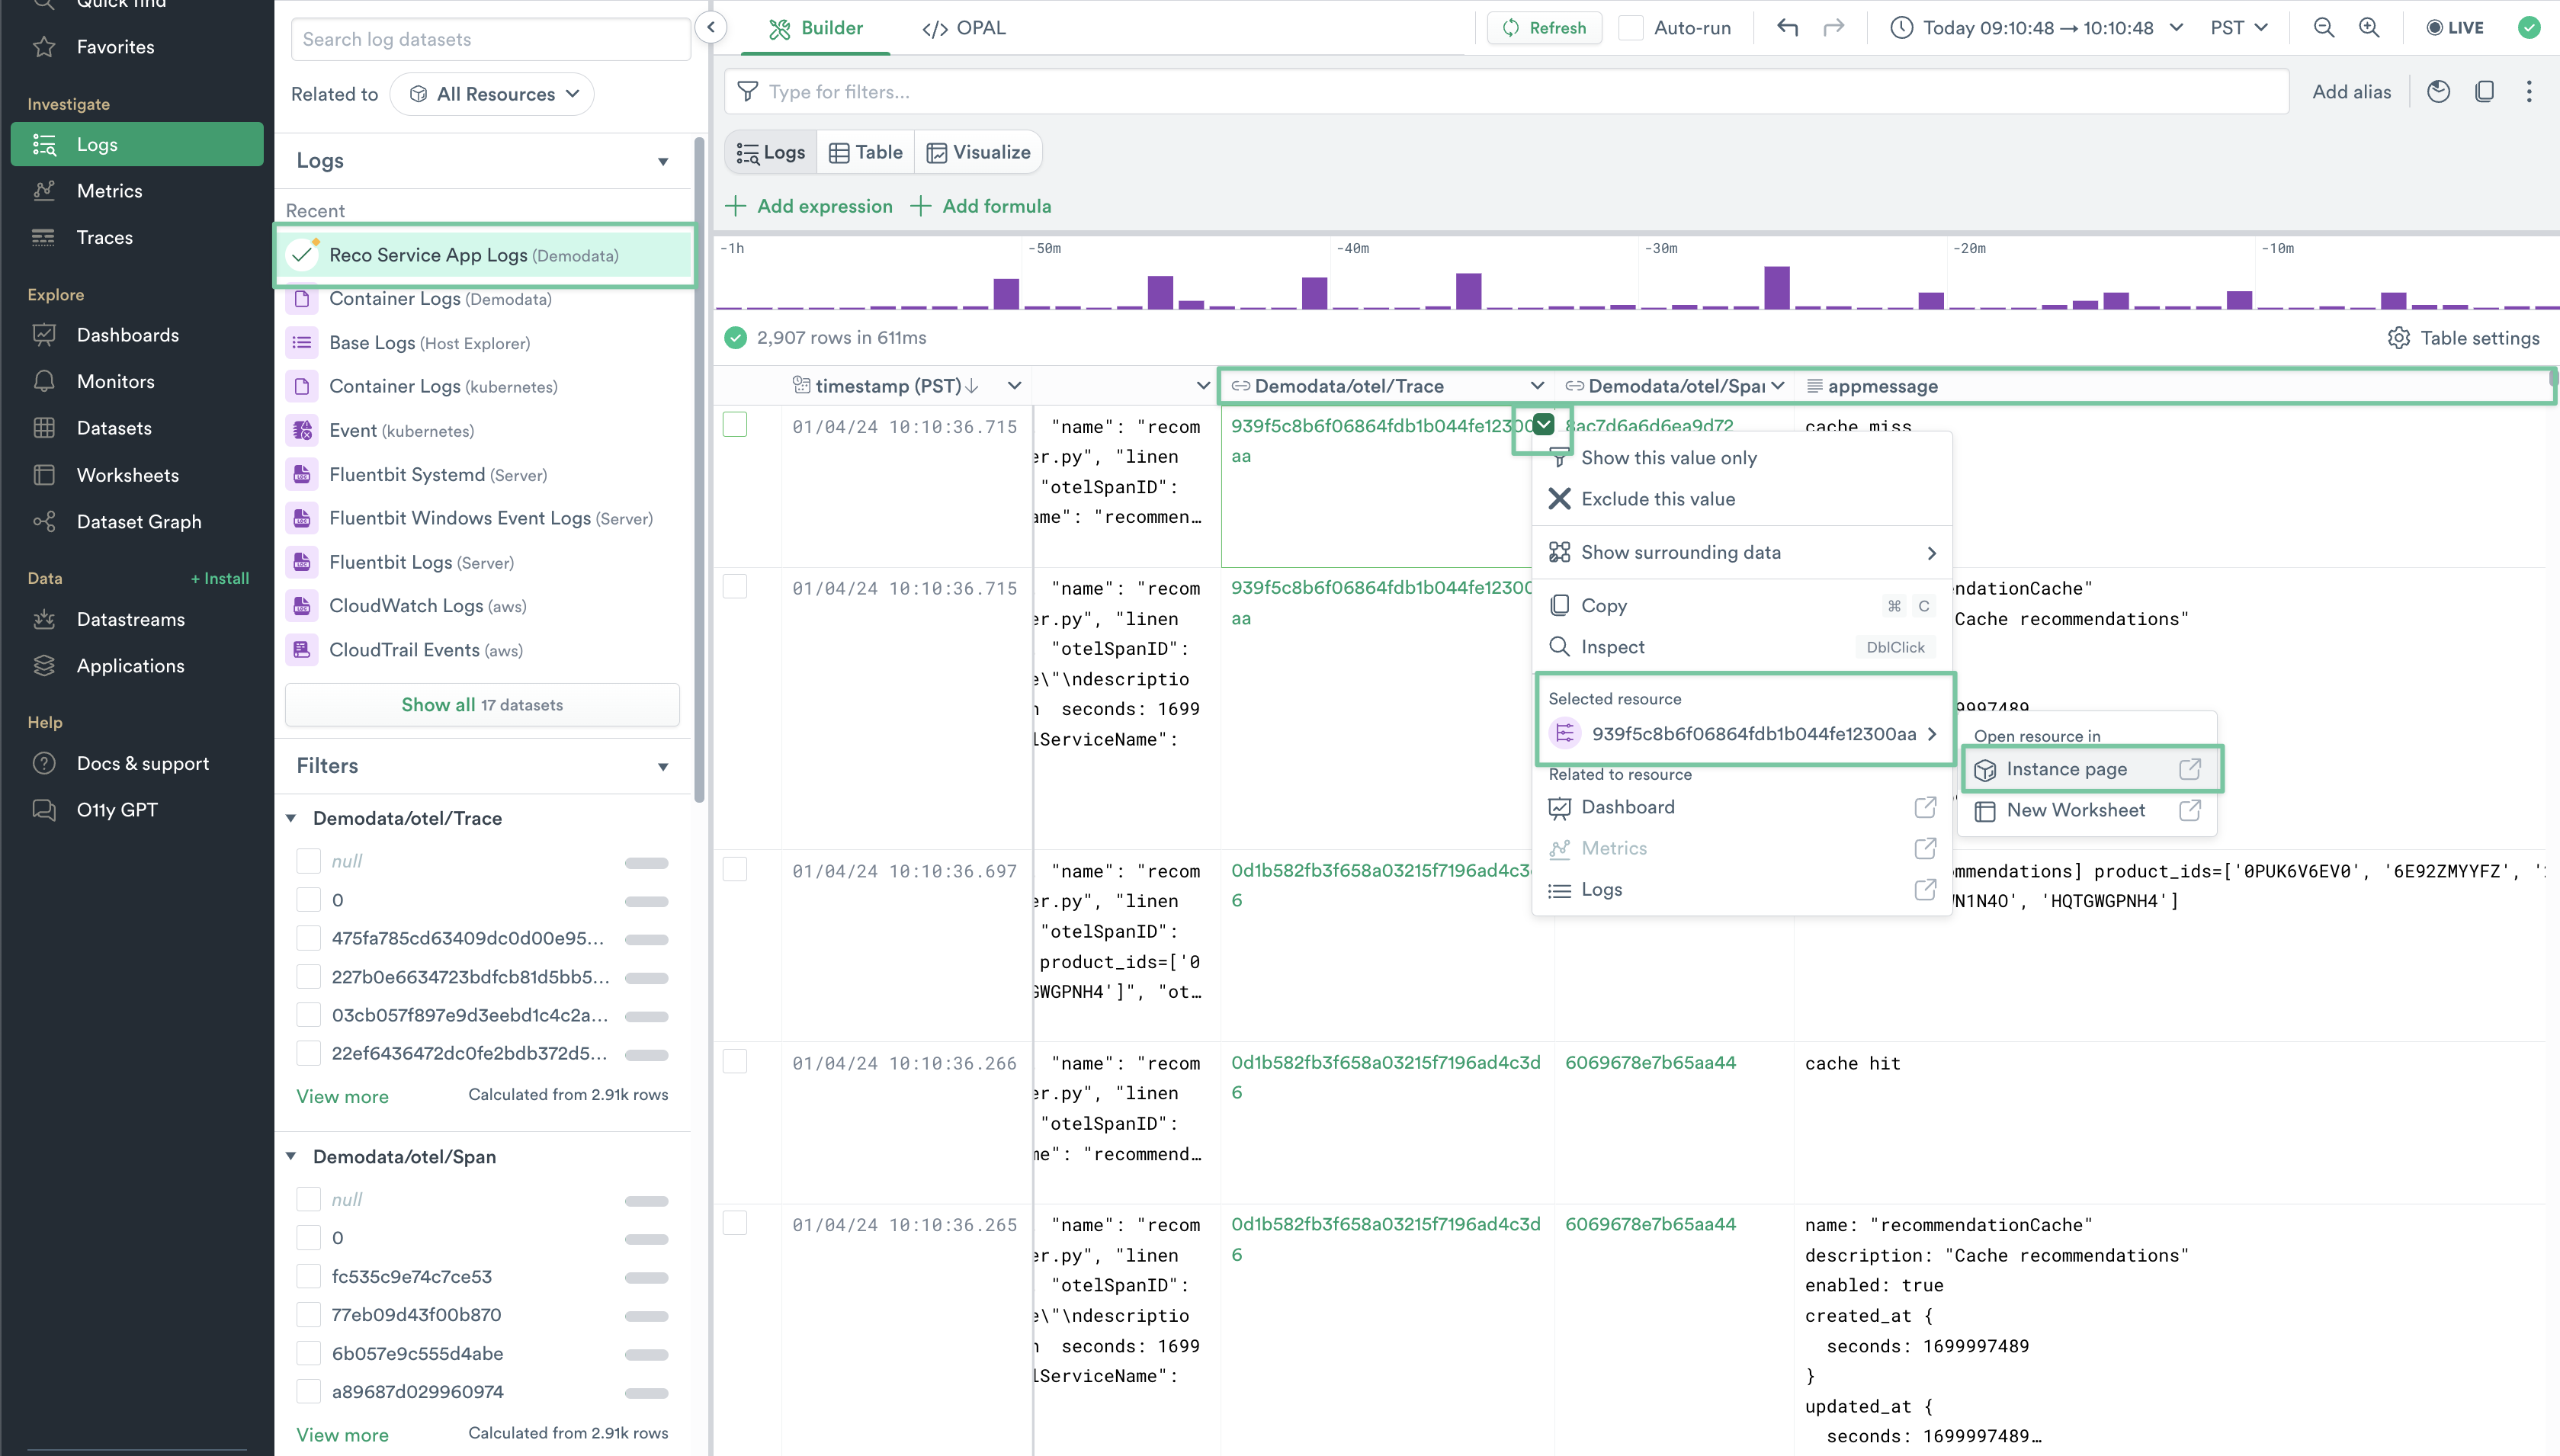
Figure 13 - Pivoting from Logs to Traces
Note
By double clicking the linked Demodata/otel/Trace or Demodata/otel/Span columns, summary data about Traces and Spans are also immediately available.
6. In your new tab, you will see your Trace Resource dashboard. Double-click the span grpc.hipstershop.RecommendationService/ListRecommendations associated to the frontend service. The right rail will contain a summary of the Trace data, and other attributes. You can also pivot into other Resource dashboards, such as Operation.
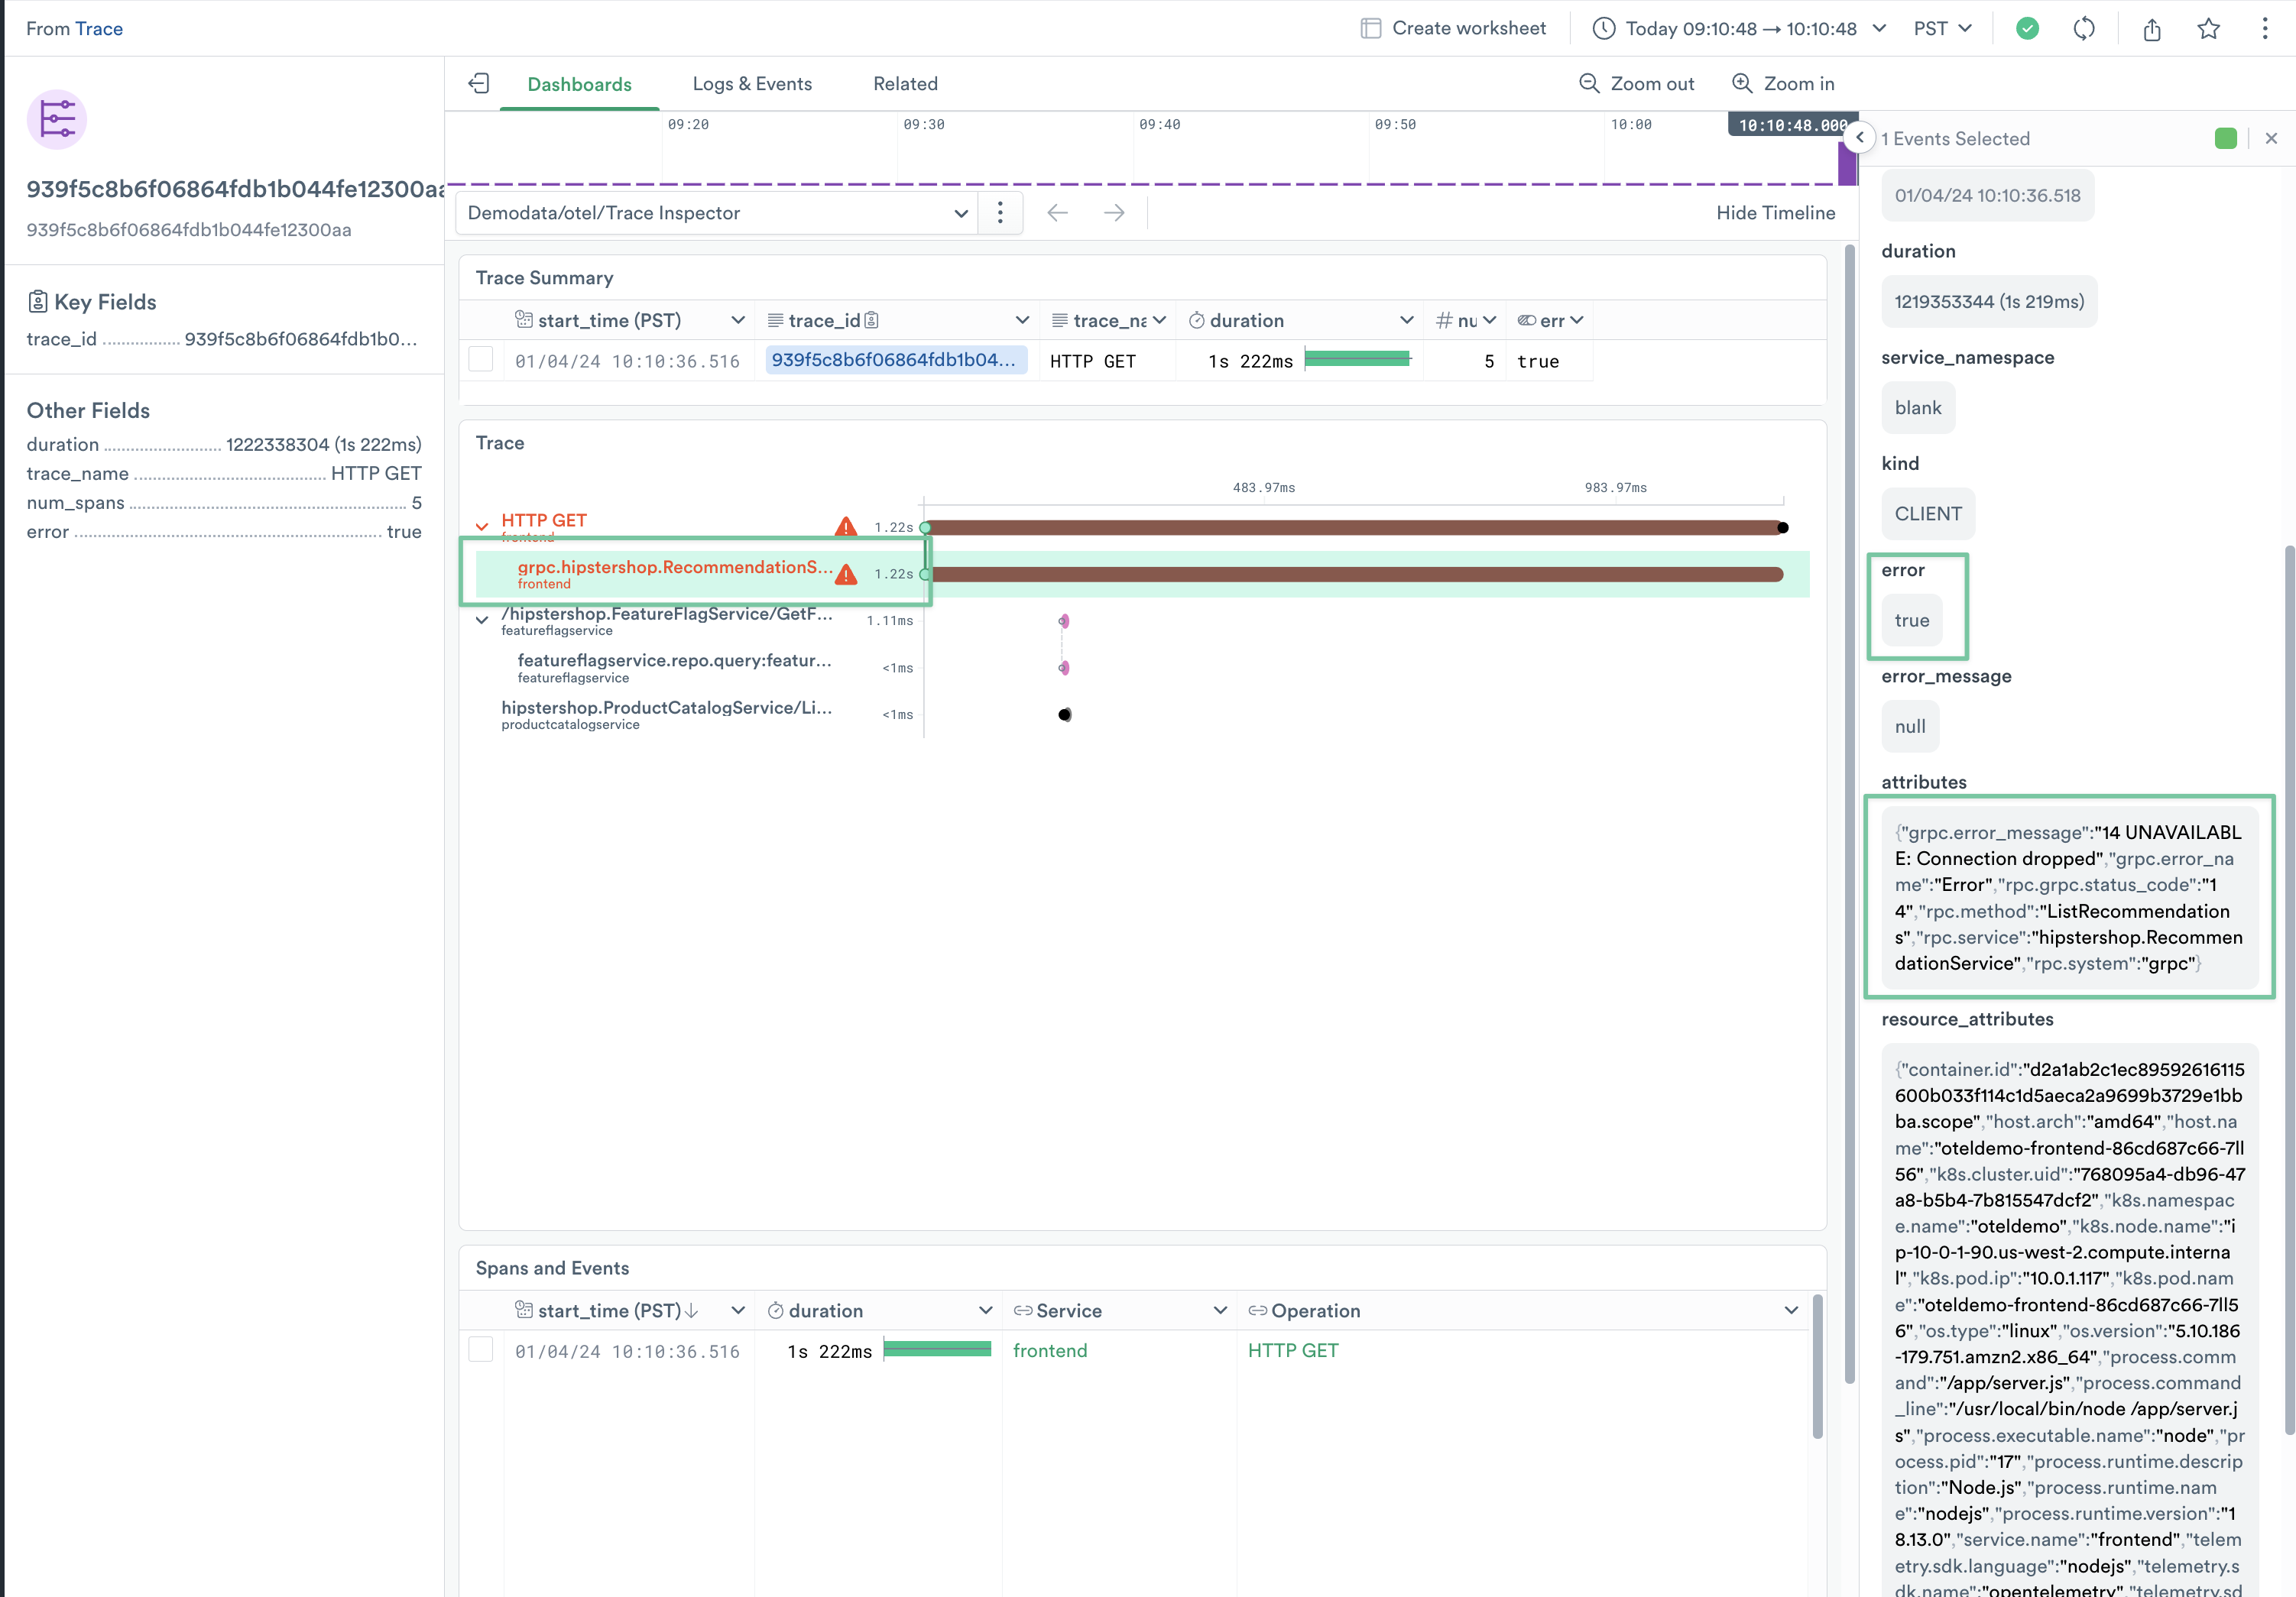
Figure 14 - Trace Resource Dashboard
Note
As service failures are intermittent, you may not immediately see a trace with an error. In the Log Explorer, you can filter down to just appmessage values that contain cache miss, which are more likely to have traces with errors.
Congratulations! Now that you have tied together Logs, Metrics and Traces, you feel confident that the recommendation service is likely suffering from OOM issues, possibly due to some application changes that have been exacerbated by a recent increase in user traffic. For now, you’ve paged the on-call developer for the service, and will start in on the inevitable Post Incident Review.