Host Monitoring [Legacy]
This content is being deprecated in favor of Host Quick Start Integration and will be removed in a future release.
We will continue to support our existing customers using this integration but recommend using the Host Quick Start Integration for your host monitoring use cases.
The Host Monitoring Integration is the fastest way to start monitoring your Linux and Windows servers in Observe. The package uses common open-source utilities to gather metrics, logs and system state from various endpoints. Monitor important performance counters like CPU, memory, disk and network IO, and more.
Observe helps you monitor the health and activity of your servers with the following features:
Datasets with details of your hosts, volumes, network configurations, and provisioned user accounts.
A dashboard with at-a-glance insights about the health of your servers, as well as troubleshooting boards to identify CPU or memory intense processes.
Additional datasets related to your hosts, such as logs and metrics.
Sample Monitor configurations to enable proactive alerting such as degradation of important performance counters or stopped and terminated processes.
Viewing Host Data in Observe
Host dataset
Use the Server/Host dataset and the Host Monitoring board to get an overview of your Linux and Windows environments and the health of your individual servers. This board includes useful performance and health metrics such as:
CPU and Memory Utilization
Disk usage and throughput
Network IO
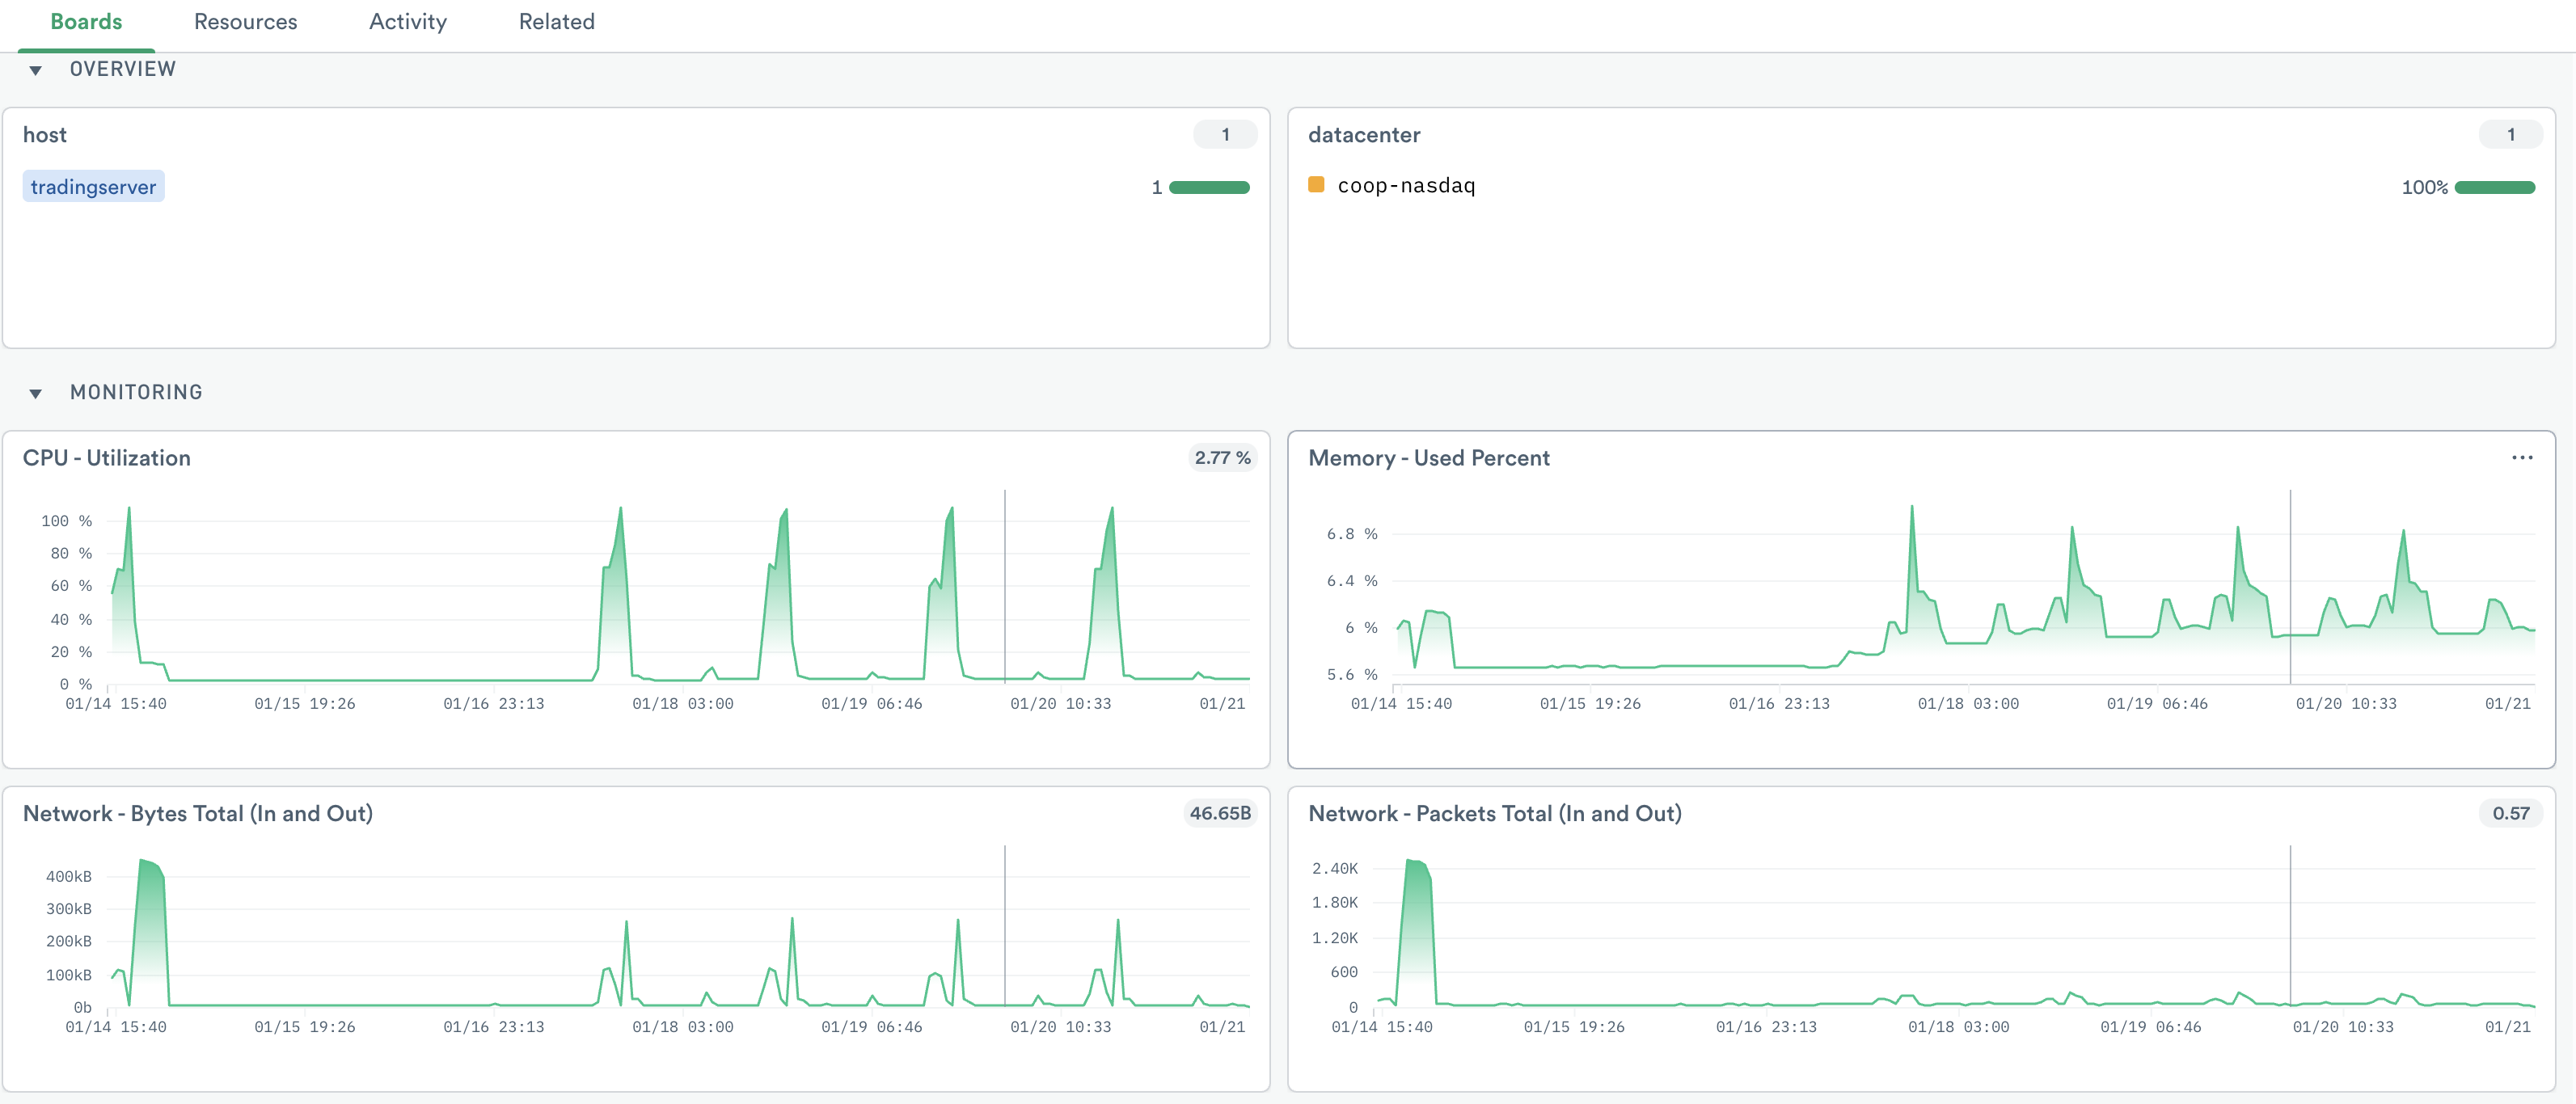
Figure 2 - CPU utilization, percent memory used, and packets in and out of the host.
If desired, filter to one or more hosts of interest. The default Host dashboard shows information about the selected hosts, such as spikes in CPU or memory usage, or IO resource contention.
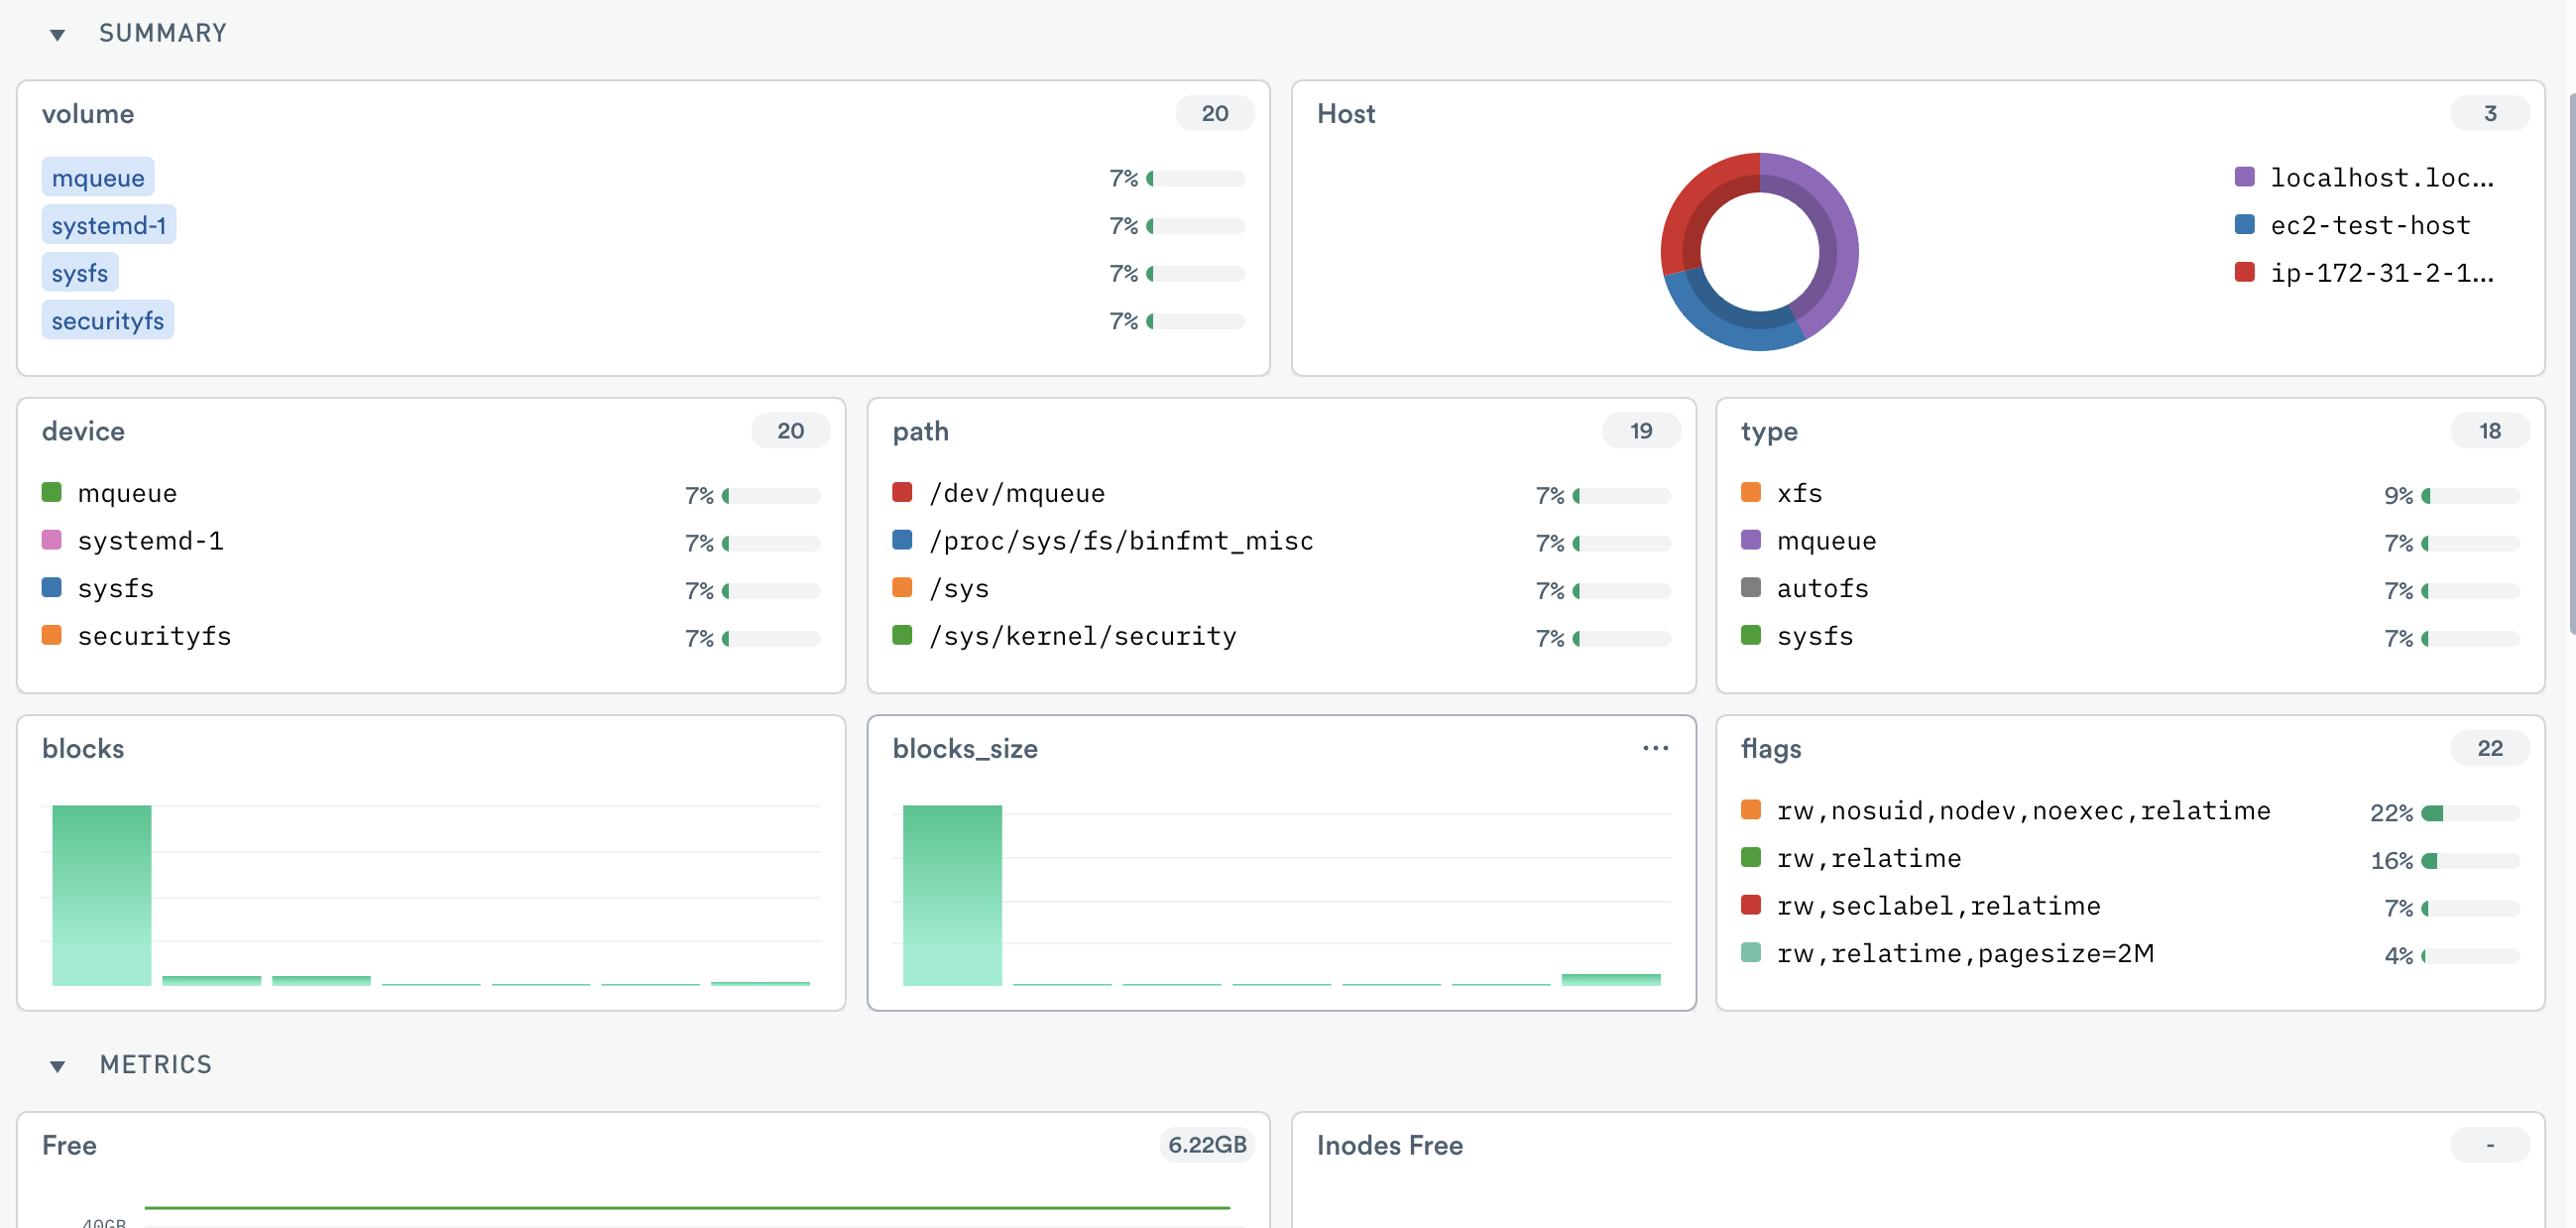
Figure 3 - Linux Volume dashboard with details
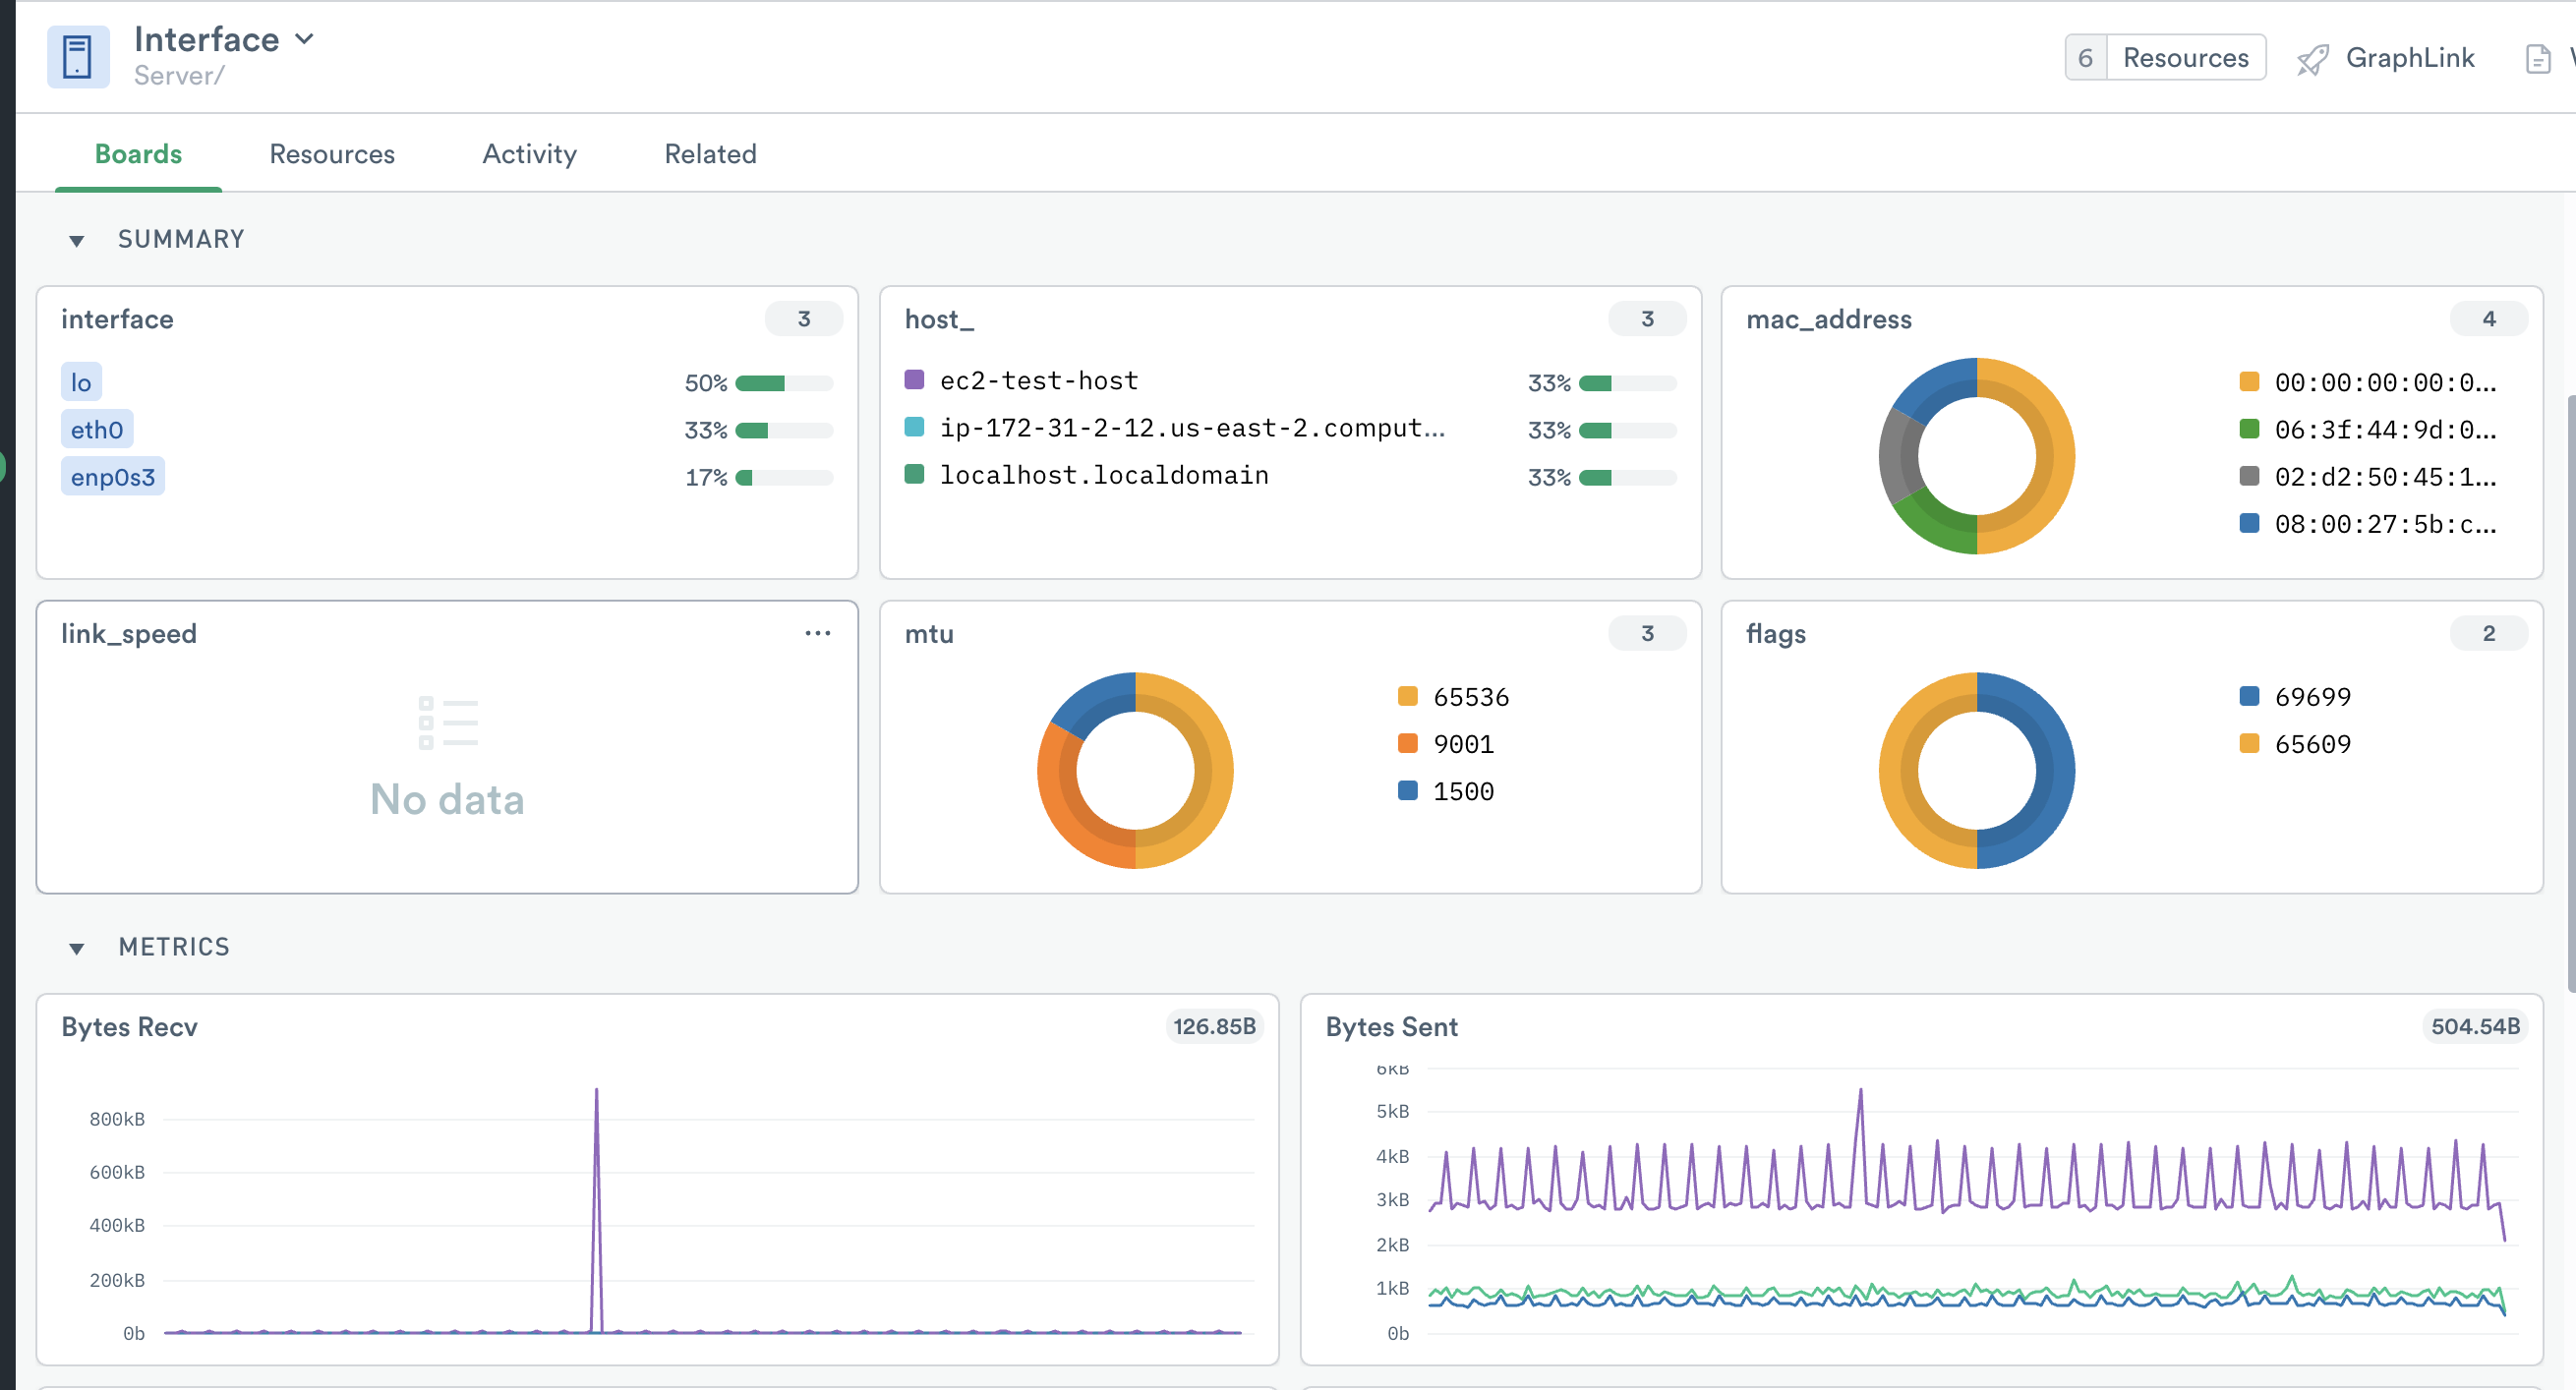
Figure 4 - Interface dashboard with details
You can also GraphLink to other datasets for related detail:
Volumes
Network interfaces
Users
If you run your hosts on AWS and you use the AWS app, also you can use GraphLink to view related instances:
EC2 instances
Security groups
VPC settings
To investigate a particular host, click the hexagon in the Active card or name in the Host card to display the Resource details in the right panel.
If you enabled Telegraf ProcessList, you can get a detailed view of how much CPU and memory utilized by each process on each host. You can also view Windows services if you have Telegraf Windows Services enabled.
For additional detail, click Open in the right menu to view the Resource page for the host. The default Host Instance Monitoring board displays details for the host, or select the Processlist Monitoring board for details of the processes running on that host.
Host Instance Monitoring details for a single host:
CPU utilization
Percent memory used
Network bytes in and out
Network packets in and out
Disk usage
Processlist and Windows Service Monitoring details of the processes running on a host:
CPU utilization
CPU and memory usage
Percent memory used
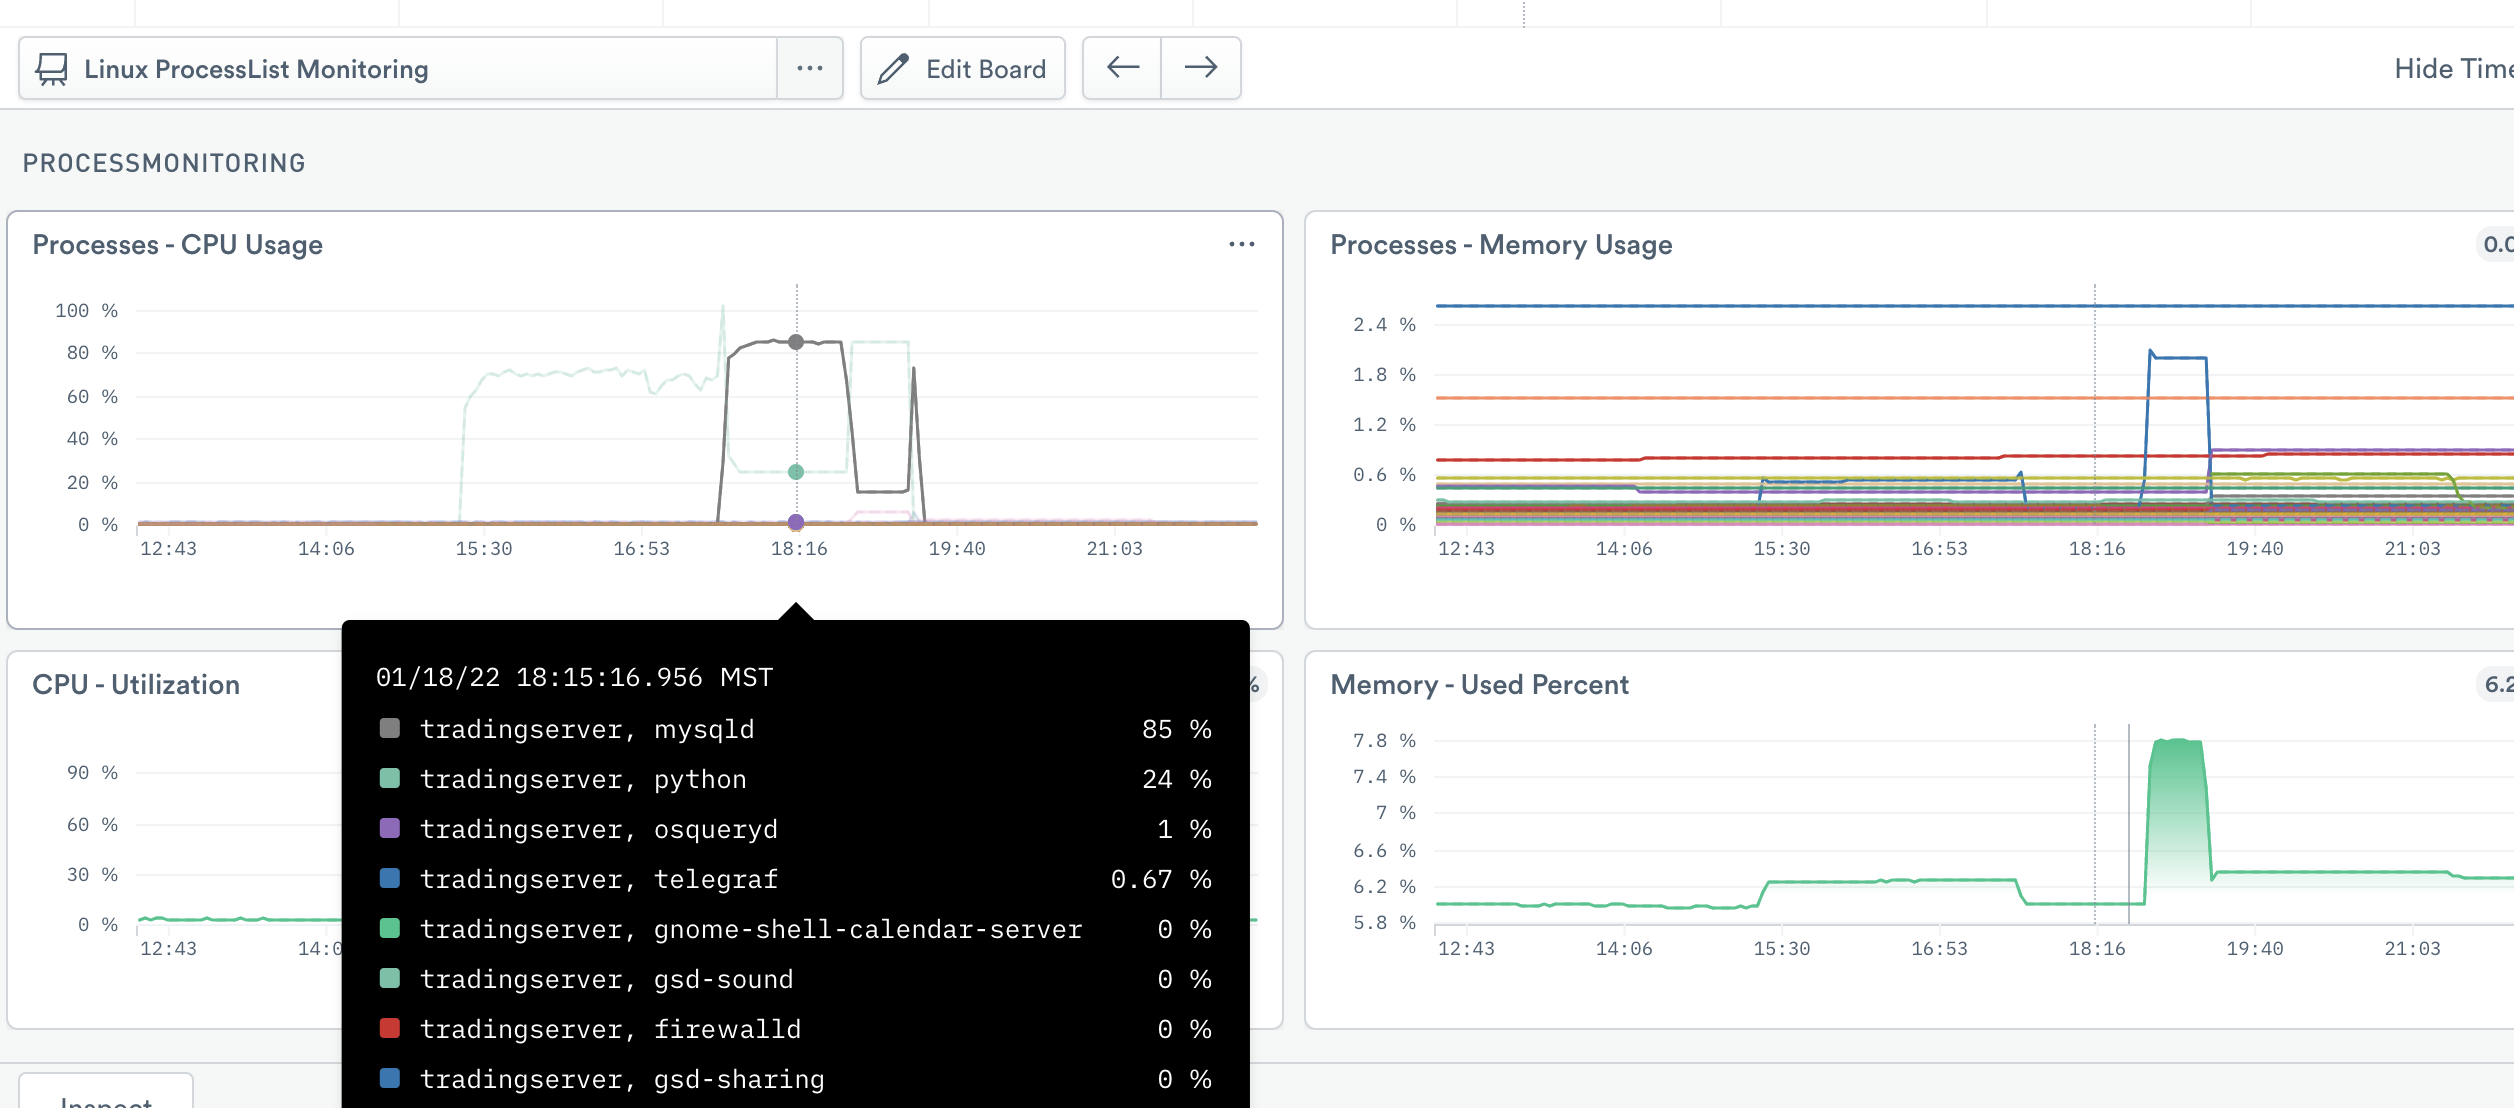
Figure 5 - Linux Host Dashboard
Monitors
Observe provides the following Monitor templates:
Host is down
Linux Process Down
Windows Service Stopped
CPU High for last 10 minutes
Memory over 95%
Disk has less than 5GB free
Disk utilization over 80%
Windows Scheduled Task Created
To use a template, go to the list of templates on the Monitors page and select the one you want to use. Make any desired configuration changes on the Create a Monitor page and click Save to enable it.
Setup
The Host Monitoring Integration uses several common Open Source tools. To install and configure data collection, see the Host Monitoring installation guide.
You can also use the Host Monitoring app to easily install all of the tools to run the monitoring service
With this data coming into Observe, you can shape it into datasets and boards and see what is happening with your infrastructure. You can see this in practice in this Linux Host Monitoring blog post. Note that while the blog post specifically mentions Linux, the datasets and workflows are the same for Windows.