Amazon Web Services (AWS)
The primary role that the AWS App plays is in seamlessly collecting CloudWatch Logs, CloudWatch Metrics, AWS Resources(Config), and other data from your AWS account and make these data useful for monitoring your AWS services.
Note
If you use the AWS App v0.59 or earlier, or use the Observe AWS Collection CloudFormation Templates, go to Amazon Web Services (AWS) Integration [Legacy]
Setup
Install the AWS App
On the left side navigation menu, click Applications, go to the Install new tab, and install the AWS App.
Collect AWS data
After the AWS App is installed, go to the Connections tab.
Click
Get startedof thePush metrics, logs and resources from AWS region.option.Put
AWS Account IDandAWS Region(e.g. us-west-2) to collect data from.Toggle
Enable Cloudwatch LogsonToggle
Enable Cloudwatch MetricstreamonToogle
Enable Configon. If you are already collecting AWS Config, toggle this option off and specify the S3 bucket name (e.g. config-bucket-091312542283) where you store AWS Config. You can find the S3 bucket name from the Settings page for AWS Config. Once you find the S3 bucket name, put it in theConfigDeliveryBucketNamefield under theAWS Configsection in the CloudFormation template you will find in the next step.Optionally change the name which will be used as the name for CloudFormation stack or Terraform module in the next step.
Click
CreateClick
quick-create linkto install a pre-configured CloudFormation template in the AWS Console. This CloudFormation template is to create a required AWS IAM role, its policy, and necessary AWS services automatically for data collection. Once the CloudFormation stack is created successfully, data will be pushed to Observe.Complete the creating-stack steps in the AWS Console.
For CloudWatch Logs, you can further restrict collection to a set of log group name prefixes or patterns in the CloudFormation template. By default, it will collect logs from all log groups avaialble in your AWS account’s region you specified in Step 2.
For CloudWatch Metrics, You can provide further adjustments to collection in the CloudFormation template. You can check what metrics are being collected by default.
curl -o recommended.yaml https://observeinc.s3.us-west-2.amazonaws.com/cloudwatchmetrics/filters/recommended.yaml
For AWS Resources (Config), You can fine tune collection to a subset of resource types in the CloudFormation template.
Optionally, if you want to send files including CloudTrail events, VPC Flow logs, or other files you store in S3 buckets, you can provide a list of S3 bucket names in the
SourceBucketNamesfield under theForwader Optionssection in the CloudFormation template. The Forwader will read new files from the list of S3 buckets. Make sureAmazon EventBridgeis enabled for these S3 buckets. You can find theAmazon EventBridgesetting under the properties tab for S3 buckets.
If you want to filter metrics by tags or don’t want to use a metric stream for CloudWatch Metrics, you can pull metrics instead.
Note
If you already created a CloudFormation stack to collect logs, metrics, and resources, disable the existing metrics collection first. Find the existing CloudFormation stack (e.g. observe-collection-xxx) in the AWS Console, click Update, click Use existing template, empty the MetricStreamFilterUri field under the CloudWatch Metrics section. Complete the rest of CloudFormation steps.
Click
Get startedof thePull CloudWatch Metrics from AWSoption.Put
AWS Account IDandAWS Region(e.g. us-west-2) to collect data from.Change
Interval Durationto adject a collection interval. Default is 5 minutes.List AWS namespaces (e.g. AWS/EC2, AWS/Lambda) you’d like to collect metrics from.
Optionally change the name which will be used as the name for CloudFormation stack or Terraform module in the next step.
List of resource tags to filter metrics for.The supported format is
or =value1,value2,value3. For exmaple, if you want to collect metrics that include Environmentas a tag key, you can putEnvironmenthere. If you want to collect metrics that includeEnvironment=ProdorEnvironment=Staging, you can putEnvironment=Prod,Staginghere.Click
CreateClick
quick-create linkto install a pre-configured CloudFormation template in the AWS Conosle. This CloudFormation template is to create a required AWS IAM role and its policy automatically for metric collection. Once the role and policy are created successfully, Observe poller will pull CloudWatch metrics based on your selections above.Complete the creating-stack steps in the AWS Console.
If you want to send files including CloudTrail events, VPC Flow logs, or other files you store in S3 buckets, this option helps you forward new fiels to Observe easily. The Forwader will read new files from the list of S3 buckets. Make sure Amazon EventBridge is enabled for these S3 buckets. You can find the Amazon EventBridge setting under the properties tab for S3 buckets.
Click
Get startedof theForward data from S3option.Put
AWS Account IDandAWS Region(e.g. us-west-2) to collect data from.Optionally change the name which will be used as the name for CloudFormation stack or Terraform module in the next step.
Put a list of bucket names the forwarder will be allowed to read from.
Click
CreateClick
quick-create linkto install a pre-configured CloudFormation template in the AWS Console. This CloudFormation template is to create a required AWS IAM role, its policy, and necessary AWS services automatically for data collection. Once the CloudFormation stack is created successfully, data will be pushed to Observe.Complete the creating-stack steps in the AWS Console.
FAQ
How do I troubleshoot AWS data collection?
First, go to the CloudFormation in the AWS console and check whether CloudFormation stacks are successfully created.
Second, you can get traces for the AWS data collection by following the steps below.
Go to the AWS datastream and create a token.
Find the existing CloudFormation stack (e.g. observe-collection-xxx) in the AWS Console, click
Update, clickUse existing template, setDebugEndpointtohttps://<token>@<customerId>.collect.observeinc.com/v2/otel(e.g. https://ds1Xd63TEfS5dYodBSyf:OaAdWXaFGaLlx2wdCjzhL5ih06-redacted@123456789.collect.observeinc.com/v2/otel) under theDebugging Optionssection.Go to the AWS datastream and click on the token you created in Step 1.
Click
Open dataset.
If you are facing issues or pulling metrics, use the in-product Contact Support button to contact Observe for more information. On the left side navigation menu, click Docs & Support, Contact Support, and Send Us a Message to contact an Observe Data Engineer.
How do I filter metrics?
Observe offers two ways to collect metrics:
Push-based data collection uses a CloudWatch metric stream and supports filtering metrics by namespace (e.g.
AWS/EC2,AWS/RDS) or by metric name (e.g.CPUUtilization)Pull-based data collection uses CloudWatch API (ListMetrics, GetMetricData) and supports filtering metrics by namespace (e.g.
AWS/EC2,AWS/RDS), by metric name (e.g.CPUUtilization), or by tag (e.g.Environment,Environment=Prod,Staging)
We recommend you should pick one way, either push or pull, to collect metrics. Using both methods at the same time could make it difficult to troubleshoot issues.
Note
AWS::CloudWatch::MetricStream supports one of the following:
Stream metrics from all metric namespaces in the account.
Stream metrics from all metric namespaces in the account, except for the namespaces that you list in
ExcludeFilters.Stream metrics from only the metric namespaces that you list in
IncludeFilters. You cannot specify bothIncludeFiltersandExcludeFiltersin the same metric stream.
Collect EC2 metrics only
Let’s suppose that you are only interested in collect EC2 metrics.
Create a
filter-metrics-example-01.yamlwith the following content.
IncludeFilters:
  - Namespace: AWS/EC2
Upload
filter-metrics-example-01.yamlto an S3 bucket and find the S3 URL (e.g. s3://observe-filter-metrics/filter-metrics-example-01.yaml)Find the existing CloudFormation stack (e.g. observe-collection-xxx) in the AWS Console, click
Update, clickUse existing template, put the S3 URL (e.g. s3://observe-filter-metrics/filter-metrics-example-01.yaml) into theMetricStreamFilterUrifield under the CloudWatch Metrics section. Complete the rest of CloudFormation steps.
Collect CPUUtilization only from EC2 instances
Let’s suppose that you want to collect CPUUtilization only from your EC2 instances (AWS/EC2).
Create a
filter-metrics-example-02.yamlwith the following content.
IncludeFilters:
  - Namespace: AWS/EC2
    MetricNames:
      - CPUUtilization
Upload
filter-metrics-example-02.yamlto an S3 bucket and find the S3 URL (e.g. s3://observe-filter-metrics/filter-metrics-example-02.yaml)Find the existing CloudFormation stack (e.g. observe-collection-xxx) in the AWS Console, click
Update, clickUse existing template, put the S3 URL (e.g. s3://observe-filter-metrics/filter-metrics-example-02.yaml) into theMetricStreamFilterUrifield under the CloudWatch Metrics section. Complete the rest of CloudFormation steps.
You can find CloudWatch metrics that are available for your EC2 instances [here].(https://docs.aws.amazon.com/AWSEC2/latest/UserGuide/viewing_metrics_with_cloudwatch.html)
Do NOT collect TruncateFinishedPoint from RDS instances
Let’s suppose that you do NOT want to collect TruncateFinishedPoint from your RDS instances (‘AWS/RDS`).
Create a
filter-metrics-example-03.yamlwith the following content.
ExcludeFilters:
  - Namespace: AWS/RDS
    MetricNames:
      - TruncateFinishedPoint
Upload
filter-metrics-example-03.yamlto an S3 bucket and find the S3 URL (e.g. s3://observe-filter-metrics/filter-metrics-example-03.yaml)Find the existing CloudFormation stack (e.g. observe-collection-xxx) in the AWS Console, click
Update, clickUse existing template, put the S3 URL (e.g. s3://observe-filter-metrics/filter-metrics-example-03.yaml) into theMetricStreamFilterUrifield under the CloudWatch Metrics section. Complete the rest of CloudFormation steps.
You can find CloudWatch metrics that are available for your RDS instances [here].(https://docs.aws.amazon.com/AmazonRDS/latest/UserGuide/rds-metrics.html)
Collect all CloudWatch metrics
Find the existing CloudFormation stack (e.g. observe-collection-xxx) in the AWS Console, click
Update, clickUse existing template, put the S3 URL (e.g. s3://observeinc/cloudwatchmetrics/filters/full.yaml) into theMetricStreamFilterUrifield under the CloudWatch Metrics section. Complete the rest of CloudFormation steps.
s3://observeinc/cloudwatchmetrics/filters/full.yaml includes the following filter.
ExcludeFilters: []
Collect metrics that include Environment as a tag key
Find the existing poller (e.g. arn:aws:iam::1234567890:role/observe-metrics-poller-xxx) under the
Connectionstab for the AWS App or in theAWSdatastream.Edit the poller and put
Environmentin theResource Tagsfield.Click
UpdateandClose.
Collect metrics that include Environment=Prod or Environment=Staging
Find the existing poller (e.g. arn:aws:iam::1234567890:role/observe-metrics-poller-xxx) under the
Connectionstab for the AWS App or in theAWSdatastream.Edit the poller and put
Environment=Prod,Stagingin theResource Tagsfield.Click
UpdateandClose.
What is Filedrop?
By default, Observe uses the Filedrop backend, and creates a Lambda function to read files from customer’s S3 bucket, sending them to Observe’s S3 endpoint managed by the Filedrop backend. This service can help reduce data transfer (egress) costs. If preferred, you can disable Filedrop, allowing the Lambda function to read files directly from your S3 bucket and send them to Observe’s HTTP collection endpoint.
What configuration variables are available?
Documentation for configuration variables can be found here: CloudFormation
How to Retrieve Canary Artifacts Generated by Amazon CloudWatch Synthetics
Each Canary run generates an artifact, a JSON file written to an S3 bucket. Create a bucket Event notification to tell the Observe Lambda function to send this file to Observe.
Specify the destination bucket when creating a Canary. If you do not provide a destination bucket, AWS creates one for you.
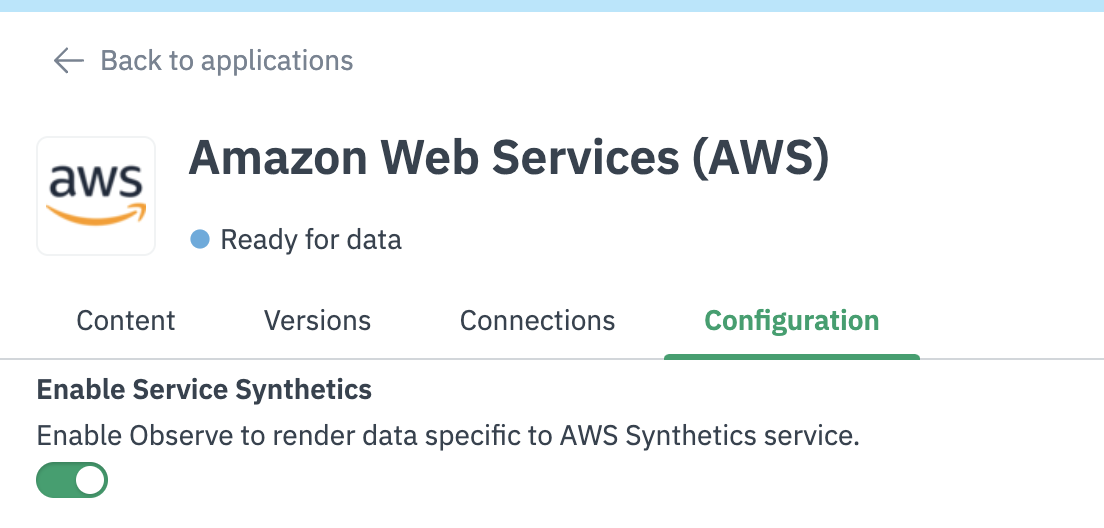
Enable Service Synthetics in the AWS App. If you have not yet installed the AWS App, install it and then enable Service Synthetics.
AWS App Configuration
The following datasets and dashboards require the legacy AWS integration which creates snapshots periodically for AWS Synthetics.
Datasets: Synthetics Canary Steps, Synthetics Canary, and Synthetics Canary Run Instance
Dashboards: Synthetics Canary Monitoring and Synthetics Canary Run Instance
In the AWS Console, navigate to CloudFormation and create a new stack with new resources (standard). Choose Choose an existing template and select Amazon S3 URL. Provide the following URL for the template (
https://observeinc.s3-us-west-2.amazonaws.com/cloudformation/collection-latest.yaml).This is the CloudFormation template for the legacy AWS integration. Set the following fields correctly.Stack name (e.g.,
observe-legacy-aws-synthetics)ObserveCustomer: Your Observe Customer ID (e.g.,
123456790)ObserveToken: A valid datastream token associated with the AWS datastream or the datastream used by the AWS App
EventBridgeSnapshotConfig (under EventBridge Configuration): Replace the default with
cloudformation:Describe*,cloudformation:List*,lambda:List*TrailEnabled (under CloudTrail Configuration): Set to false
MetricsEnabled (under CloudWatch Metrics Configuration): Set to false
ObserveDomain: Confirm that this is set correctly (defaults to observeinc.com)
Leave all other default values as-is.
After your CloudFormation stack is successfully created, go to the Resources tab. Find and note the Lambda Physical ID (e.g.,
observe-legacy-aws-synthetics).Look for the bucket that is used by CloudWatch Synthetics (e.g.,
cw-syn-results-<aws-id>-<aws-region>).
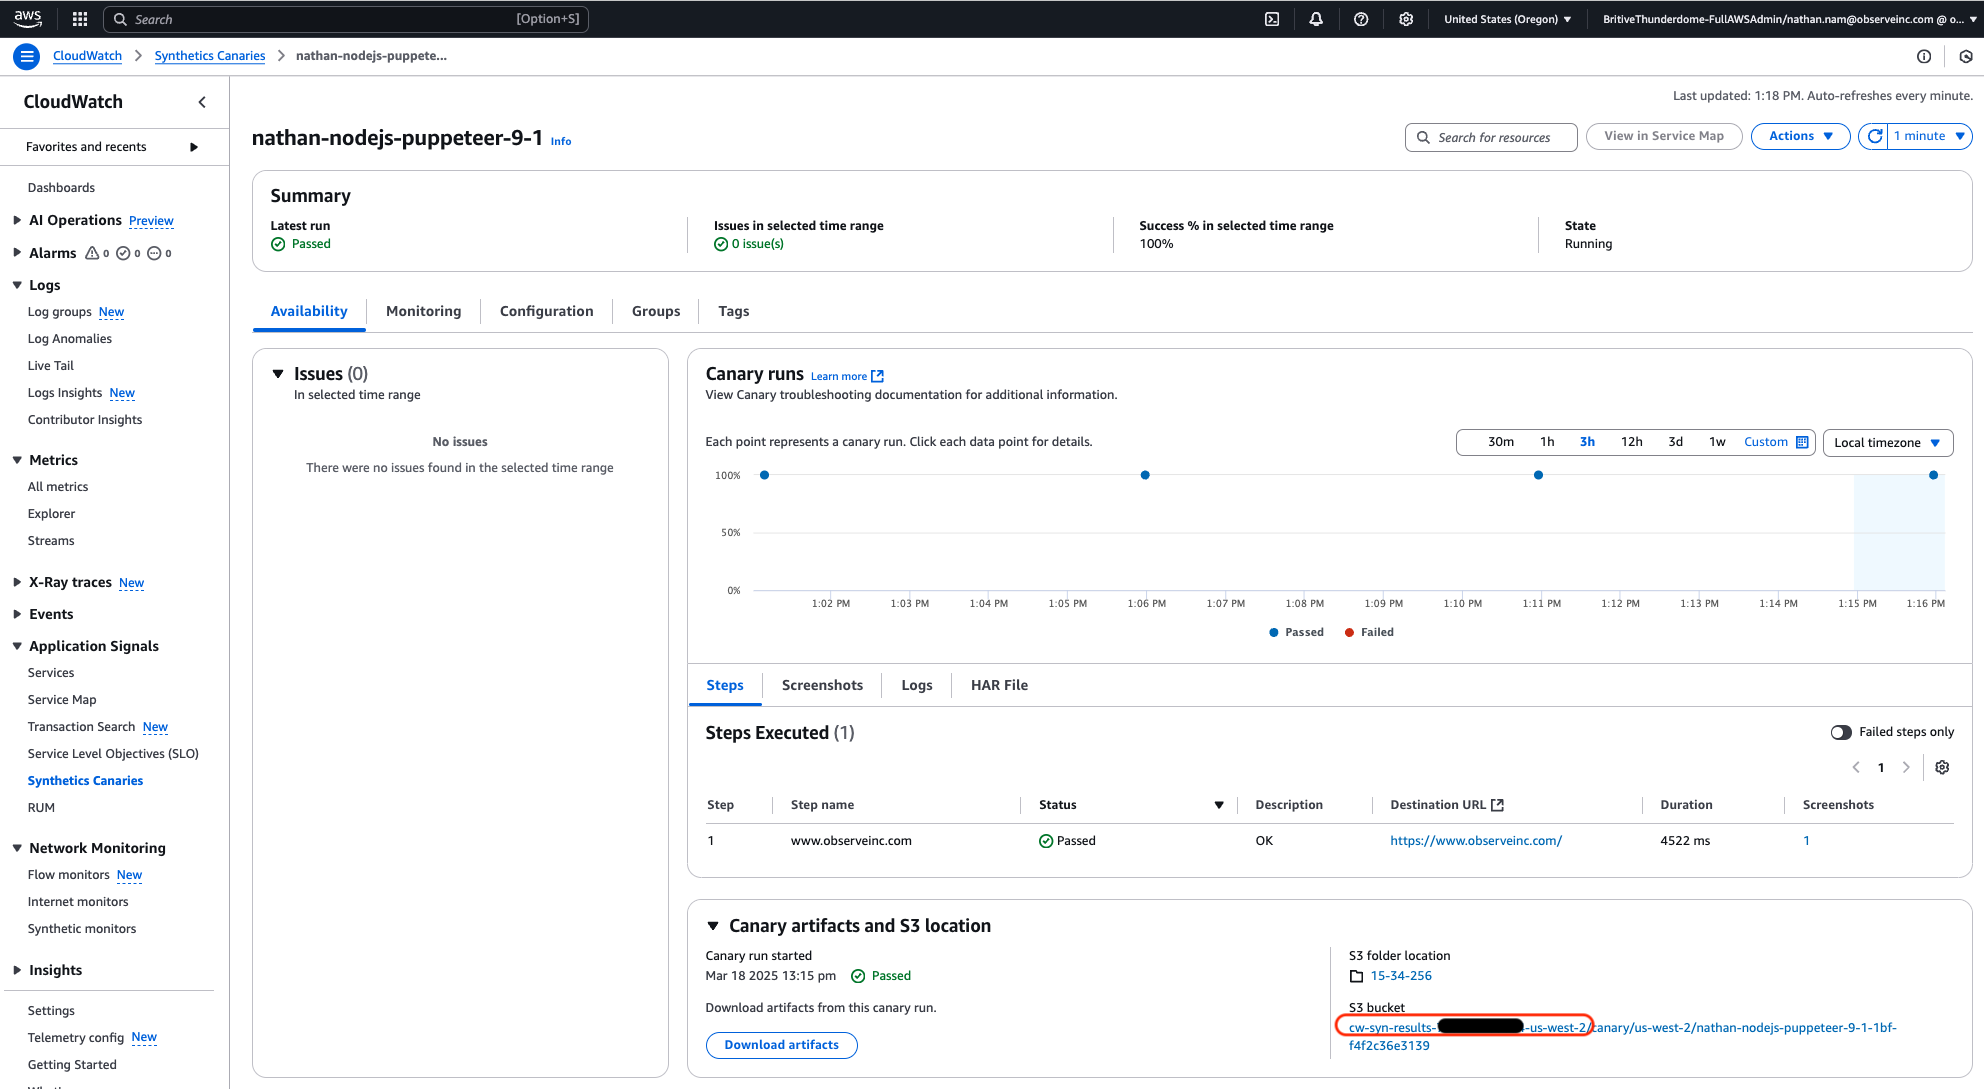
Figure 2 - Example S3 Bucket for Synthetics Canaries
Configure S3 Event Notifications. Open the Properties tab for the S3 bucket you identified.
Scroll down to Event Notifications.
Click on Create event Notification.
Configure the following information:
Event Name: the desired name of this event, such as “Canary artifact creation”
Suffix: .json
Event Types -> Object Creation: Check All object create events.
Destination -> Lambda function: Select your Observe Lambda function. (e.g.,
observe-legacy-aws-synthetics)
Click Save Changes.
Add Permission to the Lambda Role. In the Resources tab of the CloudFormation stack, locate the LambdaRole (e.g.,
observe-legacy-aws-synthetics-LambdaRole-LoHFWcxWz90U). Add the policy below, ensuring the Resource line matches the S3 bucket that stores your canary artifacts:
{
  "Version": "2012-10-17",
  "Statement": [
    {
      "Effect": "Allow",
      "Action": "s3:GetObject",
      "Resource": [
        "arn:aws:s3:::cw-syn-results-739672403694-us-west-2/*"
      ]
    }
  ]
}