Create a threshold metrics monitor
Note
This document refers to the legacy alerting system, known as Monitors v1. See Monitors and Alerts for the updated version (v2). Note that all v1 Monitors will continue to function and are not deprecated. We advise users to create new monitors via the updated version.
The Threshold metrics feature allows you to build metrics expressions for monitoring specific thresholds in Observe. For instance, you might want to monitor CPU usage for an application and receive an alert when it exceeds a specified threshold. Let’s take a tour of the metrics expression builder to understand the components.
Overview of Threshold Metrics Monitor
Section One - Metric Expression
Select a metric - When you click Select a metric, Observe displays a list of available metrics that you can select from to start configuring your monitor.
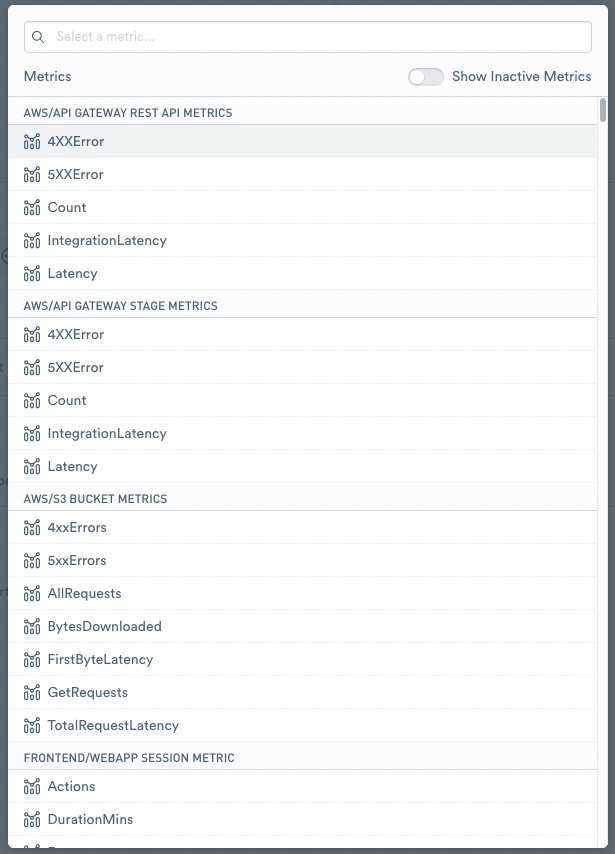
Figure 1 - Select from a list of available metrics.
where - select from a list of available filters for the metric. This is an optional parameter.
Sum by - the default value for the OPAL function is Sum by. You can select from the following list of available OPAL functions:
Any - Return any value of one column across a group.
Any not null - Return any non-null value of one column across a group. Can still return null if all values in the group are null
Average - Calculate the arithmetic average of the input expression across the group.
Count Values - Count the number of non-null items in the group.
Count Distinct Fast - Estimate the approximate number of distinct values in the input using
hyper-log-log.Count Distinct Exact - Count the exact number of distinct values in the input using complete enumeration.
Maximum - Compute the maximum of one column across a group (with one argument) or the scalar greatest value of its arguments (with more than one argument).
Median* - Return the fast approximate median value of one column.
Median Exact - Return the exact median value of one column.
Minimum - Compute the minimum of one column across a group with one argument or the scalar least value of its arguments with more than one argument.
Percentile(99) - Returns an approximated value for the specified percentile of the input expression across the group.
percentile(@."*metric*", .99Percentile(95) - Returns an approximated value for the specified percentile of the input expression across the group.
percentile(@."*metric*", .95Percentile(90) - Returns an approximated value for the specified percentile of the input expression across the group. percentile(@.”metric”, .90`
Percentile(75) - Returns an approximated value for the specified percentile of the input expression across the group. percentile(@.”metric”, .75`
Percentile(50) - Returns an approximated value for the specified percentile of the input expression across the group. percentile(@.”metric”, .50`
Standard Deviation - Calculate the standard deviation across the group.
Sum - Calculate the sum of the argument across the group or the scalar arguments if more than one.
Don’t Aggregate - Do not aggregate metrics across tag dimensions.
For more information about OPAL functions, see All OPAL functions.
Type a field - Select a field from the list of available fields to use with the metric.
Add metric - Add additional metrics to monitor.
Add formula - Add a formula to further refine your data. For instance, you can add
A*100to multiply your results by 100.Multiple Alerts - you can select if you want to receive multiple alerts or a single alert for alert conditions.
If you click the More icon next to Field, you can see the following options:
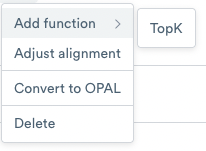
Figure 2 - More options for metric expressions
Add function>TopK - Selects all data for each of top k ranked groups.
Adjust alignment - Aggregates the metric to an average of the data over a minute.
Convert to OPAL - Converts the metric expression to OPAL.
Delete - Removes the metric expression from the monitor.
Section Two - Alert Notifications
Configure the Alert conditions for your metric. You can trigger an alert when the metric meets one of the following conditions.
equal to - equals the threshold.
greater than - greater than the threshold.
greater than or equal to - greater than or equal to the threshold.
less than - less than the threshold.
less than or equal to - less than or equal to the threshold.
Enter your threshold in the Alert threshold field. For instance, you may want to set a threshold greater than 90% for CPU utilization.
For more information on OPAL operators, see Data types and operators.
Section Three - Notifications
In the Notifications section, a list of events that could trigger a notification is displayed in this section. You can change the time range of the events by selecting a range from the dropdown list.
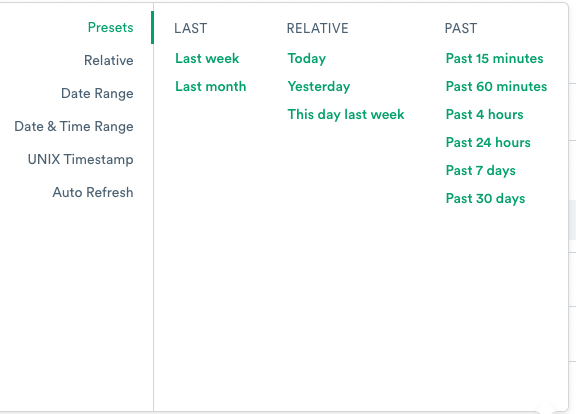
Figure 3 - Select a time range for triggering notifications.
The notifications also appear on the Logs & Events tab of the relevant Resource Pages. Select an Add Action from the dropdown list to send notifications to a Slack channel or email address.
In the Delivery text box, enter a custom description or comments for anyone receiving the notifications.
Configure Optional Notifications to send reminders at a configured time range until the notification no longer triggers.
Creating a Threshold metrics monitor
Use the Metrics Builder Expression tool to build a monitor based on metrics of a resource set or event stream.
Example One - CPU utilization metrics
Create a monitor that alerts you when CPU utilization exceeds a specified threshold.
Click Threshold metric to display the Metrics Expression Builder.
In the first section, select a metric. In this case, use the Search bar to locate the metric
cpu_utilization, and select it. The data automatically appears in the Monitor Expression section.
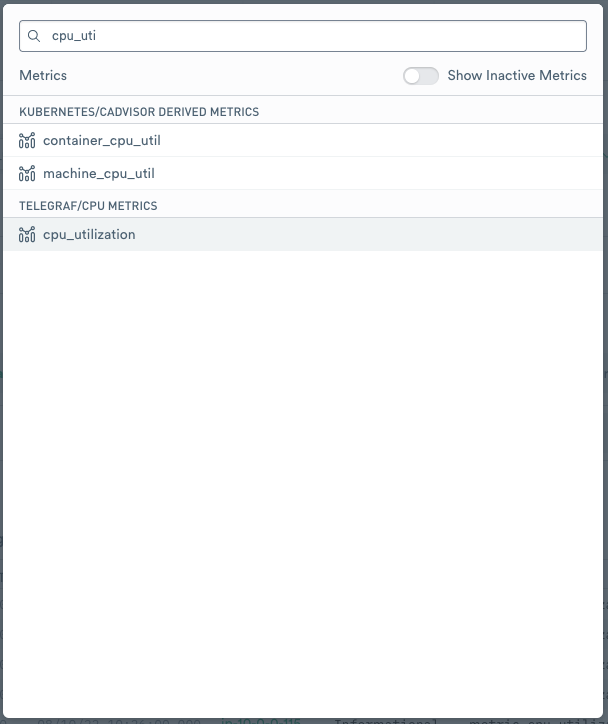
Figure 4 - Selecting a metric
3. The data doesn’t look exactly right as the expression uses Sum by to generate the data. Change Sum by to Average by selecting Average from the dropdown list.
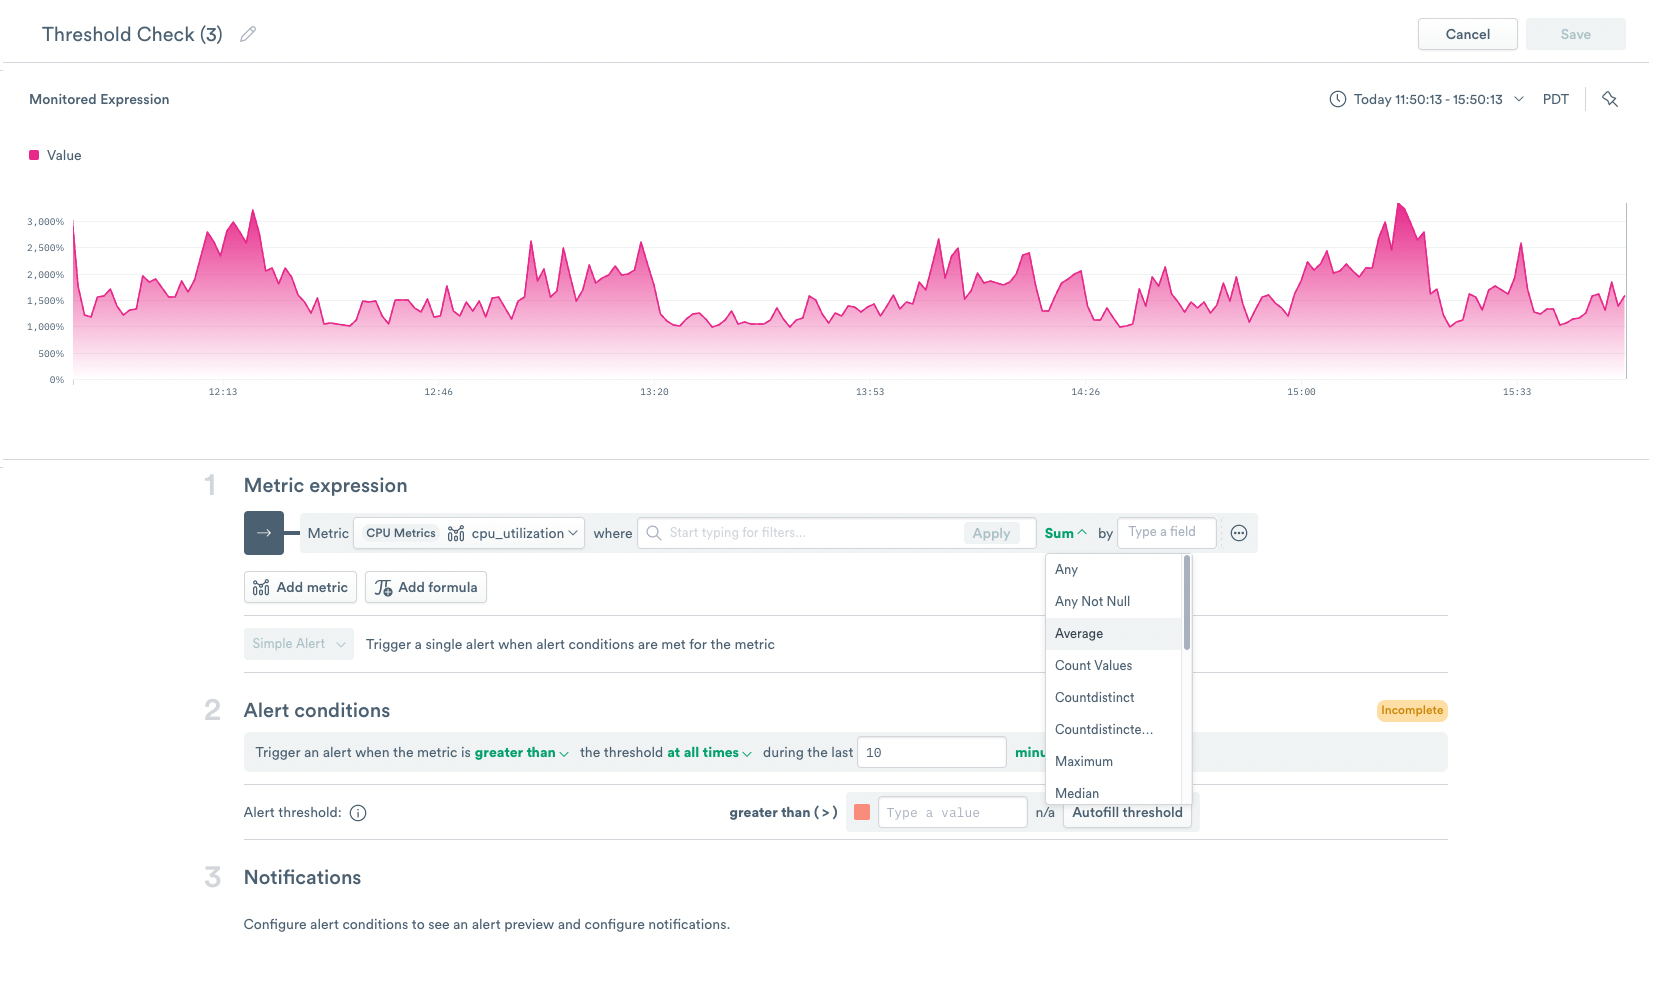
Figure 5 - Changing Sum by to Average by
4. Select Host from the list of available fields. You can now see CPU utilization as Average by Host.
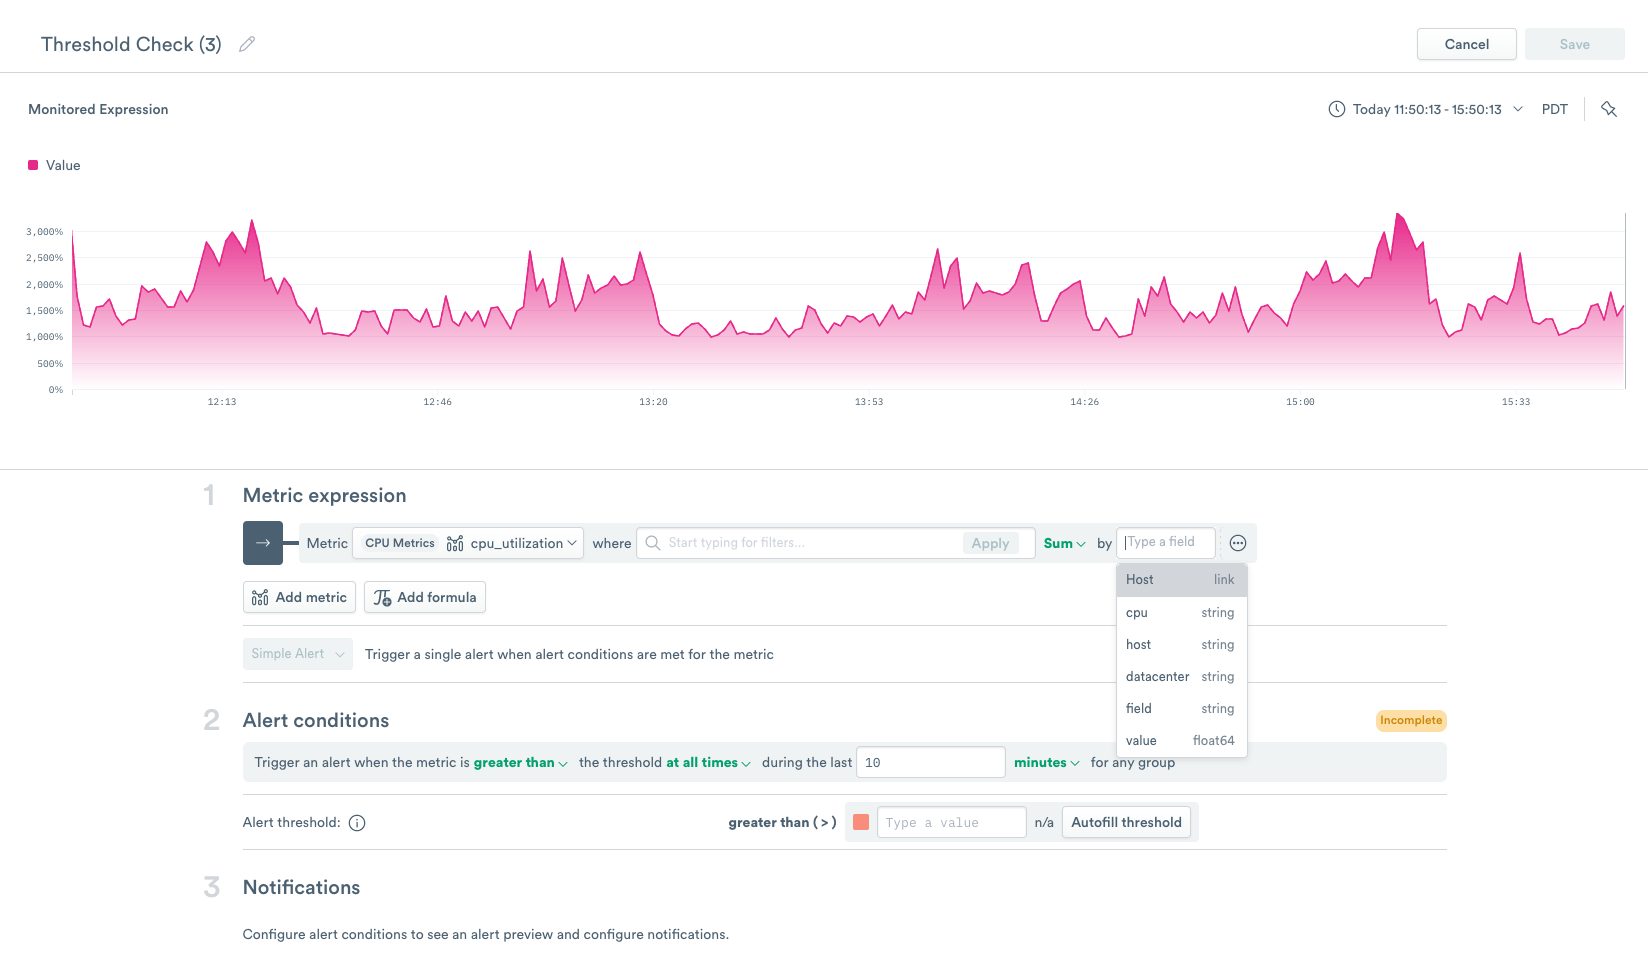
Figure 6 - Select Host from the available fields.
5. Now configure your Alert conditions. You can set the alert to notify you when the metric is greater than the threshold at all times during the last 10 minutes. Set the Alert threshold to greater than (>) 90 (90%).
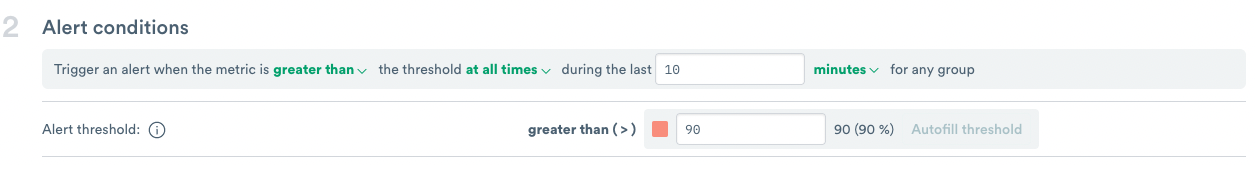
Figure 7 - Configuring the Alert conditions.
6. In the Notifications section, any notifications that trigger an alert appear as a list. These notifications appear in the Logs & Events tab of the relevant Resource Pages.
7. Select Add Action to send the notification. You can add multiple actions that receive notifications from this monitor.
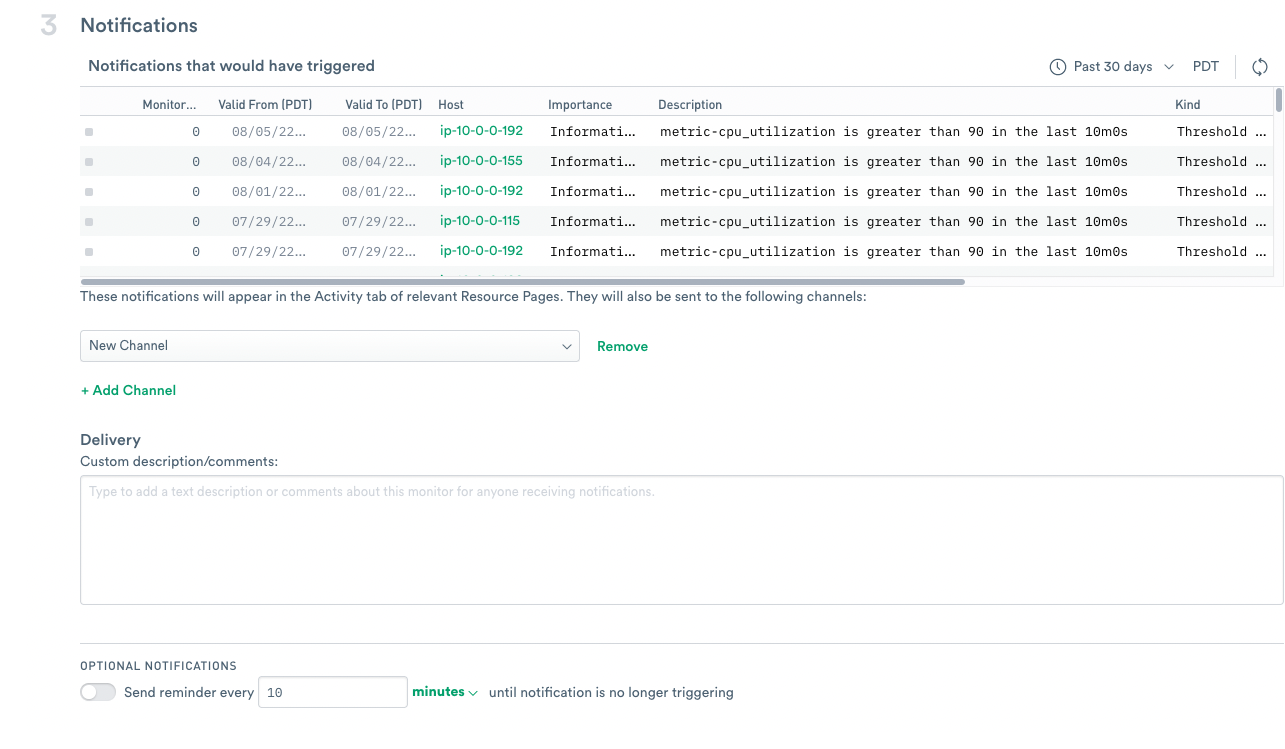
Figure 8 - Configuring Notifications
7. Change the Monitor name to CPU Monitor.
8. Click Save to save the monitor.
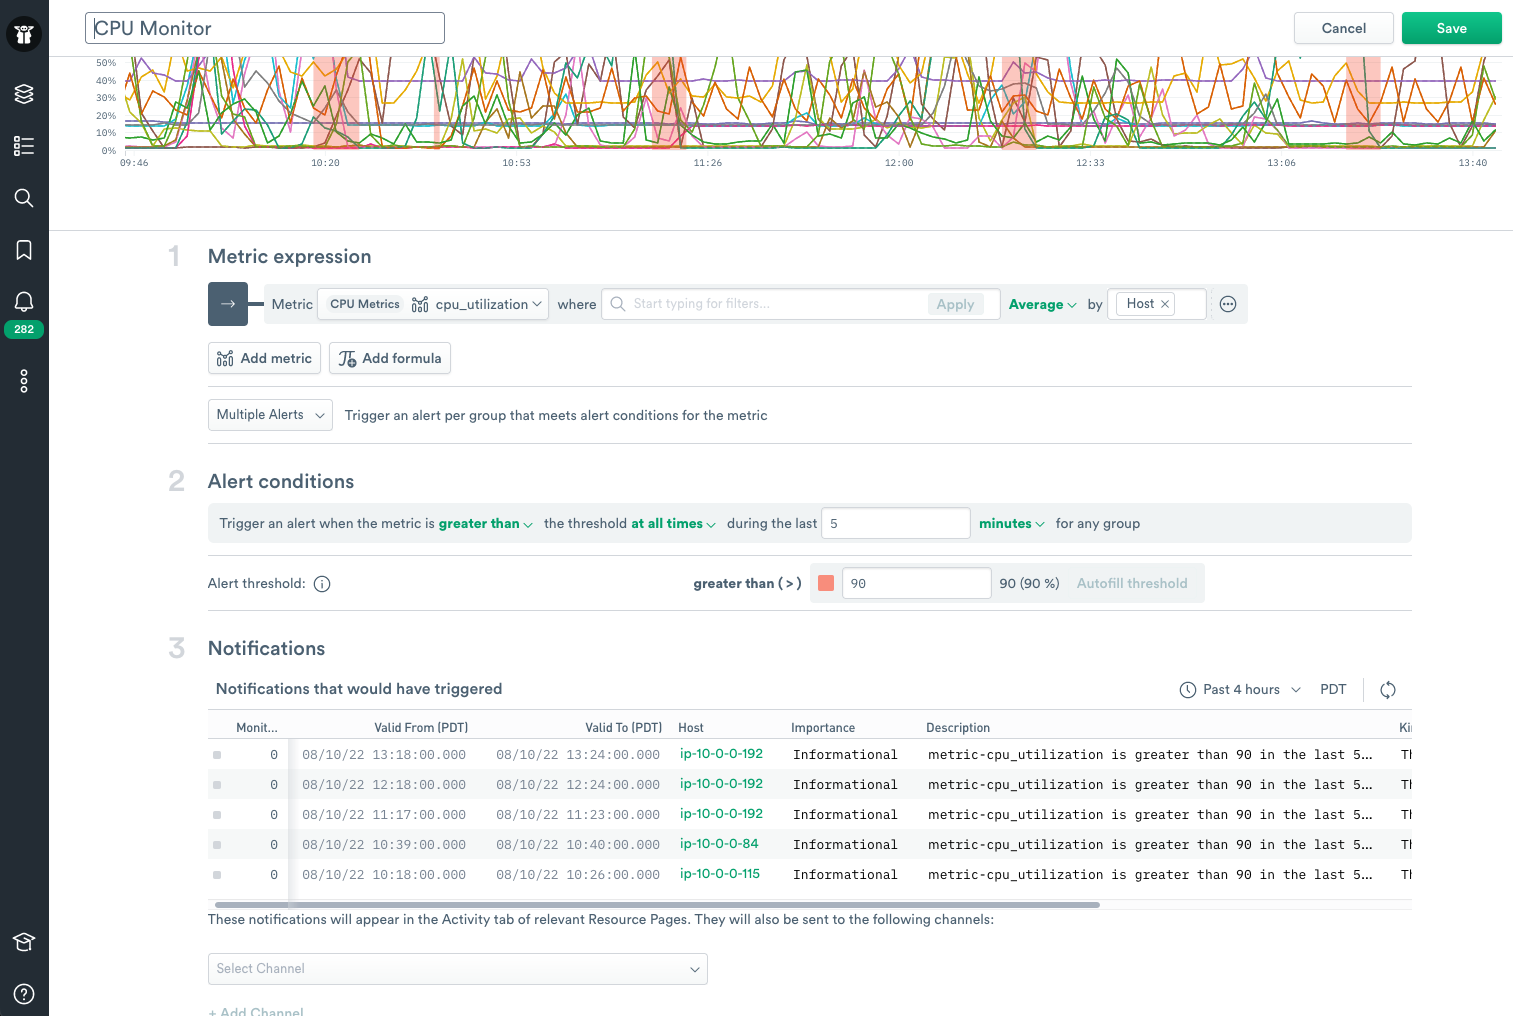
Figure 9 - Displaying Alerts
The red bars in the utilization graph indicate that the CPU utilization exceeded the configured threshold and triggered sending alerts to you. If you hover over the red bar, you can see the host or hosts that exceeded the utilization threshold.
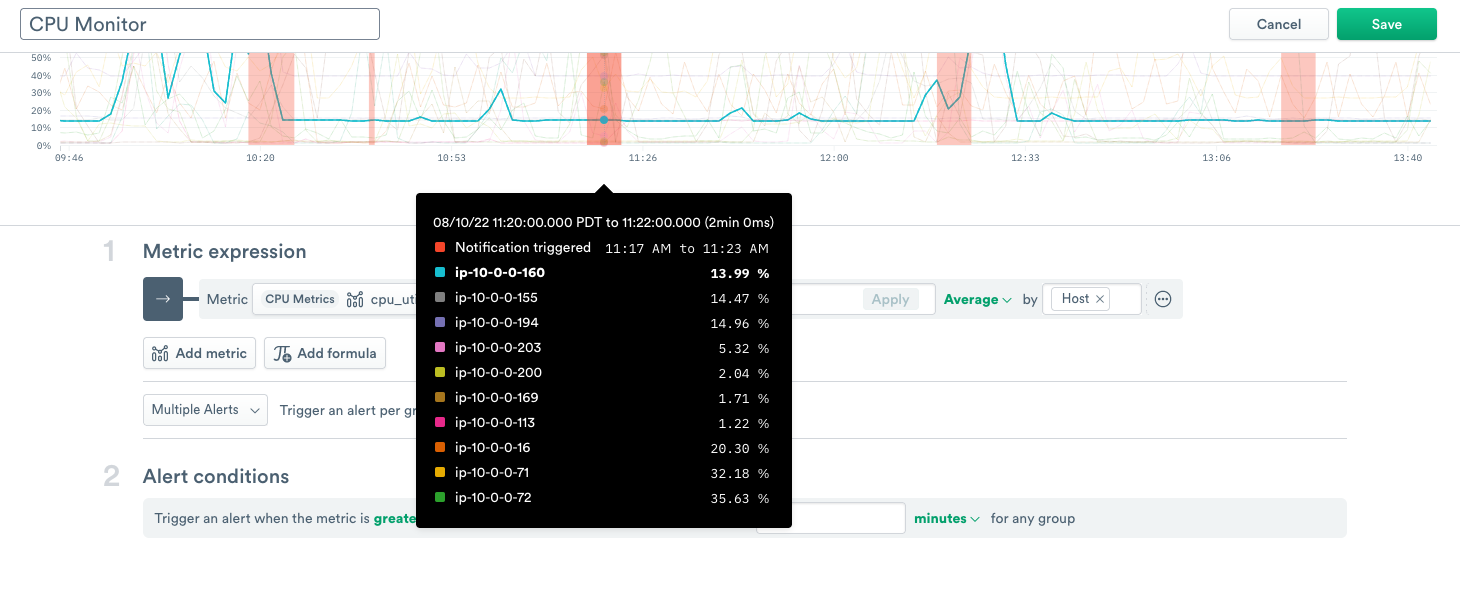
Figure 10 - Highlight of hosts triggering an alert
Example Two - Creating a threshold metric monitor based on rates
Click Threshold metric to display the Metrics Expression Builder.
In the first section, select a metric. In this case, use the Search bar to locate the metric `collector_request_errors_total’, and select it. The data automatically appears in the Monitor Expression section.
If you click the Other icon next to Field, and click Adjust alignment, notice that the alignment is based on Rate.
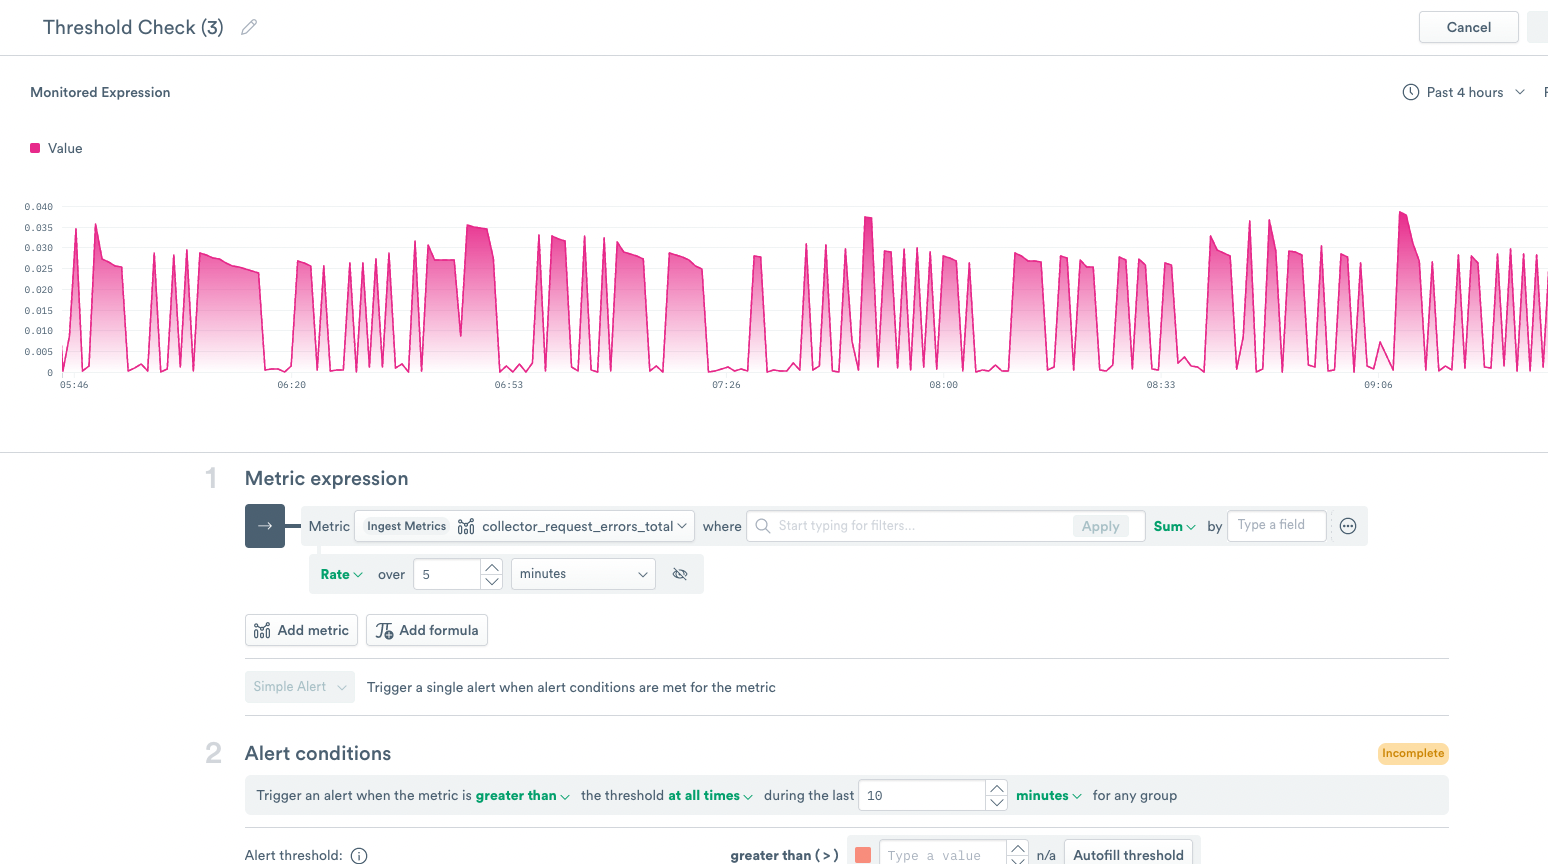
Figure 11 - IP addresses of the hosts triggering a notification
To look at the data as a percentage, add a Formula to the Metric Expression:
4. Click Formula and add the text A * 100. You now see more peaks in the data graph.
Example Three - Metric expression using multiple parameters
This example uses multiple metric expressions to create a monitor based on Kubernetes data.
Click Threshold metric to display the Metrics Expression Builder.
In the first section, select a metric. In this case, use the Search bar to locate the metric `container_memory_working_set_bytes’, and select it. The data automatically appears in the Monitor Expression section.
Select Container to sum by Container.
Add a second metric to the expression by clicking Metric and searching for
container_spec_memory_limit_bytes. Then select Container to sum by Container.
You want to know the memory utilization of a container and in order to see that, you have to divide the two metrics.
5. Add a formula, A/B * 100, to view the data as a percentage. Click Run.
6. Set the Alert condition to greater than the threshold at all times every 60 minutes. Configure the threshold as 60.
7. In the Notifications section, any notifications that trigger an alert appear as a list. These notifications appear in the Logs & Events tab of the relevant Resource Pages, and you can select a Shared Action to send the notification.
8. Change the Monitor name to K8s Monitor Example.
9. Click Save to save the monitor.
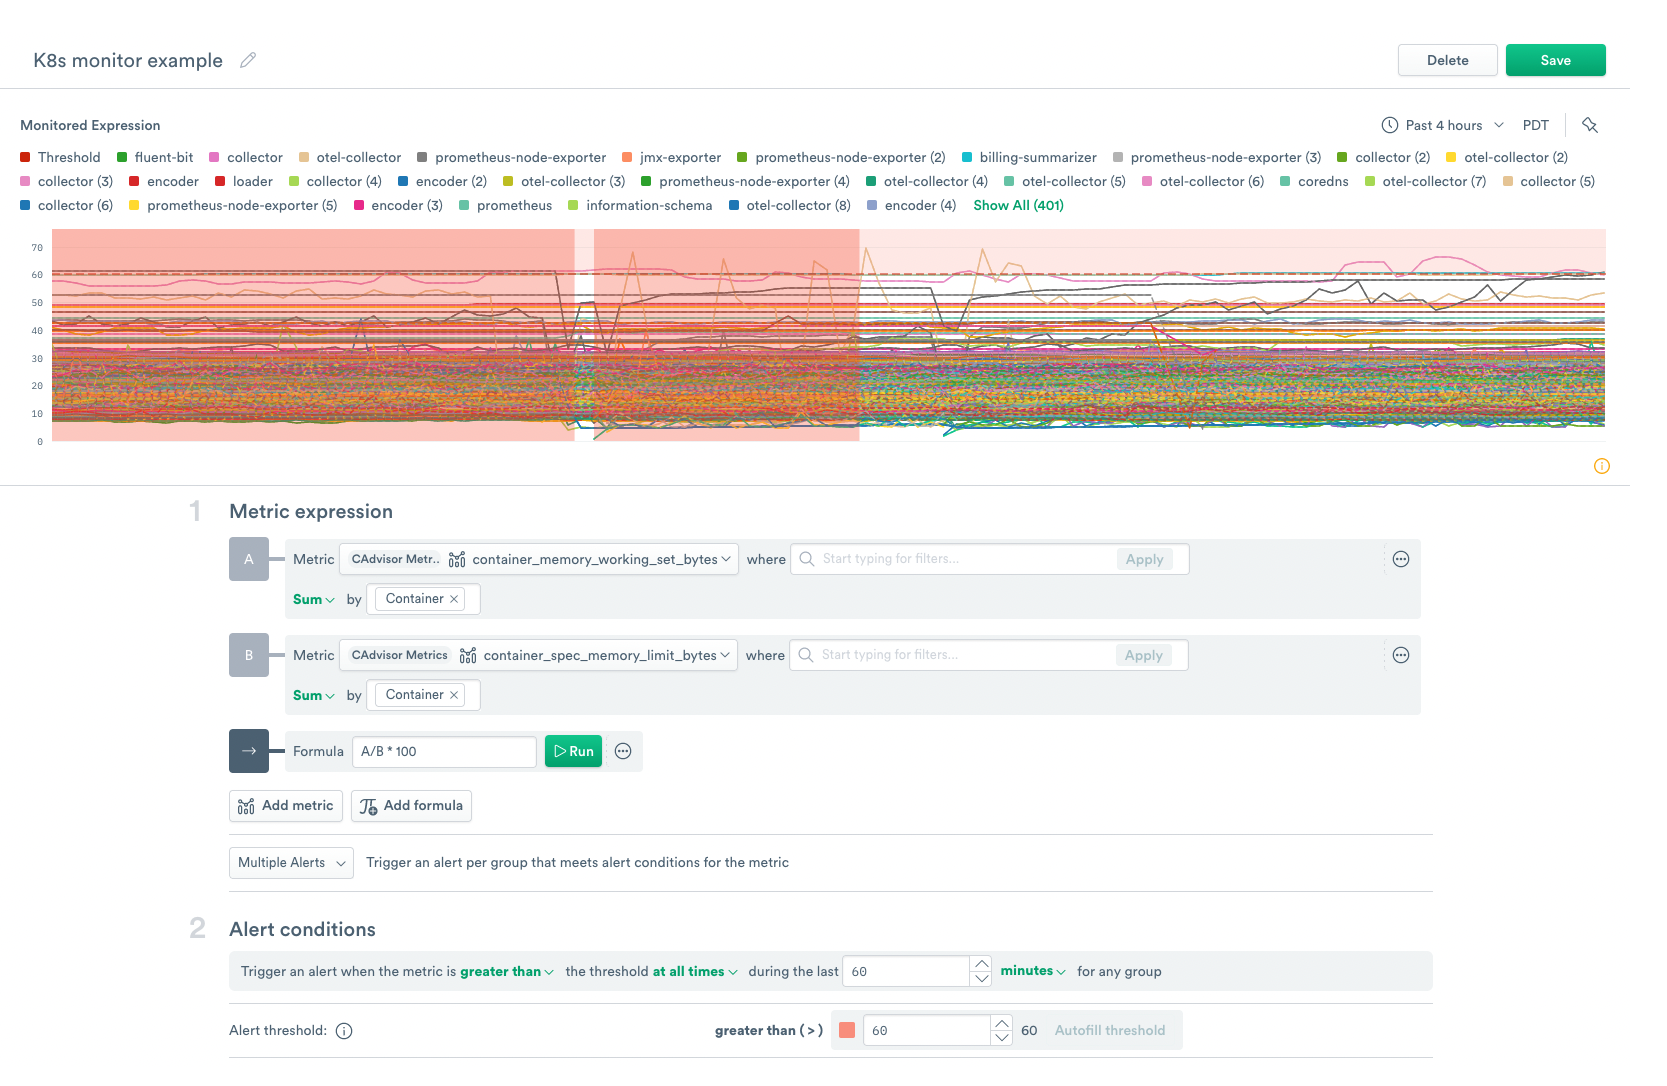
Figure 12 - Kubernetes Monitor Example
Observe provides the following templates to help you get started creating a Threshold Monitor:
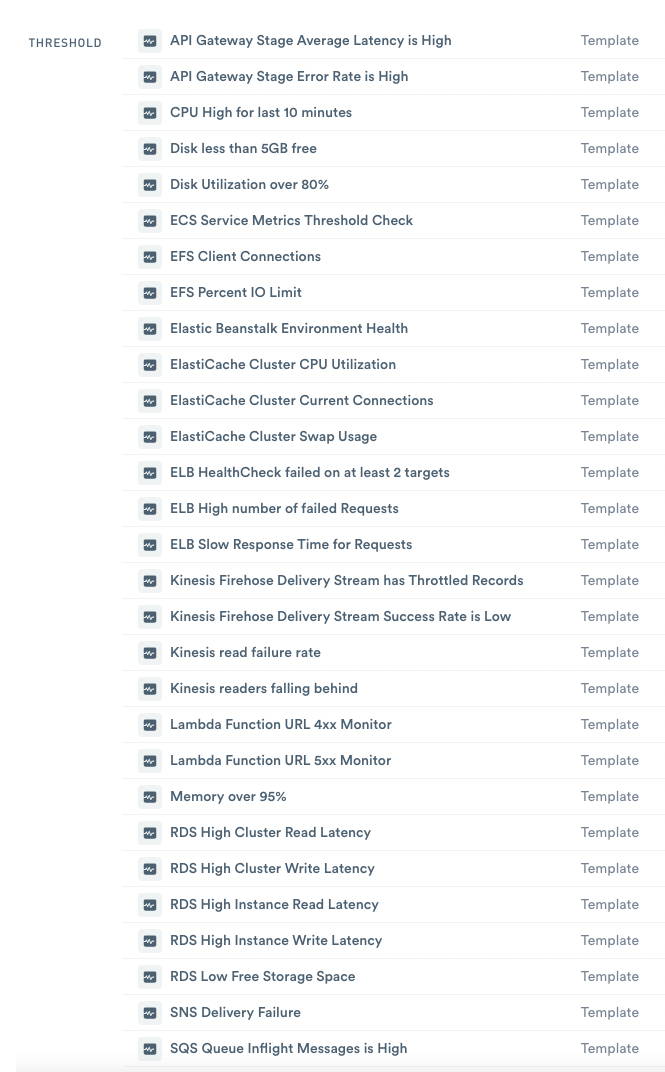
Figure 13 - List of Threshold Metrics Templates