GCP Cloud Load Balancing
Google Cloud Load Balancing is a GCP service for distributing user traffic across multiple instances of your applications. Use the Observe GCP app to gain insights into the health and performance of your Load Balancers and their underlying components.
Observe helps you monitor the health and activity of your load balancers with these features:
A dataset containing details of your load balancers, including requests and throughput.
A dashboard with at-a-glance insights about details like error counts and latency.
Additional datasets for LB health checks, access logs, metrics, forwarding rules, and more.
Sample Monitor configurations to alert on common problems, such as high error rates.
Viewing Cloud Load Balancer Activity in Observe
The Monitoring Dashboard
To see the health and activity of your Cloud Load Balancers, go to the Load Balancing Load Balancers dataset in Observe. The GCP/Load Balancing Monitoring dashboard provides an overview of the state of your load balancers.
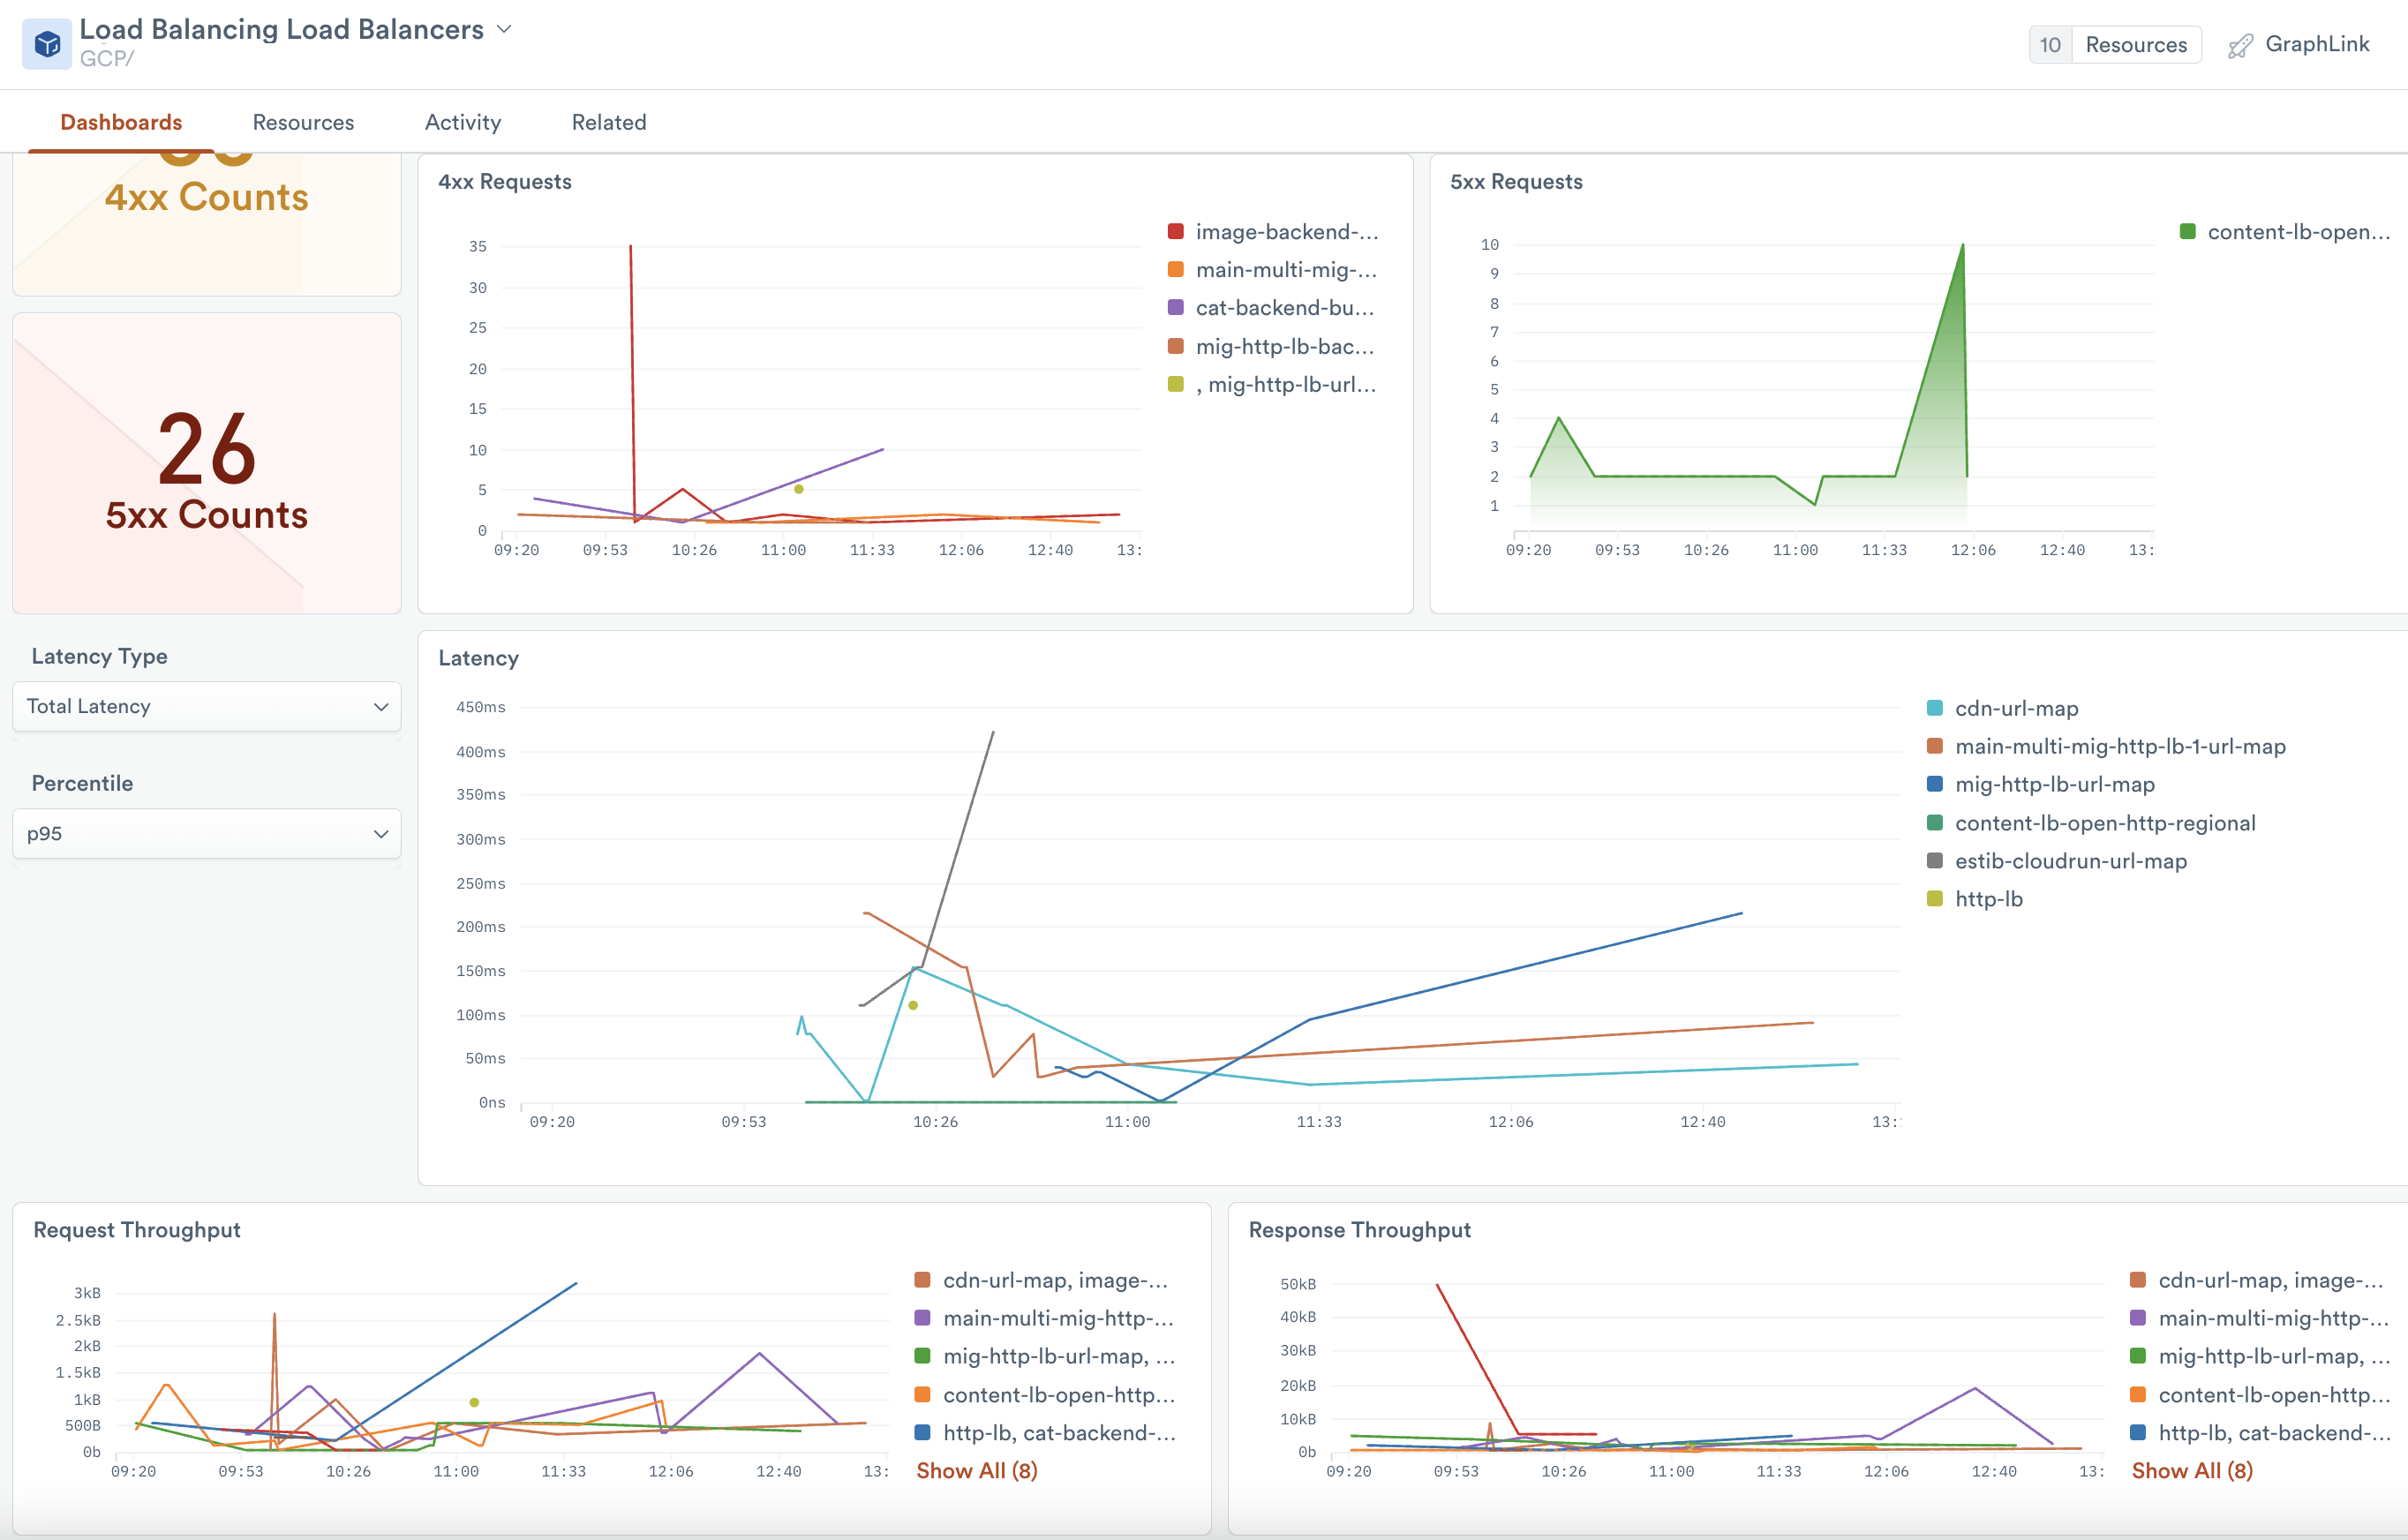
Figure 1 - The Monitoring dashboard for GCP Load Balancers
The dashboard gives a high-level overview of all your load balancers and details:
How many requests were served, with which response codes?
What is the response latency for requests on Load Balancers?
What is the throughput for L7 and L4 Load Balancers?
What are the RTT and Connection-counts for the L4 Load Balancers?
What configuration changes were applied to load balancers and their underlying components?
Which Backends and Health Checks have incomplete logging configurations?
For a complete list of the GCP metrics collected, see GCP Cloud Load Balancer metrics.
Monitors
Monitor templates for Cloud Load Balancing include:
Load Balancing LB Backend in non-healthy state - Alerts if any LB health check status transitions from HEALTHY to any non-HEALTHY status
High 4xx rate for an LB backend - Alerts if the count of 4xx responses consists of more than 1% of the overall response count.
High 5xx rate for an LB backend - Alerts if the count of 5xx responses consists of more than 1% of the overall response count.
To use a template, go to the list of templates on the Monitors page and select Duplicate for the one you wish to use. Make any desired configuration changes on the Create a Monitor page and save to enable it.
Setup
Install the Observe GCP app from the Apps page. See Observe apps for information on apps and how to install them.
Metrics
The default GCP app configuration adds loadbalancing.googleapis.com to the include_metric_type_prefixes option to enable data collection for metrics. If you have installed the app with custom settings, you may need to update the configuration to add this option.
Audit Logs
To enable logs, edit your backend service in GCP and select enable logging. Logs for backend buckets are enabled by default.
Health Check Logs
Health check logs capture state-changes of your LB backend groups. To enable them, edit your health check in GCP and set Logs to on.